An official website of the United States government
An official website of the United States government
The .gov means it's official.
Federal government websites often end in .gov or .mil. Before sharing sensitive information,
make sure you're on a federal government site.
The site is secure.
The
https:// ensures that you are connecting to the official website and that any
information you provide is encrypted and transmitted securely.
26-24-DAL
Monday, January 05, 2026
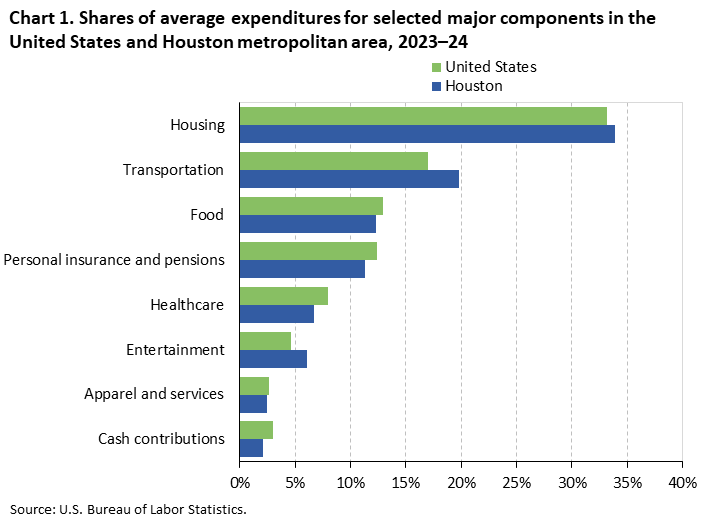
Households in the Houston-The Woodlands-Sugar Land, TX, metropolitan area spent an average of $85,377 per year in 2023–24, the U.S. Bureau of Labor Statistics reported today. Acting Regional Commissioner Jerome Watters noted that food, housing, and transportation expenditures together accounted for 66.0 percent of the area’s household budget. (See chart 1 and table 1.) Nationally, these three components accounted for 63.2 percent of household spending.
Average expenditures among the 22 published metropolitan areas nationwide ranged from $117,578 in San Francisco to $64,027 in Miami. Nationally, the average annual household expenditure was $77,907.
Data in this release are from the Consumer Expenditure Surveys (CE), which the U.S. Census Bureau conducts for the U.S. Bureau of Labor Statistics. The data in this release were averaged over a 2-year period. Data for the nation, the four geographic regions of the United States, and 22 metropolitan areas nationwide are available via published tables. The CE provides a glossary of terms for reader convenience. Technical and related information are available in the Consumer Expenditures and Income Handbook of Methods.
The Houston-The Woodlands-Sugar Land, TX Metropolitan Statistical Area comprises Austin, Brazoria, Chambers, Fort Bend, Galveston, Harris, Liberty, Montgomery, and Waller Counties in Texas. MSA definitions and details for areas referenced in this release are available online.
Differences in spending among metropolitan areas may reflect differences in the cost of living, but they also may reflect other causes. Spending differences may result from different consumer preferences or variations in demographic characteristics, such as household size, age, or income levels. However, expenditure shares, or the percentage of a household’s budget spent on a particular component, can be used to compare spending patterns across areas. Sample sizes for the metropolitan areas are much smaller than for the nation, so the U.S. estimates and year-to-year changes are more reliable than those for the metropolitan areas. Users should also keep in mind that prices for many goods and services have changed since the survey was conducted.
Other metropolitan area news releases for the Consumer Expenditure Survey are available online.
Information in this release will be made available to individuals with sensory impairments upon request. Voice phone: (202) 691-5200; Telecommunications Relay Service: 7-1-1.
| Category | United States |
Houston |
|---|---|---|
|
Consumer unit characteristics: |
||
|
Income before taxes ($) |
103,012 | 105,805 |
|
Age of reference person (years) |
52.1 | 48.8 |
|
Average number in consumer unit: |
||
|
People |
2.5 | 2.8 |
|
Children under 18 |
0.6 | 0.7 |
|
Adults 65 and over |
0.4 | 0.3 |
|
Earners |
1.3 | 1.4 |
|
Vehicles |
1.9 | 1.7 |
|
Percent homeowner |
65 | 60 |
|
Average annual expenditures ($) |
77,907 | 85,377 |
|
Percent distribution |
||
|
Total |
100.0 | 100.0 |
|
Food |
12.9 | 12.3 |
|
Alcoholic beverages |
0.8 | 0.7 |
|
Housing |
33.2 | 33.9 |
|
Apparel and services |
2.6 | 2.5 |
|
Transportation |
17.0 | 19.8 |
|
Healthcare |
8.0 | 6.7 |
|
Entertainment |
4.6 | 6.1 |
|
Personal care products and services |
1.2 | 1.3 |
|
Reading |
0.2 | 0.2 |
|
Education |
2.0 | 1.1 |
|
Tobacco products and smoking supplies |
0.5 | 0.4 |
|
Miscellaneous |
1.6 | 1.6 |
|
Cash contributions |
3.0 | 2.1 |
|
Personal insurance and pensions |
12.4 | 11.3 |
| Area | Housing | Transportation | Food |
|---|---|---|---|
|
United States |
33.2 | 17.0 | 12.9 |
|
Anchorage |
34.3 | 16.2 | 13.2 |
|
Atlanta |
33.5 | 16.4 | 12.0 |
|
Baltimore |
30.7 | 16.9 | 14.2 |
|
Boston |
35.5 | 13.8 | 12.8 |
|
Chicago |
32.3 | 15.2 | 13.7 |
|
Dallas-Fort Worth |
33.8 | 18.6 | 11.8 |
|
Denver |
33.8 | 17.0 | 11.6 |
|
Detroit |
31.3 | 17.3 | 12.5 |
|
Honolulu |
36.9 | 13.7 | 16.4 |
|
Houston |
33.9 | 19.8 | 12.3 |
|
Los Angeles |
36.6 | 16.0 | 13.1 |
|
Miami |
40.0 | 18.0 | 11.5 |
|
Minneapolis-St. Paul |
32.0 | 15.9 | 11.5 |
|
New York |
38.2 | 13.6 | 12.8 |
|
Philadelphia |
34.5 | 14.1 | 13.1 |
|
Phoenix |
31.4 | 17.9 | 10.5 |
|
San Diego |
37.4 | 18.1 | 11.2 |
|
San Francisco |
36.2 | 15.0 | 12.5 |
|
Seattle |
34.7 | 15.0 | 12.5 |
|
St. Louis |
29.1 | 17.3 | 13.8 |
|
Tampa |
37.8 | 16.8 | 11.3 |
|
Washington, DC |
32.7 | 15.9 | 11.9 |
Last Modified Date: Monday, January 05, 2026