An official website of the United States government
An official website of the United States government
The .gov means it's official.
Federal government websites often end in .gov or .mil. Before sharing sensitive information,
make sure you're on a federal government site.
The site is secure.
The
https:// ensures that you are connecting to the official website and that any
information you provide is encrypted and transmitted securely.
21-629-SAN
Tuesday, April 06, 2021
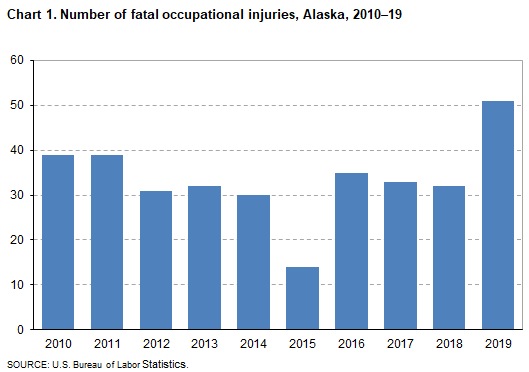
Fatal work injuries totaled 51 in 2019 for Alaska, the U.S. Bureau of Labor Statistics reported today. Acting Regional Commissioner Dennis Reid noted that the number of work-related fatalities in Alaska was up from the previous year. (See chart 1.) Fatal occupational injuries in the state have ranged from a high of 91 in 1992 to a low of 14 in 2015.
Nationwide, a total of 5,333 fatal work injuries were recorded in 2019, a 2-percent increase from the 5,250 in 2018, according to the results from the Census of Fatal Occupational Injuries (CFOI) program. The 5,333 fatal occupational injuries in 2019 represents the largest annual number since 2007.
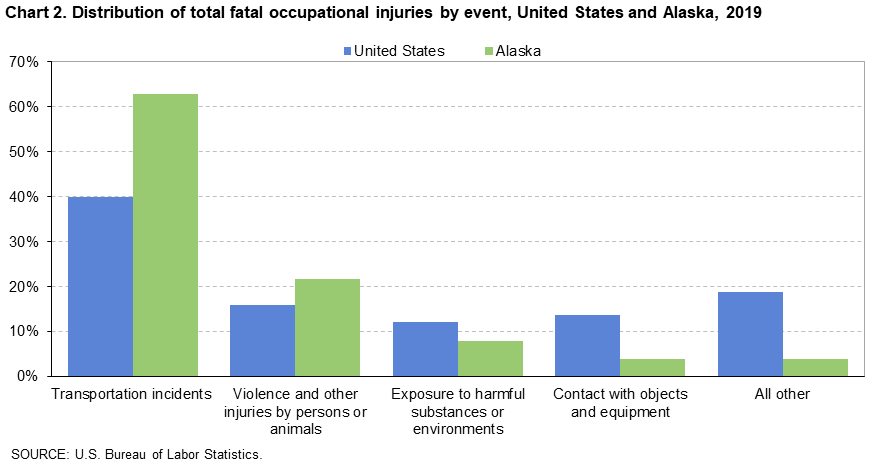
Fatal event or exposureIn Alaska, transportation incidents resulted in 32 fatal work injuries and violence and other injuries by persons or animals accounted for 11 fatalities. These two major categories accounted for 84 percent of all workplace fatalities in the state. (See table 1.) Worker deaths from transportation incidents were up from 18 over the year and worker fatalities due to violence or other injuries by persons or animals were up from 7. Exposure to harmful substances or environments was the third-most frequent fatal work event with four fatalities.
Nationally, transportation incidents were the most frequent fatal workplace event in 2019, accounting for 40 percent of fatal work injuries. (See chart 2.) Falls, slips, and trips was the second-most common fatal event (17 percent), followed by violence and other injuries by persons or animals (16 percent).
IndustryThe private agriculture, forestry, fishing and hunting industry, as well as the transportation and warehousing industry, had the highest number of fatalities in Alaska with 11 each. (See table 2.) Within agriculture, forestry, fishing and hunting, the fishing sector accounted for all 11 fatalities. The air transportation sector accounted for 4 of the 11 workplace fatalities within transportation and warehousing.
The government sector had 11 workplace fatalities, 8 of which occurred in the federal government.
OccupationThe transportation and material moving occupational group had the highest number of workplace fatalities with 11. (See table 3.) Commercial pilots accounted for 5 of the 11 fatalities among transportation and material moving workers. The farming, fishing, and forestry occupational group had the second highest number of workplace fatalities with 10. Within the group, fishing and hunting workers accounted for all 10 occupational fatalities.
Additional highlights:Data in this news release are for reference year 2019. No changes in collection procedures or outputs were necessary due to COVID-19. Additional information is available at www.bls.gov/covid19/effects-of-covid-19-on-workplace-injuries-and-illnesses-compensation-and-occupational-requirements.htm.
Information in this release incorporates revisions to both the North American Industry Classification System (NAICS) and the Standard Occupational Classification codes (SOC). Comparison of data for 2019 to prior years should be done with caution due to these changes, and thus analysis in this release is limited to 2019 for industries and occupations. More information on NAICS can be found at www.bls.gov/bls/naics.htm. More information on SOC can be found at www.bls.gov/soc/2018/home.htm.
Background of the program. The Census of Fatal Occupational Injuries (CFOI), part of the Bureau of Labor Statistics (BLS) Occupational Safety and Health Statistics (OSHS) program, is a count of all fatal work injuries occurring in the U.S. during the calendar year. The CFOI uses a variety of state, federal, and independent data sources to identify, verify, and describe fatal work injuries. This ensures counts are as complete and accurate as possible. For the 2019 national data, over 25,100 unique source documents were reviewed as part of the data collection process. For technical information and definitions for the CFOI, see the BLS Handbook of Methods on the BLS website at https://www.bls.gov/opub/hom/cfoi/home.htm and the CFOI definitions at www.bls.gov/iif/oshcfdef.htm.
Federal/State agency coverage. The CFOI includes data for all fatal work injuries, some of which may be outside the scope of other agencies or regulatory coverage. Comparisons between CFOI counts and those released by other agencies should account for the different coverage requirements and definitions used by each agency. For more information on the scope of CFOI, see www.bls.gov/iif/cfoiscope.htm and www.bls.gov/opub/hom/cfoi/concepts.htm.
Acknowledgments. BLS thanks the Alaska Department of Labor and Workforce Development for their efforts in collecting accurate, comprehensive, and useful data on fatal work injuries. BLS also appreciates the efforts of all federal, state, local, and private sector entities that provided source documents used to identify fatal work injuries. Among these agencies are the Occupational Safety and Health Administration; the National Transportation Safety Board; the U.S. Coast Guard; the Mine Safety and Health Administration; the Office of Workers’ Compensation Programs (Federal Employees' Compensation and Longshore and Harbor Workers' Compensation divisions); the Federal Railroad Administration; the National Highway Traffic Safety Administration; state vital statistics registrars, coroners, and medical examiners; state departments of health, labor, and industrial relations and workers' compensation agencies; state and local police departments; and state farm bureaus.
Information in this release will be made available to individuals with sensory impairments upon request. Voice phone: (202) 691-5200; Federal Relay Service: (800) 877-8339.
| Event or exposure (1) | 2018 | 2019 | |
|---|---|---|---|
| Number | Number | Percent | |
Total | 32 | 51 | 100 |
Violence and other injuries by persons or animals | 7 | 11 | 22 |
Intentional injury by person | 6 | 10 | 20 |
Intentional injury by other person | 1 | 2 | 4 |
Shooting by other person--intentional | -- | 2 | 4 |
Self-inflicted injury--intentional | 5 | 8 | 16 |
Shooting--intentional self-harm | 3 | 4 | 8 |
Injury by person--unintentional or intent unknown | -- | 1 | 2 |
Injury by other person--unintentional or intent unknown | -- | 1 | 2 |
Shooting by other person--unintentional | -- | 1 | 2 |
Transportation incidents | 18 | 32 | 63 |
Aircraft incidents | 6 | 13 | 25 |
Aircraft crash during takeoff or landing | 1 | 8 | 16 |
Aircraft crash during takeoff or landing--into structure, object, or ground | 1 | 8 | 16 |
Other in-flight crash | 5 | 5 | 10 |
Other in-flight crash between air vehicles | 1 | 1 | 2 |
Water vehicle incidents | 10 | 11 | 22 |
Capsized or sinking water vehicle | 4 | 5 | 10 |
Fall or jump and struck by water vehicle | -- | 1 | 2 |
Fall or jump from water vehicle | 3 | 3 | 6 |
Roadway incidents involving motorized land vehicle | 2 | 5 | 10 |
Roadway collision with other vehicle | 1 | 1 | 2 |
Roadway collision--moving in opposite directions, oncoming | -- | 1 | 2 |
Nonroadway incident involving motorized land vehicles | -- | 3 | 6 |
Nonroadway collision with object other than vehicle | -- | 1 | 2 |
Nonroadway noncollision incident | -- | -- | -- |
Jack-knifed or overturned, nonroadway | -- | 1 | 2 |
Fires and explosions | -- | -- | -- |
Falls, slips, trips | -- | -- | -- |
Exposure to harmful substances or environments | 3 | 4 | 8 |
Contact with objects and equipment | -- | 2 | 4 |
Struck by object or equipment | -- | 2 | 4 |
Struck by powered vehicle--nontransport | -- | 2 | 4 |
Struck or run over by rolling powered vehicle | -- | 1 | 2 |
Struck by powered vehicle tipping over--nontransport | -- | 1 | 2 |
Overexertion and bodily reaction | -- | -- | -- |
Footnotes: | |||
NOTE: Data for all years are final. Totals for major categories may include subcategories not shown separately. For complete information on how the data are coded and presented see our definitions page at https://www.bls.gov/iif/oshcfdef.htm. Dashes indicate no data reported or data that do not meet publication criteria. CFOI fatal injury counts exclude illness-related deaths unless precipitated by an injury event. | |||
| Industry (1) | Number | Percent |
|---|---|---|
Total | 51 | 100 |
Private industry (2) | 40 | 78 |
Goods producing | -- | -- |
Natural resources and mining | 11 | 22 |
Agriculture, forestry, fishing and hunting | 11 | 22 |
Fishing, hunting and trapping | 11 | 22 |
Fishing | 11 | 22 |
Fishing | 11 | 22 |
Finfish fishing | 4 | 8 |
Shellfish fishing | 5 | 10 |
Construction | 3 | 6 |
Construction | 3 | 6 |
Service providing (3) | -- | -- |
Trade, transportation, and utilities | -- | -- |
Retail trade | 2 | 4 |
Gasoline stations | 1 | 2 |
Gasoline stations | 1 | 2 |
Gasoline stations with convenience stores | 1 | 2 |
Nonstore retailers | 1 | 2 |
Direct selling establishments | 1 | 2 |
Fuel dealers | 1 | 2 |
Transportation and warehousing | 11 | 22 |
Air transportation | 4 | 8 |
Scheduled air transportation | 1 | 2 |
Scheduled air transportation | 1 | 2 |
Nonscheduled air transportation | 3 | 6 |
Nonscheduled air transportation | 3 | 6 |
Water transportation | 2 | 4 |
Deep sea, coastal, and Great Lakes water transportation | 2 | 4 |
Deep sea, coastal, and Great Lakes water transportation | 2 | 4 |
Truck transportation | 3 | 6 |
Specialized freight trucking | 1 | 2 |
Specialized freight (except used goods) trucking, local | 1 | 2 |
Financial activities | -- | -- |
Professional and business services | 3 | 6 |
Professional, scientific, and technical services | 1 | 2 |
Professional, scientific, and technical services | 1 | 2 |
Legal services | 1 | 2 |
Offices of lawyers | 1 | 2 |
Administrative and support and waste management and remediation services | 2 | 4 |
Administrative and support services | 2 | 4 |
Educational and health services | -- | -- |
Educational services | 1 | 2 |
Educational services | 1 | 2 |
Leisure and hospitality | 1 | 2 |
Accommodation and food services | 1 | 2 |
Accommodation | 1 | 2 |
Traveler accommodation | 1 | 2 |
Hotels (except casino hotels) and motels | 1 | 2 |
Other services, except public administration | -- | -- |
Government (4) | 11 | 22 |
Federal government | 8 | 16 |
State government | -- | -- |
Local government | -- | -- |
Footnotes: | ||
NOTE: Data for all years are final. Totals for major categories may include subcategories not shown separately. For complete information on how the data are coded and presented see our definitions page at https://www.bls.gov/iif/oshcfdef.htm. Dashes indicate no data reported or data that do not meet publication criteria. CFOI fatal injury counts exclude illness-related deaths unless precipitated by an injury event. | ||
| Occupation (1) | Number | Percent |
|---|---|---|
Total | 51 | 100 |
Management occupations | -- | -- |
Business and financial operations occupations | -- | -- |
Computer and mathematical occupations | -- | -- |
Architecture and engineering occupations | -- | -- |
Life, physical, and social science occupations | 2 | 4 |
Life scientists | 2 | 4 |
Community and social service occupations | -- | -- |
Legal occupations | 1 | 2 |
Educational instruction and library occupations | -- | -- |
Arts, design, entertainment, sports, and media occupations | -- | -- |
Healthcare practitioners and technical occupations | 5 | 10 |
Healthcare diagnosing or treating practitioners | 2 | 4 |
Registered nurses | 2 | 4 |
Registered nurses | 2 | 4 |
Health technologists and technicians | 3 | 6 |
Healthcare support occupations | -- | -- |
Protective service occupations | 2 | 4 |
Other protective service workers | 2 | 4 |
Security guards and gambling surveillance officers | 2 | 4 |
Security guards | 2 | 4 |
Food preparation and serving related occupations | 2 | 4 |
Supervisors of food preparation and serving workers | 1 | 2 |
Supervisors of food preparation and serving workers | 1 | 2 |
Chefs and head cooks | 1 | 2 |
Cooks and food preparation workers | 1 | 2 |
Food preparation workers | 1 | 2 |
Food preparation workers | 1 | 2 |
Building and grounds cleaning and maintenance occupations | 1 | 2 |
Building cleaning and pest control workers | 1 | 2 |
Building cleaning workers | 1 | 2 |
Janitors and cleaners, except maids and housekeeping cleaners | 1 | 2 |
Personal care and service occupations | -- | -- |
Sales and related occupations | -- | -- |
Office and administrative support occupations | -- | -- |
Farming, fishing, and forestry occupations | 10 | 20 |
Fishing and hunting workers | 10 | 20 |
Fishing and hunting workers | 10 | 20 |
Fishing and hunting workers | 10 | 20 |
Construction and extraction occupations | 5 | 10 |
Supervisors of construction and extraction workers | 1 | 2 |
First-line supervisors of construction trades and extraction workers | 1 | 2 |
First-line supervisors of construction trades and extraction workers | 1 | 2 |
Construction trades workers | 4 | 8 |
Installation, maintenance, and repair occupations | -- | -- |
Production occupations | -- | -- |
Transportation and material moving occupations | 11 | 22 |
Air transportation workers | 6 | 12 |
Aircraft pilots and flight engineers | 6 | 12 |
Airline pilots, copilots, and flight engineers | 1 | 2 |
Commercial pilots | 5 | 10 |
Motor vehicle operators | 3 | 6 |
Driver/sales workers and truck drivers | 3 | 6 |
Heavy and tractor-trailer truck drivers | 3 | 6 |
Water transportation workers | 2 | 4 |
Ship and boat captains and operators | 2 | 4 |
Captains, mates, and pilots of water vessels | 2 | 4 |
Military specific occupations (2) | 7 | 14 |
Footnotes: | ||
NOTE: Data for all years are final. Totals for major categories may include subcategories not shown separately. For complete information on how the data are coded and presented see our definitions page at https://www.bls.gov/iif/oshcfdef.htm. Dashes indicate no data reported or data that do not meet publication criteria. CFOI fatal injury counts exclude illness-related deaths unless precipitated by an injury event. | ||
| Worker characteristics | 2018 | 2019 | |
|---|---|---|---|
| Number | Number | Percent | |
Total | 32 | 51 | 100 |
Employee status | |||
Wage and salary workers (1) | 28 | 43 | 84 |
Self-employed (2) | 4 | 8 | 16 |
Gender | |||
Men | 30 | 47 | 92 |
Women | -- | 4 | 8 |
Age (3) | |||
20 to 24 years | 3 | 5 | 10 |
25 to 34 years | 4 | 13 | 25 |
35 to 44 years | 4 | 9 | 18 |
45 to 54 years | 9 | 11 | 22 |
55 to 64 years | 9 | 10 | 20 |
65 years and over | 2 | 3 | 6 |
Race or ethnic origin (4) | |||
White, non-Hispanic | 22 | 38 | 75 |
Black or African-American, non-Hispanic | -- | -- | -- |
Hispanic or Latino | -- | -- | -- |
Asian, non-Hispanic | -- | 3 | 6 |
Footnotes: | |||
NOTE: Data for all years are final. Totals for major categories may include subcategories not shown separately. For complete information on how the data are coded and presented see our definitions page at https://www.bls.gov/iif/oshcfdef.htm. Dashes indicate no data reported or data that do not meet publication criteria. CFOI fatal injury counts exclude illness-related deaths unless precipitated by an injury event. | |||
Last Modified Date: Tuesday, April 06, 2021