An official website of the United States government
An official website of the United States government
The .gov means it's official.
Federal government websites often end in .gov or .mil. Before sharing sensitive information,
make sure you're on a federal government site.
The site is secure.
The
https:// ensures that you are connecting to the official website and that any
information you provide is encrypted and transmitted securely.
25-317-SAN
Wednesday, March 05, 2025
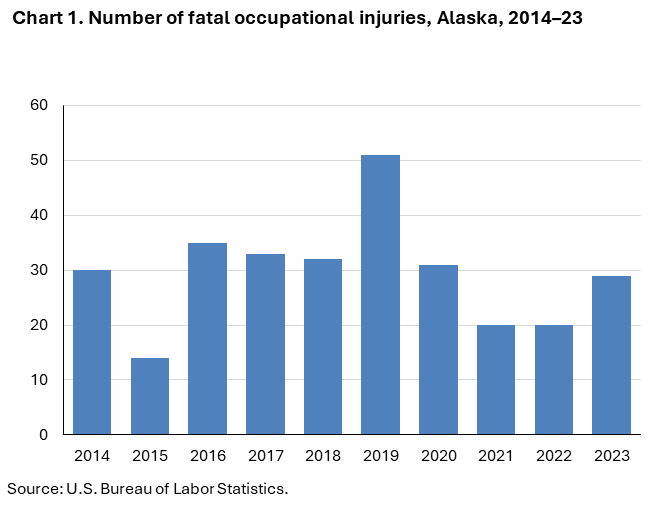
Fatal work injuries totaled 29 in 2023 for Alaska, the U.S. Bureau of Labor Statistics reported today. Regional Commissioner Chris Rosenlund noted that the number of work-related fatalities in Alaska was up from 20 the previous year. (See chart 1.) Fatal occupational injuries in the state have ranged from a high of 91 in 1992 to a low of 14 in 2015. Nationwide, a total of 5,283 fatal work injuries were recorded in 2023, a 3.7-percent decrease from 5,486 in 2022, according to the results from the Census of Fatal Occupational Injuries (CFOI).
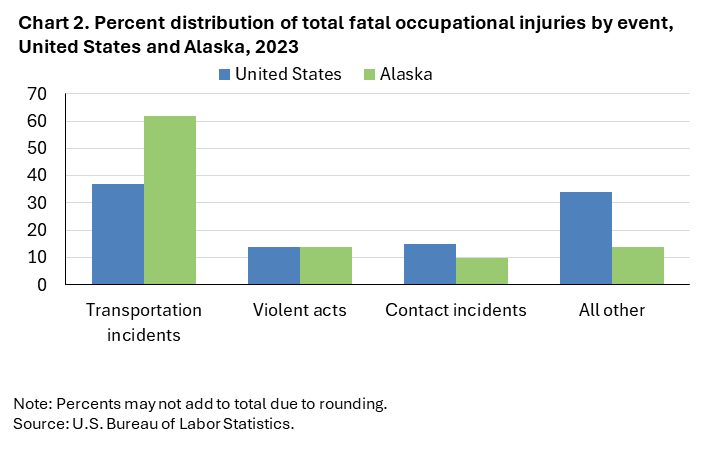
Transportation incidents (18) were the most frequent type of fatal event in Alaska, accounting for 62 percent of all fatal work injuries in the state. Nationally the share was 37 percent. (See chart 2 and table 1.)
Violent acts (4) and contact incidents (3) accounted for 14 and 10 percent of Alaska workplace fatalities, respectively; nationally the corresponding shares were 14 and 15 percent.
The transportation and warehousing sector had six fatalities. (See table 2.)
Transportation incidents resulted in 5 of the 6 transportation and warehousing sector fatalities.
The air transportation subsector accounted for four of the sector’s fatal workplace injuries.
The transportation and material moving occupational group had 10 fatal workplace injuries. (See table 3.)
Transportation incidents resulted in seven of the transportation and material moving fatalities.
Commercial pilots accounted for four of the major group’s fatal workplace injuries.
White non-Hispanics accounted for 76 percent of those who died from a workplace injury. (See chart 1 and table 4.)
Wage and salary workers accounted for 79 percent of workplace fatalities in Alaska; the self-employed comprised the remaining 21 percent. Nationally, wage and salary workers comprised 83 percent of fatalities.
Males accounted for 90 percent of the work-related fatalities in Alaska; nationally, they accounted for 91 percent of fatalities.
Workers 25-54 years old accounted for 69 percent of the state’s work-related fatalities, compared to 57 percent of on-the-job fatalities nationally. In the group of workers 25-54 years old, the subset of workers 25-34 years old accounted for 38 percent of the state’s work-related fatalities in 2023, compared to 17 percent of on-the-job fatalities nationally.
The 2022 North American Industry Classification System (NAICS) and the updated Occupational Injury and Illness Classification System (OIICS) were implemented with the release of 2023 data. As a result of these changes, comparisons between 2023 CFOI data and previous years should be made with caution. Refer to the national release technical note for more information.
Background of the program. The Census of Fatal Occupational Injuries (CFOI), part of the Bureau of Labor Statistics (BLS) Occupational Safety and Health Statistics (OSHS) program, is a count of all fatalities resulting from workplace injuries occurring in the U.S. during the calendar year. For technical information and definitions for the CFOI, see the national CFOI release Technical notes, the BLS Handbook of Methods, and the CFOI definitions.
Acknowledgments. BLS thanks the Alaska Department of Labor and Workforce Development for their efforts in collecting accurate, comprehensive, and useful data on fatal work injuries. BLS also appreciates the efforts of all federal, state, local, and private sector entities that provided source documents used to identify fatal work injuries nationally. See the national CFOI release Technical Notes for details on cooperating entities.
Information in this release will be made available to individuals with sensory impairments upon request. Voice phone: (202) 691-5200; Telecommunications Relay Service: 7-1-1.
| Event or Exposure (1) | Number | Percent (%) |
|---|---|---|
|
All events and exposures |
29 | 100 |
|
Violent acts |
4 | 14 |
|
Transportation incidents |
18 | 62 |
|
Aircraft incidents |
12 | 41 |
|
In-flight crash, collision |
8 | 28 |
|
Explosions and fires |
-- | -- |
|
Falls, slips, trips |
-- | -- |
|
Exposure to harmful substances, environments |
-- | -- |
|
Contact incidents |
3 | 10 |
|
Footnotes: |
||
|
NOTE: Data for all years are revised and final. Totals for major categories may include subcategories not shown separately. Dashes indicate no data reported or data that do not meet publication criteria. CFOI fatal injury counts exclude illness-related deaths unless precipitated by an injury event. |
||
| Industry | Number | Percent (%) |
|---|---|---|
|
Total |
29 | 100 |
|
Private industry (1) |
20 | 69 |
|
Natural resources and mining |
6 | 21 |
|
Agriculture, forestry, fishing and hunting |
3 | 10 |
|
Fishing, hunting and trapping |
3 | 10 |
|
Fishing |
3 | 10 |
|
Fishing |
3 | 10 |
|
Mining, quarrying, and oil and gas extraction |
3 | 10 |
|
Construction |
-- | -- |
|
Manufacturing |
-- | -- |
|
Trade, transportation, and utilities |
7 | 24 |
|
Retail trade |
1 | 3 |
|
General merchandise retailers |
1 | 3 |
|
Warehouse clubs, supercenters, and other general merchandise retailers |
1 | 3 |
|
Warehouse clubs, supercenters, and other general merchandise retailers |
1 | 3 |
|
Warehouse clubs and supercenters |
1 | 3 |
|
Transportation and warehousing |
6 | 21 |
|
Air transportation |
4 | 14 |
|
Nonscheduled air transportation |
4 | 14 |
|
Nonscheduled air transportation |
4 | 14 |
|
Nonscheduled chartered passenger air transportation |
4 | 14 |
|
Information |
-- | -- |
|
Financial activities |
1 | 3 |
|
Real estate and rental and leasing |
1 | 3 |
|
Real estate |
1 | 3 |
|
Activities related to real estate |
1 | 3 |
|
Real estate property managers |
1 | 3 |
|
Residential property managers |
1 | 3 |
|
Professional and business services |
-- | -- |
|
Educational and health services |
-- | -- |
|
Leisure and hospitality |
-- | -- |
|
Other services (except public administration) |
-- | -- |
|
Government (2) |
9 | 31 |
|
Federal government |
6 | 21 |
|
State government |
3 | 10 |
|
Local government |
-- | -- |
|
Footnotes: |
||
|
NOTE: Data for all years are revised and final. Totals for major categories may include subcategories not shown separately. Dashes indicate no data reported or data that do not meet publication criteria. CFOI fatal injury counts exclude illness-related deaths unless precipitated by an injury event. |
||
| Occupation (1) | Number | Percent (%) |
|---|---|---|
|
All occupations |
29 | 100 |
|
Management occupations |
-- | -- |
|
Business and financial operations occupations |
-- | -- |
|
Computer and mathematical occupations |
-- | -- |
|
Architecture and engineering occupations |
-- | -- |
|
Life, physical, and social science occupations |
-- | -- |
|
Community and social service occupations |
-- | -- |
|
Legal occupations |
-- | -- |
|
Educational instruction and library occupations |
-- | -- |
|
Arts, design, entertainment, sports, and media occupations |
-- | -- |
|
Healthcare practitioners and technical occupations |
-- | -- |
|
Healthcare support occupations |
-- | -- |
|
Protective service occupations |
-- | -- |
|
Food preparation and serving related occupations |
1 | 3 |
|
Food and beverage serving workers |
1 | 3 |
|
Building and grounds cleaning and maintenance occupations |
-- | -- |
|
Personal care and service occupations |
-- | -- |
|
Sales and related occupations |
1 | 3 |
|
Retail sales workers |
1 | 3 |
|
Retail salespersons |
1 | 3 |
|
Retail salespersons |
1 | 3 |
|
Office and administrative support occupations |
-- | -- |
|
Farming, fishing, and forestry occupations |
-- | -- |
|
Construction and extraction occupations |
-- | -- |
|
Installation, maintenance, and repair occupations |
-- | -- |
|
Production occupations |
-- | -- |
|
Transportation and material moving occupations |
10 | 34 |
|
Air transportation workers |
4 | 14 |
|
Aircraft pilots and flight engineers |
4 | 14 |
|
Commercial pilots |
4 | 14 |
|
Water transportation workers |
3 | 10 |
|
Footnotes: |
||
|
NOTE: Data for all years are revised and final. Totals for major categories may include subcategories not shown separately. Dashes indicate no data reported or data that do not meet publication criteria. CFOI fatal injury counts exclude illness-related deaths unless precipitated by an injury event. |
||
| Demographic | Number | Percent (%) |
|---|---|---|
|
Total |
29 | 100 |
|
Employee status |
||
|
Wage and salary workers (1) |
23 | 79 |
|
Self-employed (2) |
6 | 21 |
|
Sex |
||
|
Male |
26 | 90 |
|
Female |
-- | -- |
|
Age (3) |
||
|
Under 16 years |
-- | -- |
|
16 to 17 years |
-- | -- |
|
18 to 19 years |
-- | -- |
|
20 to 24 years |
-- | -- |
|
25 to 34 years |
11 | 38 |
|
35 to 44 years |
4 | 14 |
|
45 to 54 years |
5 | 17 |
|
55 to 64 years |
-- | -- |
|
65 years and over |
3 | 10 |
|
Race or ethnic origin (4) |
||
|
White, non-Hispanic |
22 | 76 |
|
Black or African-American, non-Hispanic |
-- | -- |
|
Hispanic or Latino |
-- | -- |
|
American Indian or Alaska Native, non-Hispanic |
-- | -- |
|
Asian, non-Hispanic |
-- | -- |
|
Native Hawaiian or Pacific Islander, non-Hispanic |
-- | -- |
|
Footnotes: |
||
|
NOTE: Data for all years are revised and final. Totals for major categories may include subcategories not shown separately. Dashes indicate no data reported or data that do not meet publication criteria. CFOI fatal injury counts exclude illness-related deaths unless precipitated by an injury event. |
||
Last Modified Date: Wednesday, March 05, 2025