An official website of the United States government
An official website of the United States government
The .gov means it's official.
Federal government websites often end in .gov or .mil. Before sharing sensitive information,
make sure you're on a federal government site.
The site is secure.
The
https:// ensures that you are connecting to the official website and that any
information you provide is encrypted and transmitted securely.
25-318-SAN
Wednesday, March 05, 2025
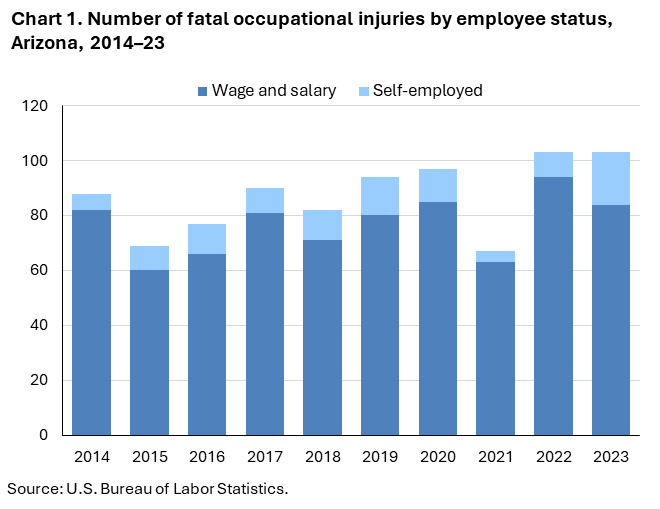
Fatal work injuries totaled 103 in 2023 for Arizona, the U.S. Bureau of Labor Statistics reported today. Regional Commissioner Chris Rosenlund noted that the number of work-related fatalities in Arizona was unchanged from the previous year. (See chart 1.) Fatal occupational injuries in the state have ranged from a high of 118 in 2000 to a low of 55 in 1993. Nationwide, a total of 5,283 fatal work injuries were recorded in 2023, a 3.7-percent decrease from 5,486 in 2022, according to the results from the Census of Fatal Occupational Injuries (CFOI).
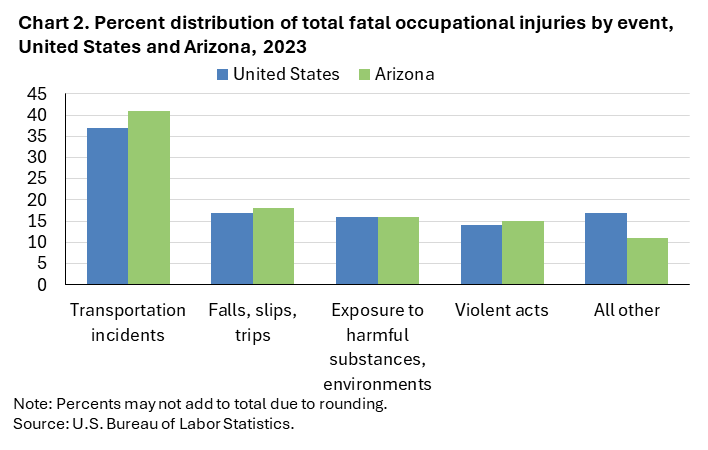
Transportation incidents (42) were the most frequent type of fatal event in Arizona, accounting for 41 percent of all fatal work injuries in the state. Nationally the share was 37 percent. (See chart 2 and table 1.)
The transportation and warehousing sector had the highest number of fatalities with 30. (See table 2.) Transportation incidents resulted in 25 of the 30 transportation and warehousing sector fatalities. The truck transportation subsector accounted for 24 of the sector’s fatal workplace injuries.
The construction sector had 26 fatalities. Falls, slips, and trips and exposure to harmful substances or environments each resulted in 9 construction sector fatalities. The specialty trade contractors subsector accounted for 16 of the sector’s workplace fatalities.
The transportation and material moving occupational group had the highest number of fatal workplace injuries with 32. (See table 3.) Transportation incidents resulted in 27 of the group’s fatalities.
The construction and extraction occupational group had 24 fatal work injuries. Construction trades workers accounted for 19 of the group’s fatal workplace injuries.
Wage and salary workers accounted for 82 percent of workplace fatalities in Arizona; the self-employed comprised the remaining 18 percent. Nationally, wage and salary workers comprised 83 percent of fatalities.
Males accounted for 94 percent of the work-related fatalities in Arizona; nationally, they accounted for 91 percent of fatalities.
Workers 25-54 years old accounted for 68 percent of the state’s work-related fatalities, compared to 57 percent of on-the-job fatalities nationally.
The 2022 North American Industry Classification System (NAICS) and the updated Occupational Injury and Illness Classification System (OIICS) were implemented with the release of 2023 data. As a result of these changes, comparisons between 2023 CFOI data and previous years should be made with caution. Refer to the national release technical note for more information.
Background of the program. The Census of Fatal Occupational Injuries (CFOI), part of the Bureau of Labor Statistics (BLS) Occupational Safety and Health Statistics (OSHS) program, is a count of all fatalities resulting from workplace injuries occurring in the U.S. during the calendar year. For technical information and definitions for the CFOI, see the national CFOI release Technical notes, the BLS Handbook of Methods, and the CFOI definitions.
Acknowledgments. BLS thanks the Industrial Commission of Arizona for their efforts in collecting accurate, comprehensive, and useful data on fatal work injuries. BLS also appreciates the efforts of all federal, state, local, and private sector entities that provided source documents used to identify fatal work injuries nationally. See the national CFOI release Technical Notes for details on cooperating entities.
Information in this release will be made available to individuals with sensory impairments upon request. Voice phone: (202) 691-5200; Telecommunications Relay Service: 7-1-1.
| Event or Exposure (1) | Number | Percent (%) |
|---|---|---|
|
All events and exposures |
103 | 100 |
|
Violent acts |
15 | 15 |
|
Homicides (violent acts by other person) |
11 | 11 |
|
Shooting by other person |
8 | 8 |
|
Stabbing, cutting, slashing by other person |
1 | 1 |
|
Hitting, kicking, beating by other person |
1 | 1 |
|
Multiple violent acts by other person |
1 | 1 |
|
Suicides (intentional self-harm) |
4 | 4 |
|
Transportation incidents |
42 | 41 |
|
Roadway incidents involving motorized land vehicle |
36 | 35 |
|
Roadway collision with other vehicle(s) |
22 | 21 |
|
Roadway collision with other vehicle(s)-moving in same direction |
10 | 10 |
|
Roadway collision with other vehicle(s)-moving in opposite directions, oncoming |
6 | 6 |
|
Roadway collision with object other than vehicle |
7 | 7 |
|
Collision with object or animal on side of roadway |
7 | 7 |
|
Roadway noncollision incident |
6 | 6 |
|
Roadway noncollision- vehicle overturn |
6 | 6 |
|
Explosions and fires |
-- | -- |
|
Falls, slips, trips |
19 | 18 |
|
Exposure to harmful substances, environments |
16 | 16 |
|
Exposure to harmful substances |
11 | 11 |
|
Drug, alcohol overdose |
11 | 11 |
|
Contact incidents |
-- | -- |
|
Footnotes: |
||
|
NOTE: Data for all years are revised and final. Totals for major categories may include subcategories not shown separately. Dashes indicate no data reported or data that do not meet publication criteria. CFOI fatal injury counts exclude illness-related deaths unless precipitated by an injury event. |
||
| Industry | Number | Percent (%) |
|---|---|---|
|
Total |
103 | 100 |
|
Private industry (1) |
97 | 94 |
|
Natural resources and mining |
4 | 4 |
|
Agriculture, forestry, fishing and hunting |
4 | 4 |
|
Construction |
26 | 25 |
|
Construction |
26 | 25 |
|
Construction of buildings |
5 | 5 |
|
Specialty trade contractors |
16 | 16 |
|
Foundation, structure, and building exterior contractors |
8 | 8 |
|
Roofing contractors |
3 | 3 |
|
Manufacturing |
5 | 5 |
|
Manufacturing |
5 | 5 |
|
Computer and electronic product manufacturing |
1 | 1 |
|
Semiconductor and other electronic component manufacturing |
1 | 1 |
|
Semiconductor and other electronic component manufacturing |
1 | 1 |
|
Semiconductor and related device manufacturing |
1 | 1 |
|
Trade, transportation, and utilities |
-- | -- |
|
Retail trade |
8 | 8 |
|
Gasoline stations and fuel dealers |
1 | 1 |
|
Gasoline stations |
1 | 1 |
|
Gasoline stations with convenience stores |
1 | 1 |
|
Transportation and warehousing |
30 | 29 |
|
Truck transportation |
24 | 23 |
|
General freight trucking |
18 | 17 |
|
General freight trucking, long-distance |
7 | 7 |
|
Specialized freight trucking |
3 | 3 |
|
Specialized freight (except used goods) trucking, long-distance |
3 | 3 |
|
Information |
-- | -- |
|
Financial activities |
3 | 3 |
|
Real estate and rental and leasing |
3 | 3 |
|
Professional and business services |
-- | -- |
|
Administrative and support and waste management and remediation services |
12 | 12 |
|
Administrative and support services |
12 | 12 |
|
Services to buildings and dwellings |
9 | 9 |
|
Educational and health services |
-- | -- |
|
Leisure and hospitality |
-- | -- |
|
Accommodation and food services |
3 | 3 |
|
Other services (except public administration) |
-- | -- |
|
Government (2) |
6 | 6 |
|
Federal government |
3 | 3 |
|
State government |
-- | -- |
|
Local government |
3 | 3 |
|
Footnotes: |
||
|
NOTE: Data for all years are revised and final. Totals for major categories may include subcategories not shown separately. Dashes indicate no data reported or data that do not meet publication criteria. CFOI fatal injury counts exclude illness-related deaths unless precipitated by an injury event. |
||
| Occupation (1) | Number | Percent (%) |
|---|---|---|
|
All occupations |
103 | 100 |
|
Management occupations |
3 | 3 |
|
Business and financial operations occupations |
-- | -- |
|
Computer and mathematical occupations |
-- | -- |
|
Architecture and engineering occupations |
-- | -- |
|
Life, physical, and social science occupations |
-- | -- |
|
Community and social service occupations |
-- | -- |
|
Legal occupations |
-- | -- |
|
Educational instruction and library occupations |
-- | -- |
|
Arts, design, entertainment, sports, and media occupations |
-- | -- |
|
Healthcare practitioners and technical occupations |
-- | -- |
|
Healthcare support occupations |
-- | -- |
|
Protective service occupations |
4 | 4 |
|
Other protective service workers |
3 | 3 |
|
Security guards and gambling surveillance officers |
3 | 3 |
|
Security guards |
3 | 3 |
|
Food preparation and serving related occupations |
3 | 3 |
|
Supervisors of food preparation and serving workers |
1 | 1 |
|
Supervisors of food preparation and serving workers |
1 | 1 |
|
First-line supervisors of food preparation and serving workers |
1 | 1 |
|
Building and grounds cleaning and maintenance occupations |
10 | 10 |
|
Personal care and service occupations |
-- | -- |
|
Sales and related occupations |
5 | 5 |
|
Office and administrative support occupations |
-- | -- |
|
Farming, fishing, and forestry occupations |
-- | -- |
|
Construction and extraction occupations |
24 | 23 |
|
Supervisors of construction and extraction workers |
4 | 4 |
|
First-line supervisors of construction trades and extraction workers |
4 | 4 |
|
First-line supervisors of construction trades and extraction workers |
4 | 4 |
|
Construction trades workers |
19 | 18 |
|
Carpenters |
3 | 3 |
|
Carpenters |
3 | 3 |
|
Construction laborers |
7 | 7 |
|
Construction laborers |
7 | 7 |
|
Roofers |
3 | 3 |
|
Roofers |
3 | 3 |
|
Installation, maintenance, and repair occupations |
7 | 7 |
|
Vehicle and mobile equipment mechanics, installers, and repairers |
3 | 3 |
|
Other installation, maintenance, and repair occupations |
4 | 4 |
|
Production occupations |
6 | 6 |
|
Transportation and material moving occupations |
32 | 31 |
|
Footnotes: |
||
|
NOTE: Data for all years are revised and final. Totals for major categories may include subcategories not shown separately. Dashes indicate no data reported or data that do not meet publication criteria. CFOI fatal injury counts exclude illness-related deaths unless precipitated by an injury event. |
||
| Demographic | Number | Percent (%) |
|---|---|---|
|
Total |
103 | 100 |
|
Employee status |
||
|
Wage and salary workers (1) |
84 | 82 |
|
Self-employed (2) |
19 | 18 |
|
Sex |
||
|
Male |
97 | 94 |
|
Female |
6 | 6 |
|
Age (3) |
||
|
Under 16 years |
-- | -- |
|
16 to 17 years |
-- | -- |
|
18 to 19 years |
-- | -- |
|
20 to 24 years |
-- | -- |
|
25 to 34 years |
23 | 22 |
|
35 to 44 years |
26 | 25 |
|
45 to 54 years |
21 | 20 |
|
55 to 64 years |
16 | 16 |
|
65 years and over |
11 | 11 |
|
Race or ethnic origin (4) |
||
|
White, non-Hispanic |
38 | 37 |
|
Black or African-American, non-Hispanic |
5 | 5 |
|
Hispanic or Latino |
48 | 47 |
|
American Indian or Alaska Native, non-Hispanic |
3 | 3 |
|
Asian, non-Hispanic |
6 | 6 |
|
Native Hawaiian or Pacific Islander, non-Hispanic |
-- | -- |
|
Footnotes: |
||
|
NOTE: Data for all years are revised and final. Totals for major categories may include subcategories not shown separately. Dashes indicate no data reported or data that do not meet publication criteria. CFOI fatal injury counts exclude illness-related deaths unless precipitated by an injury event. |
||
Last Modified Date: Wednesday, March 05, 2025