An official website of the United States government
An official website of the United States government
The .gov means it's official.
Federal government websites often end in .gov or .mil. Before sharing sensitive information,
make sure you're on a federal government site.
The site is secure.
The
https:// ensures that you are connecting to the official website and that any
information you provide is encrypted and transmitted securely.
25-309-SAN
Tuesday, March 04, 2025
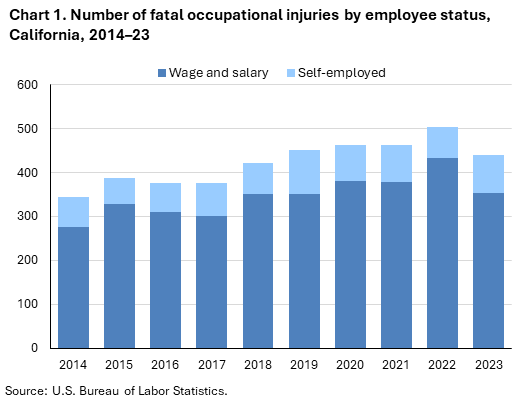
Fatal work injuries totaled 439 in 2023 for California, the U.S. Bureau of Labor Statistics reported today. Regional Commissioner Chris Rosenlund noted that the number of work-related fatalities in California was down from the previous year. (See chart 1.) Fatal occupational injuries in the state have ranged from a high of 657 in 1993 to a low of 326 in 2010. Nationwide, a total of 5,283 fatal work injuries were recorded in 2023, a 3.7-percent decrease from 5,486 in 2022, according to the results from the Census of Fatal Occupational Injuries (CFOI).
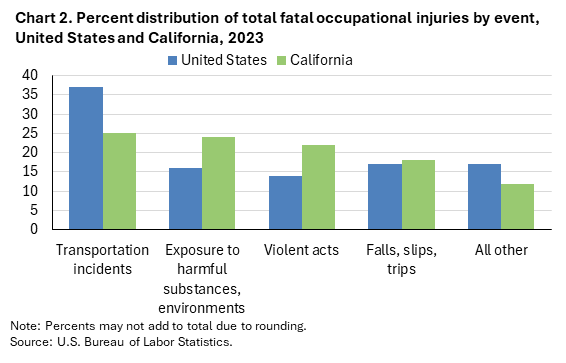
Fatal event or exposureExposure to harmful substances or environments (106) accounted for 24 percent of California workplace fatalities; nationally the share was 16 percent.
The 2022 North American Industry Classification System (NAICS) and the updated Occupational Injury and Illness Classification System (OIICS) were implemented with the release of 2023 data. As a result of these changes, comparisons between 2023 CFOI data and previous years should be made with caution. Refer to the national release technical note for more information.
Background of the program. The Census of Fatal Occupational Injuries (CFOI), part of the Bureau of Labor Statistics (BLS) Occupational Safety and Health Statistics (OSHS) program, is a count of all fatalities resulting from workplace injuries occurring in the U.S. during the calendar year. For technical information and definitions for the CFOI, see the national CFOI release Technical notes, the BLS Handbook of Methods, and the CFOI definitions.
Acknowledgments. BLS the California Department of Industrial Relations for their efforts in collecting accurate, comprehensive, and useful data on fatal work injuries. BLS also appreciates the efforts of all federal, state, local, and private sector entities that provided source documents used to identify fatal work injuries nationally. See the national CFOI release Technical Notes for details on cooperating entities.
Information in this release will be made available to individuals with sensory impairments upon request. Voice phone: (202) 691-5200; Telecommunications Relay Service: 7-1-1.
| Event or Exposure (1) | Number | Percent (%) |
|---|---|---|
|
All events and exposures |
439 | 100 |
|
Violent acts |
95 | 22 |
|
Homicides (violent acts by other person) |
53 | 12 |
|
Shooting by other person |
44 | 10 |
|
Stabbing, cutting, slashing by other person |
2 | 0 |
|
Hitting, kicking, beating by other person |
4 | 1 |
|
Suicides (intentional self-harm) |
42 | 10 |
|
Intentional self-harm-- shooting |
12 | 3 |
|
Intentional self-harm-- hanging, strangulation, asphyxiation |
24 | 5 |
|
Intentional self-harm-- jump from building, structure |
3 | 1 |
|
Transportation incidents |
108 | 25 |
|
Aircraft incidents |
10 | 2 |
|
In-flight crash, collision |
10 | 2 |
|
In-flight crash due to mechanical failure |
5 | 1 |
|
Non-motorized transport incidents |
3 | 1 |
|
Pedestrian incidents involving motorized land vehicles |
25 | 6 |
|
Pedestrian struck by vehicle in roadway |
14 | 3 |
|
Roadway incidents involving motorized land vehicle |
48 | 11 |
|
Roadway collision with other vehicle(s) |
26 | 6 |
|
Roadway collision with other vehicle(s)-intersecting, turning |
8 | 2 |
|
Roadway collision with other vehicle(s)-moving in same direction |
4 | 1 |
|
Roadway collision with other vehicle(s)-moving in opposite directions, oncoming |
6 | 1 |
|
Roadway collision with other vehicle(s)-moving and standing vehicle |
7 | 2 |
|
Roadway collision with object other than vehicle |
12 | 3 |
|
Collision with object or animal on side of roadway |
10 | 2 |
|
Roadway noncollision incident |
10 | 2 |
|
Roadway noncollision- vehicle overturn |
7 | 2 |
|
Nonroadway incidents involving motorized land vehicles |
20 | 5 |
|
Nonroadway collision with other vehicle(s) |
3 | 1 |
|
Nonroadway collision with object other than vehicle |
5 | 1 |
|
Collision with stationary object, nonroadway |
4 | 1 |
|
Nonroadway noncollision incident |
11 | 3 |
|
Nonroadway noncollision- vehicle overturn |
6 | 1 |
|
Explosions and fires |
-- | -- |
|
Falls, slips, trips |
79 | 18 |
|
Fall to lower level |
65 | 15 |
|
Fall to lower level from collapsing structure or equipment |
12 | 3 |
|
Fall to lower level from collapsing structure or equipment- 6 to 30 feet |
8 | 2 |
|
Fall to lower level resulting from exposure or contact |
4 | 1 |
|
Fall to lower level resulting in exposure or contact |
5 | 1 |
|
Fall to lower level resulting in exposure or contact- less than 6 feet |
5 | 1 |
|
Other fall to lower level |
43 | 10 |
|
Other fall to lower level- less than 6 feet |
4 | 1 |
|
Other fall to lower level- 6 to 30 feet |
32 | 7 |
|
Other fall to lower level- more than 30 feet |
4 | 1 |
|
Slip, trip, stumble or fall on same level |
14 | 3 |
|
Exposure to harmful substances, environments |
106 | 24 |
|
Exposure to electricity |
11 | 3 |
|
Direct exposure to electricity |
6 | 1 |
|
Direct exposure to electricity- greater than 220 volts |
3 | 1 |
|
Indirect exposure to electricity |
3 | 1 |
|
Exposure to harmful substances |
91 | 21 |
|
Drug, alcohol overdose |
87 | 20 |
|
Inhalation of harmful substance |
4 | 1 |
|
Inhalation of harmful substance- single episode or single shift |
4 | 1 |
|
Contact incidents |
49 | 11 |
|
Contact with animals |
3 | 1 |
|
Bitten or stung by animal |
3 | 1 |
|
Collapse, engulfment |
9 | 2 |
|
Collapse, engulfment- open trench or excavation |
3 | 1 |
|
Struck by propelled, falling, or suspended object |
16 | 4 |
|
Struck, caught, or compressed by running powered equipment |
18 | 4 |
|
Compressed between running equipment and other object(s) |
4 | 1 |
|
Struck by rolling powered vehicle or machinery |
9 | 2 |
|
Contact with non-running objects or equipment |
3 | 1 |
|
Footnotes: |
||
|
NOTE: Data for all years are revised and final. Totals for major categories may include subcategories not shown separately. Dashes indicate no data reported or data that do not meet publication criteria. CFOI fatal injury counts exclude illness-related deaths unless precipitated by an injury event. |
||
| Industry | Number | Percent (%) |
|---|---|---|
|
Total |
439 | 100 |
|
Private industry (1) |
405 | 92 |
|
Natural resources and mining |
-- | -- |
|
Agriculture, forestry, fishing and hunting |
45 | 10 |
|
Crop production |
24 | 5 |
|
Fruit and tree nut farming |
11 | 3 |
|
Greenhouse, nursery, and floriculture production |
9 | 2 |
|
Other crop farming |
1 | 0 |
|
Hay farming |
1 | 0 |
|
Animal production and aquaculture |
4 | 1 |
|
Support activities for agriculture and forestry |
15 | 3 |
|
Support activities for crop production |
15 | 3 |
|
Support activities for crop production |
15 | 3 |
|
Farm labor contractors and crew leaders |
10 | 2 |
|
Construction |
78 | 18 |
|
Construction |
78 | 18 |
|
Construction of buildings |
18 | 4 |
|
Residential building construction |
13 | 3 |
|
Residential building construction |
13 | 3 |
|
Residential remodelers |
10 | 2 |
|
Nonresidential building construction |
5 | 1 |
|
Commercial and institutional building construction |
5 | 1 |
|
Heavy and civil engineering construction |
7 | 2 |
|
Utility system construction |
4 | 1 |
|
Specialty trade contractors |
52 | 12 |
|
Foundation, structure, and building exterior contractors |
17 | 4 |
|
Roofing contractors |
14 | 3 |
|
Building equipment contractors |
19 | 4 |
|
Plumbing, heating, and air-conditioning contractors |
9 | 2 |
|
Building finishing contractors |
7 | 2 |
|
Other specialty trade contractors |
9 | 2 |
|
Site preparation contractors |
6 | 1 |
|
Residential site preparation contractors |
1 | 0 |
|
All other specialty trade contractors |
3 | 1 |
|
Manufacturing |
21 | 5 |
|
Manufacturing |
21 | 5 |
|
Food manufacturing |
5 | 1 |
|
Other food manufacturing |
1 | 0 |
|
Seasoning and dressing manufacturing |
1 | 0 |
|
Spice and extract manufacturing |
1 | 0 |
|
Fabricated metal product manufacturing |
3 | 1 |
|
Transportation equipment manufacturing |
4 | 1 |
|
Trade, transportation, and utilities |
-- | -- |
|
Wholesale trade |
16 | 4 |
|
Merchant wholesalers, durable goods |
9 | 2 |
|
Household appliances and electrical and electronic goods merchant wholesalers |
4 | 1 |
|
Merchant wholesalers, nondurable goods |
7 | 2 |
|
Miscellaneous nondurable goods merchant wholesalers |
3 | 1 |
|
Retail trade |
34 | 8 |
|
Motor vehicle and parts dealers |
3 | 1 |
|
Building material and garden equipment and supplies dealers |
3 | 1 |
|
Building material and supplies dealers |
3 | 1 |
|
Food and beverage retailers |
13 | 3 |
|
Grocery and convenience retailers |
9 | 2 |
|
Supermarkets and other grocery retailers (except convenience retailers) |
5 | 1 |
|
Convenience retailers and vending machine operators |
4 | 1 |
|
Convenience retailers |
4 | 1 |
|
General merchandise retailers |
3 | 1 |
|
Gasoline stations and fuel dealers |
4 | 1 |
|
Gasoline stations |
4 | 1 |
|
Gasoline stations with convenience stores |
4 | 1 |
|
Sporting goods, hobby, musical instrument, book, and miscellaneous retailers |
5 | 1 |
|
Other miscellaneous retailers |
3 | 1 |
|
All other miscellaneous retailers |
3 | 1 |
|
Tobacco, electronic cigarette, and other smoking supplies retailers |
3 | 1 |
|
Transportation and warehousing |
66 | 15 |
|
Air transportation |
5 | 1 |
|
Truck transportation |
31 | 7 |
|
General freight trucking |
24 | 5 |
|
General freight trucking, local |
11 | 3 |
|
General freight trucking, long-distance |
11 | 3 |
|
General freight trucking, long-distance, truckload |
6 | 1 |
|
Specialized freight trucking |
5 | 1 |
|
Transit and ground passenger transportation |
9 | 2 |
|
Taxi and limousine service |
6 | 1 |
|
Taxi and ridesharing services |
6 | 1 |
|
Support activities for transportation |
10 | 2 |
|
Support activities for road transportation |
7 | 2 |
|
Motor vehicle towing |
7 | 2 |
|
Couriers and messengers |
4 | 1 |
|
Warehousing and storage |
4 | 1 |
|
Warehousing and storage |
4 | 1 |
|
Information |
-- | -- |
|
Financial activities |
13 | 3 |
|
Real estate and rental and leasing |
13 | 3 |
|
Real estate |
6 | 1 |
|
Activities related to real estate |
3 | 1 |
|
Rental and leasing services |
7 | 2 |
|
Commercial and industrial machinery and equipment rental and leasing |
4 | 1 |
|
Professional and business services |
64 | 15 |
|
Professional, scientific, and technical services |
6 | 1 |
|
Professional, scientific, and technical services |
6 | 1 |
|
Administrative and support and waste management and remediation services |
58 | 13 |
|
Administrative and support services |
54 | 12 |
|
Employment services |
6 | 1 |
|
Business support services |
1 | 0 |
|
Other business support services |
1 | 0 |
|
Investigation and security services |
11 | 3 |
|
Services to buildings and dwellings |
36 | 8 |
|
Landscaping services |
30 | 7 |
|
Waste management and remediation services |
4 | 1 |
|
Educational and health services |
15 | 3 |
|
Educational services |
4 | 1 |
|
Educational services |
4 | 1 |
|
Health care and social assistance |
11 | 3 |
|
Nursing and residential care facilities |
4 | 1 |
|
Social assistance |
3 | 1 |
|
Leisure and hospitality |
28 | 6 |
|
Arts, entertainment, and recreation |
10 | 2 |
|
Performing arts, spectator sports, and related industries |
4 | 1 |
|
Amusement, gambling, and recreation industries |
6 | 1 |
|
Accommodation and food services |
18 | 4 |
|
Other services (except public administration) |
20 | 5 |
|
Other services (except public administration) |
20 | 5 |
|
Repair and maintenance |
14 | 3 |
|
Government (2) |
34 | 8 |
|
Federal government |
12 | 3 |
|
State government |
5 | 1 |
|
Local government |
17 | 4 |
|
Footnotes: |
||
|
NOTE: Data for all years are revised and final. Totals for major categories may include subcategories not shown separately. Dashes indicate no data reported or data that do not meet publication criteria. CFOI fatal injury counts exclude illness-related deaths unless precipitated by an injury event. |
||
| Occupation (1) | Number | Percent (%) |
|---|---|---|
|
All occupations |
439 | 100 |
|
Management occupations |
13 | 3 |
|
Other management occupations |
10 | 2 |
|
Farmers, ranchers, and other agricultural managers |
6 | 1 |
|
Farmers, ranchers, and other agricultural managers |
6 | 1 |
|
Lodging managers |
1 | 0 |
|
Lodging managers |
1 | 0 |
|
Business and financial operations occupations |
-- | -- |
|
Computer and mathematical occupations |
-- | -- |
|
Architecture and engineering occupations |
-- | -- |
|
Life, physical, and social science occupations |
-- | -- |
|
Community and social service occupations |
-- | -- |
|
Legal occupations |
-- | -- |
|
Educational instruction and library occupations |
-- | -- |
|
Arts, design, entertainment, sports, and media occupations |
4 | 1 |
|
Healthcare practitioners and technical occupations |
-- | -- |
|
Healthcare support occupations |
7 | 2 |
|
Home health and personal care aides; and nursing assistants, orderlies, and psychiatric aides |
6 | 1 |
|
Other healthcare support occupations |
1 | 0 |
|
Massage therapists |
1 | 0 |
|
Massage therapists |
1 | 0 |
|
Protective service occupations |
30 | 7 |
|
Other protective service workers |
20 | 5 |
|
Security guards and gambling surveillance officers |
20 | 5 |
|
Security guards |
20 | 5 |
|
Food preparation and serving related occupations |
13 | 3 |
|
Supervisors of food preparation and serving workers |
6 | 1 |
|
Supervisors of food preparation and serving workers |
6 | 1 |
|
First-line supervisors of food preparation and serving workers |
6 | 1 |
|
Building and grounds cleaning and maintenance occupations |
40 | 9 |
|
Supervisors of building and grounds cleaning and maintenance workers |
6 | 1 |
|
First-line supervisors of building and grounds cleaning and maintenance workers |
6 | 1 |
|
Building cleaning and pest control workers |
7 | 2 |
|
Grounds maintenance workers |
27 | 6 |
|
Grounds maintenance workers |
27 | 6 |
|
Landscaping and groundskeeping workers |
14 | 3 |
|
Tree trimmers and pruners |
11 | 3 |
|
Personal care and service occupations |
5 | 1 |
|
Supervisors of personal care and service workers |
1 | 0 |
|
First-line supervisors of personal service workers |
1 | 0 |
|
First-line supervisors of personal service workers |
1 | 0 |
|
Sales and related occupations |
26 | 6 |
|
Retail sales workers |
14 | 3 |
|
Cashiers |
11 | 3 |
|
Cashiers |
11 | 3 |
|
Retail salespersons |
3 | 1 |
|
Retail salespersons |
3 | 1 |
|
Other sales and related workers |
6 | 1 |
|
Office and administrative support occupations |
11 | 3 |
|
Information and record clerks |
4 | 1 |
|
Farming, fishing, and forestry occupations |
36 | 8 |
|
Agricultural workers |
31 | 7 |
|
Miscellaneous agricultural workers |
31 | 7 |
|
Agricultural equipment operators |
7 | 2 |
|
Farmworkers and laborers, crop, nursery, and greenhouse |
20 | 5 |
|
Farmworkers, farm, ranch, and aquacultural animals |
3 | 1 |
|
Construction and extraction occupations |
77 | 18 |
|
Supervisors of construction and extraction workers |
12 | 3 |
|
First-line supervisors of construction trades and extraction workers |
12 | 3 |
|
First-line supervisors of construction trades and extraction workers |
12 | 3 |
|
Construction trades workers |
61 | 14 |
|
Carpenters |
6 | 1 |
|
Carpenters |
6 | 1 |
|
Construction laborers |
24 | 5 |
|
Construction laborers |
24 | 5 |
|
Construction equipment operators |
3 | 1 |
|
Operating engineers and other construction equipment operators |
3 | 1 |
|
Electricians |
8 | 2 |
|
Electricians |
8 | 2 |
|
Pipelayers, plumbers, pipefitters, and steamfitters |
4 | 1 |
|
Roofers |
10 | 2 |
|
Roofers |
10 | 2 |
|
Installation, maintenance, and repair occupations |
39 | 9 |
|
Supervisors of installation, maintenance, and repair workers |
16 | 4 |
|
First-line supervisors of mechanics, installers, and repairers |
16 | 4 |
|
First-line supervisors of mechanics, installers, and repairers |
16 | 4 |
|
Other installation, maintenance, and repair occupations |
16 | 4 |
|
Maintenance and repair workers, general |
6 | 1 |
|
Maintenance and repair workers, general |
6 | 1 |
|
Miscellaneous installation, maintenance, and repair workers |
4 | 1 |
|
Production occupations |
11 | 3 |
|
Food processing workers |
3 | 1 |
|
Metal workers and plastic workers |
4 | 1 |
|
Transportation and material moving occupations |
105 | 24 |
|
Supervisors of transportation and material moving workers |
7 | 2 |
|
First-line supervisors of transportation and material moving workers |
7 | 2 |
|
First-line supervisors of material-moving machine and vehicle operators |
4 | 1 |
|
Air transportation workers |
7 | 2 |
|
Aircraft pilots and flight engineers |
7 | 2 |
|
Motor vehicle operators |
63 | 14 |
|
Driver/sales workers and truck drivers |
52 | 12 |
|
Heavy and tractor-trailer truck drivers |
40 | 9 |
|
Material moving workers |
24 | 5 |
|
Laborers and material movers |
19 | 4 |
|
Cleaners of vehicles and equipment |
3 | 1 |
|
Laborers and freight, stock, and material movers, hand |
13 | 3 |
|
Stockers and order fillers |
3 | 1 |
|
Footnotes: |
||
|
NOTE: Data for all years are revised and final. Totals for major categories may include subcategories not shown separately. Dashes indicate no data reported or data that do not meet publication criteria. CFOI fatal injury counts exclude illness-related deaths unless precipitated by an injury event. |
||
| Demographic | Number | Percent (%) |
|---|---|---|
|
Total |
439 | 100 |
|
Employee status |
||
|
Wage and salary workers (1) |
354 | 81 |
|
Self-employed (2) |
85 | 19 |
|
Sex |
||
|
Male |
402 | 92 |
|
Female |
37 | 8 |
|
Age (3) |
||
|
Under 16 years |
-- | -- |
|
16 to 17 years |
-- | -- |
|
18 to 19 years |
-- | -- |
|
20 to 24 years |
32 | 7 |
|
25 to 34 years |
85 | 19 |
|
35 to 44 years |
90 | 21 |
|
45 to 54 years |
95 | 22 |
|
55 to 64 years |
82 | 19 |
|
65 years and over |
52 | 12 |
|
Race or ethnic origin (4) |
||
|
White, non-Hispanic |
146 | 33 |
|
Black or African-American, non-Hispanic |
28 | 6 |
|
Hispanic or Latino |
210 | 48 |
|
American Indian or Alaska Native, non-Hispanic |
-- | -- |
|
Asian, non-Hispanic |
52 | 12 |
|
Native Hawaiian or Pacific Islander, non-Hispanic |
-- | -- |
|
Footnotes: |
||
|
NOTE: Data for all years are revised and final. Totals for major categories may include subcategories not shown separately. Dashes indicate no data reported or data that do not meet publication criteria. CFOI fatal injury counts exclude illness-related deaths unless precipitated by an injury event. |
||
Last Modified Date: Tuesday, March 04, 2025