An official website of the United States government
An official website of the United States government
The .gov means it's official.
Federal government websites often end in .gov or .mil. Before sharing sensitive information,
make sure you're on a federal government site.
The site is secure.
The
https:// ensures that you are connecting to the official website and that any
information you provide is encrypted and transmitted securely.
26-582-SAN
Wednesday, April 01, 2026
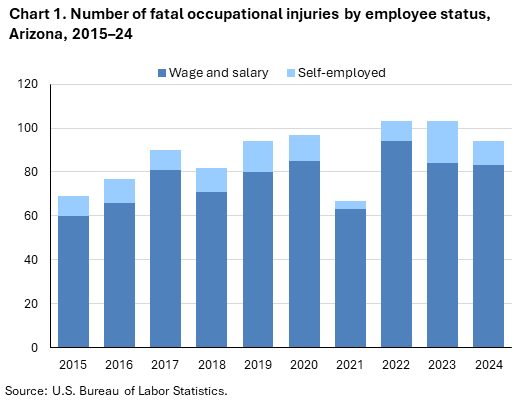
Fatal work injuries totaled 94 in 2024 for Arizona, the U.S. Bureau of Labor Statistics reported today. Regional Commissioner Chris Rosenlund noted that the number of work-related fatalities in Arizona was down 8.7 percent from 103 in 2023. (See chart 1.) The fatal work injury rate was 2.8 fatalities per 100,000 full-time equivalent (FTE) workers in 2024, a decrease from a rate of 3.1 in 2023. Nationwide, a total of 5,070 fatal work injuries were recorded in 2024, a 4.0-percent decrease from 5,283 in 2023. These data are from the Census of Fatal Occupational Injuries (CFOI).
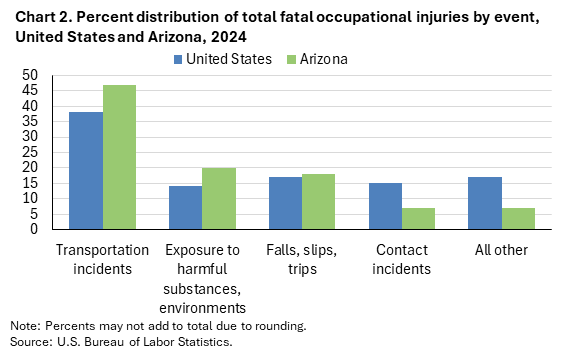
Fatal event or exposureTransportation incidents (44) were the most frequent type of fatal event in Arizona, accounting for 47 percent of all fatal work injuries in the state. Nationally the share was 38 percent. Worker deaths from transportation incidents were up from 42 over the year. (See chart 2 and table 1.)
Exposure to harmful substances or environment (19) accounted for 20 percent of Arizona worker fatalities; nationally the share was 14 percent.
The transportation and warehousing sector had the highest number of fatalities with 28, down from 30 the previous year. (See table 2.)
Transportation incidents resulted in 25 of the 28 transportation and warehousing sector fatalities.
The general freight trucking industry group accounted for 19 of the sector’s fatal workplace injuries.
Fatal work injuries declined by four over the year in the construction and extraction occupational group. (See table 3.)
The transportation and material moving occupational group had the highest number of fatal workplace injuries with 33. Transportation incidents resulted in 29 fatalities among these workers. Motor vehicle operators accounted for 30 of the major group’s 33 fatal workplace injuries.
Wage and salary workers accounted for 88 percent of fatal workplace injuries in Arizona; the self-employed comprised the remaining 12 percent. (See chart 1 and table 4.) Nationally, wage and salary workers comprised 82 percent of fatalities.
Fatal workplace injuries among male workers decreased from 97 to 88 in 2024.
Fatalities among Hispanic or Latino workers declined by 16 from 48 the previous year.
Workers 25-54 years old accounted for 64 percent of the state’s work-related fatalities, compared to 55 percent of on-the-job fatalities nationally. Workers aged 55 years and older accounted for 24 percent of the state’s work-related fatalities in 2024, compared to 37 percent of on-the-job fatalities nationally.
Background of the program. The Census of Fatal Occupational Injuries (CFOI), part of the Bureau of Labor Statistics (BLS) Occupational Safety and Health Statistics (OSHS) program, is a count of all fatalities resulting from workplace injuries occurring in the U.S. during the calendar year. For technical information and definitions for the CFOI, see the national CFOI release Technical notes, the BLS Handbook of Methods, and the CFOI definitions.
Acknowledgments. BLS thanks the Industrial Commission of Arizona for their efforts in collecting accurate, comprehensive, and useful data on fatal work injuries. BLS also appreciates the efforts of all federal, state, local, and private sector entities that provided source documents used to identify fatal work injuries nationally. See the national CFOI release Technical Notes for details on cooperating entities.
Information in this release will be made available to individuals with sensory impairments upon request. Voice phone: (202) 691-5200; Telecommunications Relay Service: 7-1-1.
| Event or Exposure (1) | 2023 | 2024 | |
|---|---|---|---|
| Number | Number | Percent (%) | |
All events and exposures | 103 | 94 | 100 |
Transportation incidents | 42 | 44 | 47 |
Pedestrian incidents involving motorized land vehicles | -- | 4 | 4 |
Roadway incidents involving motorized land vehicle | 36 | 36 | 38 |
Roadway collision with other vehicle(s) | 22 | 22 | 23 |
Roadway collision with other vehicle(s)-moving in same direction | 10 | 6 | 6 |
Roadway collision with other vehicle(s)-moving in opposite directions, oncoming | 6 | 7 | 7 |
Roadway collision with other vehicle(s)-moving and standing vehicle | -- | 6 | 6 |
Roadway collision with object other than vehicle | 7 | 7 | 7 |
Collision with moving object or animal in roadway | -- | 1 | 1 |
Collision with object or animal on side of roadway | 7 | 6 | 6 |
Roadway noncollision incident | 6 | 7 | 7 |
Roadway noncollision- vehicle overturn | 6 | 7 | 7 |
Falls, slips, trips | 19 | 17 | 18 |
Fall to lower level | -- | 13 | 14 |
Slip, trip, stumble or fall on same level | -- | 4 | 4 |
Fall on same level | -- | 4 | 4 |
Fall on same level resulting in exposure or contact | -- | 3 | 3 |
Exposure to harmful substances, environments | 16 | 19 | 20 |
Exposure to harmful substances | 11 | 11 | 12 |
Drug, alcohol overdose | 11 | 9 | 10 |
Contact incidents | -- | 7 | 7 |
Footnotes: | |||
Note: The Census of Fatal Occupational Injuries (CFOI) has published data on fatal occupational injuries for the United States since 1992. During this time, the classification systems and definitions of many data elements have changed. See the CFOI Definitions page (www.bls.gov/iif/definitions/census-of-fatal-occupational-injuries-definitions.htm) for a more detailed description of each data element. Data for all years are revised and final. Totals for major categories may include subcategories not shown separately. Dashes indicate no data reported or data that do not meet publication criteria. CFOI fatal injury counts exclude illness-related deaths unless precipitated by an injury event. | |||
| Industry | 2023 | 2024 | |
|---|---|---|---|
| Number | Number | Percent (%) | |
Total | 103 | 94 | 100 |
Private industry (1) | 97 | 88 | 94 |
Natural resources and mining | 4 | -- | -- |
Construction | 26 | 24 | 26 |
Construction | 26 | 24 | 26 |
Construction of buildings | 5 | 4 | 4 |
Residential building construction | -- | 3 | 3 |
Residential building construction | -- | 3 | 3 |
Specialty trade contractors | 16 | 17 | 18 |
Foundation, structure, and building exterior contractors | 8 | 8 | 9 |
Framing contractors | -- | 3 | 3 |
Building equipment contractors | -- | 8 | 9 |
Electrical contractors and other wiring installation contractors | -- | 4 | 4 |
Plumbing, heating, and air-conditioning contractors | -- | 4 | 4 |
Building finishing contractors | -- | 1 | 1 |
Finish carpentry contractors | -- | 1 | 1 |
Manufacturing | 5 | 4 | 4 |
Manufacturing | 5 | 4 | 4 |
Trade, transportation, and utilities | -- | 32 | 34 |
Retail trade | 8 | 4 | 4 |
Transportation and warehousing | 30 | 28 | 30 |
Truck transportation | 24 | 20 | 21 |
General freight trucking | 18 | 19 | 20 |
General freight trucking, long-distance | 7 | 14 | 15 |
Specialized freight trucking | 3 | 1 | 1 |
Information | -- | -- | -- |
Financial activities | 3 | -- | -- |
Professional and business services | -- | -- | -- |
Administrative and support and waste management and remediation services | 12 | 8 | 9 |
Educational and health services | -- | 1 | 1 |
Educational services | -- | 1 | 1 |
Educational services | -- | 1 | 1 |
Technical and trade schools | -- | 1 | 1 |
Technical and trade schools | -- | 1 | 1 |
Flight training | -- | 1 | 1 |
Leisure and hospitality | -- | -- | -- |
Accommodation and food services | 3 | 6 | 6 |
Food services and drinking places | -- | 6 | 6 |
Special food services | -- | 3 | 3 |
Mobile food services | -- | 1 | 1 |
Restaurants and other eating places | -- | 3 | 3 |
Restaurants and other eating places | -- | 3 | 3 |
Other services (except public administration) | -- | 4 | 4 |
Other services (except public administration) | -- | 4 | 4 |
Government (2) | 6 | 6 | 6 |
Federal government | 3 | -- | -- |
State government | -- | -- | -- |
Local government | 3 | 5 | 5 |
Footnotes: | |||
Note: The Census of Fatal Occupational Injuries (CFOI) has published data on fatal occupational injuries for the United States since 1992. During this time, the classification systems and definitions of many data elements have changed. See the CFOI Definitions page (www.bls.gov/iif/definitions/census-of-fatal-occupational-injuries-definitions.htm) for a more detailed description of each data element. Data for all years are revised and final. Totals for major categories may include subcategories not shown separately. Dashes indicate no data reported or data that do not meet publication criteria. CFOI fatal injury counts exclude illness-related deaths unless precipitated by an injury event. | |||
| Occupation (1) | 2023 | 2024 | |
|---|---|---|---|
| Number | Number | Percent (%) | |
All occupations | 103 | 94 | 100 |
Food preparation and serving related occupations | 3 | 5 | 5 |
Food and beverage serving workers | -- | 1 | 1 |
Fast food and counter workers | -- | 1 | 1 |
Fast food and counter workers | -- | 1 | 1 |
Building and grounds cleaning and maintenance occupations | 10 | 7 | 7 |
Personal care and service occupations | -- | 4 | 4 |
Sales and related occupations | 5 | 4 | 4 |
Construction and extraction occupations | 24 | 20 | 21 |
Supervisors of construction and extraction workers | 4 | 3 | 3 |
First-line supervisors of construction trades and extraction workers | 4 | 3 | 3 |
First-line supervisors of construction trades and extraction workers | 4 | 3 | 3 |
Construction trades workers | 19 | 17 | 18 |
Carpenters | 3 | 3 | 3 |
Carpenters | 3 | 3 | 3 |
Construction laborers | 7 | 5 | 5 |
Construction laborers | 7 | 5 | 5 |
Electricians | -- | 3 | 3 |
Electricians | -- | 3 | 3 |
Installation, maintenance, and repair occupations | 7 | 6 | 6 |
Supervisors of installation, maintenance, and repair workers | -- | 3 | 3 |
First-line supervisors of mechanics, installers, and repairers | -- | 3 | 3 |
First-line supervisors of mechanics, installers, and repairers | -- | 3 | 3 |
Other installation, maintenance, and repair occupations | 4 | 3 | 3 |
Production occupations | 6 | 5 | 5 |
Transportation and material moving occupations | 32 | 33 | 35 |
Motor vehicle operators | -- | 30 | 32 |
Footnotes: | |||
Note: The Census of Fatal Occupational Injuries (CFOI) has published data on fatal occupational injuries for the United States since 1992. During this time, the classification systems and definitions of many data elements have changed. See the CFOI Definitions page (www.bls.gov/iif/definitions/census-of-fatal-occupational-injuries-definitions.htm) for a more detailed description of each data element. Data for all years are revised and final. Totals for major categories may include subcategories not shown separately. Dashes indicate no data reported or data that do not meet publication criteria. CFOI fatal injury counts exclude illness-related deaths unless precipitated by an injury event. | |||
| Demographic | 2023 | 2024 | |
|---|---|---|---|
| Number | Number | Percent (%) | |
Total | 103 | 94 | 100 |
Employee status | |||
Wage and salary workers (1) | 84 | 83 | 88 |
Self-employed (2) | 19 | 11 | 12 |
Sex | |||
Male | 97 | 88 | 94 |
Female | 6 | 6 | 6 |
Age (3) | |||
Under 16 years | -- | -- | -- |
16 to 17 years | -- | -- | -- |
18 to 19 years | -- | -- | -- |
20 to 24 years | -- | 8 | 9 |
25 to 34 years | 23 | 19 | 20 |
35 to 44 years | 26 | 18 | 19 |
45 to 54 years | 21 | 23 | 24 |
55 to 64 years | 16 | 15 | 16 |
65 years and over | 11 | 8 | 9 |
Race or ethnic origin (4) | |||
White, non-Hispanic | 38 | 43 | 46 |
Black or African-American, non-Hispanic | 5 | 9 | 10 |
Hispanic or Latino | 48 | 32 | 34 |
American Indian or Alaska Native, non-Hispanic | 3 | -- | -- |
Asian, non-Hispanic | 6 | -- | -- |
Native Hawaiian or Pacific Islander, non-Hispanic | -- | -- | -- |
Person of multiple races, non-Hispanic | -- | -- | -- |
Other or not reported, non-Hispanic | -- | 5 | 5 |
Footnotes: | |||
Note: The Census of Fatal Occupational Injuries (CFOI) has published data on fatal occupational injuries for the United States since 1992. During this time, the classification systems and definitions of many data elements have changed. See the CFOI Definitions page (www.bls.gov/iif/definitions/census-of-fatal-occupational-injuries-definitions.htm) for a more detailed description of each data element. Data for all years are revised and final. Totals for major categories may include subcategories not shown separately. Dashes indicate no data reported or data that do not meet publication criteria. CFOI fatal injury counts exclude illness-related deaths unless precipitated by an injury event. | |||
Last Modified Date: Wednesday, April 01, 2026