An official website of the United States government
An official website of the United States government
The .gov means it's official.
Federal government websites often end in .gov or .mil. Before sharing sensitive information,
make sure you're on a federal government site.
The site is secure.
The
https:// ensures that you are connecting to the official website and that any
information you provide is encrypted and transmitted securely.
26-583-SAN
Wednesday, April 01, 2026
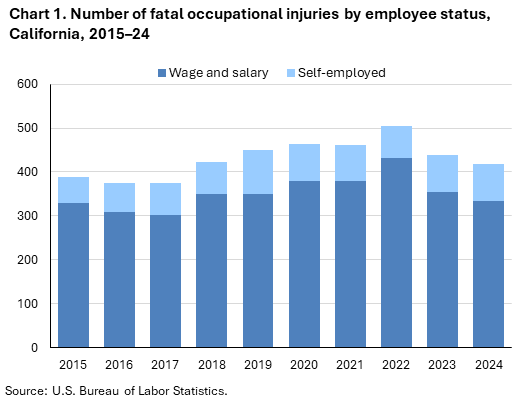
Fatal work injuries totaled 419 in 2024 for California, the U.S. Bureau of Labor Statistics reported today. Regional Commissioner Chris Rosenlund noted that the number of work-related fatalities in California was down 4.6 percent from 439 in 2023. (See chart 1.) The fatal work injury rate was 2.4 fatalities per 100,000 full-time equivalent (FTE) workers in 2024, a decrease from a rate of 2.5 in 2023. Nationwide, a total of 5,070 fatal work injuries were recorded in 2024, a 4.0-percent decrease from 5,283 in 2023. These data are from the Census of Fatal Occupational Injuries (CFOI).
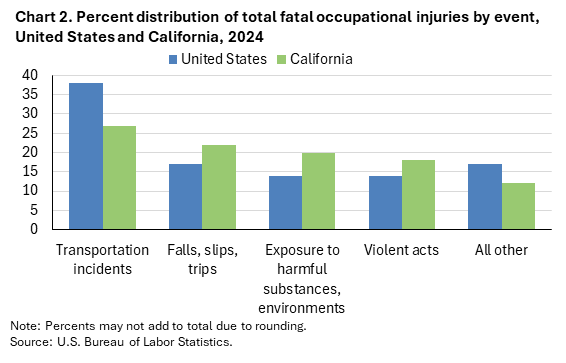
Fatal event or exposureTransportation incidents (114) were the most frequent type of fatal event in California, accounting for 27 percent of all fatal work injuries in the state. Nationally the share was 38 percent. Worker deaths from transportation incidents were up from 108 over the year. (See chart 2 and table 1.)
Exposure to harmful substances or environments resulted in 83 fatalities in 2024, down 22 percent from 106 in 2023.
The construction sector had the highest number of fatalities with 81, up from 78 the previous year. Fatal falls, slips, or trips resulted in 43 of the 81 sector fatalities. The specialty trade contractors subsector accounted for 44 of the sector’s fatal workplace injuries. (See table 2.)
Fatalities in the agriculture, forestry, fishing and hunting sector declined by 14 over the year. Transportation incidents resulted in 16 of the 31 fatalities in this sector. Within the sector, 10 fatalities occurred in the fruit and tree nut farming industry group.
Farming, fishing, and forestry workers experienced the largest decrease (-12) in fatal work injuries over the year among the major occupational groups. Transportation incidents resulted in 10 of the 24 fatalities in this group. Crop, nursery and greenhouse farmworkers and laborers accounted for 11 fatalities in this group, compared to the 20 reported in 2023. (See table 3.)
The transportation and material moving occupational group had the highest number of fatal workplace injuries with 110. Transportation incidents resulted in 65 fatalities among these workers. Heavy and tractor-trailer truck drivers accounted for 44 of the major group’s 110 fatal workplace injuries.
Wage and salary workers accounted for 80 percent of fatal workplace injuries in California; the self-employed comprised the remaining 20 percent. (See chart 1 and table 4.) Nationally, wage and salary workers comprised 82 percent of fatalities.
Males accounted for 92 percent of the work-related fatalities in both California and nationally.
Violent acts accounted for 40 percent of the 35 fatal injuries among female workers.
Hispanic or Latino workers accounted for 51 percent of fatal workplace injuries in California. Nationally, Hispanic or Latino workers comprised 24 percent of fatalities.
Workers 25-54 years old had a decrease in worker fatalities from 270 in 2023 to 242 in 2024.
Background of the program. The Census of Fatal Occupational Injuries (CFOI), part of the Bureau of Labor Statistics (BLS) Occupational Safety and Health Statistics (OSHS) program, is a count of all fatalities resulting from workplace injuries occurring in the U.S. during the calendar year. For technical information and definitions for the CFOI, see the national CFOI release Technical notes, the BLS Handbook of Methods, and the CFOI definitions.
Acknowledgments. BLS thanks the California Department of Industrial Relations for their efforts in collecting accurate, comprehensive, and useful data on fatal work injuries. BLS also appreciates the efforts of all federal, state, local, and private sector entities that provided source documents used to identify fatal work injuries nationally. See the national CFOI release Technical Notes for details on cooperating entities.
If you are deaf, hard of hearing, or have a speech disability, please dial 7-1-1 to access telecommunications relay services.
| Event or Exposure (1) | 2023 | 2024 | |
|---|---|---|---|
| Number | Number | Percent (%) | |
All events and exposures | 439 | 419 | 100 |
Violent acts | 95 | 76 | 18 |
Homicides (violent acts by other person) | 53 | 46 | 11 |
Shooting by other person | 44 | 34 | 8 |
Stabbing, cutting, slashing by other person | 2 | 6 | 1 |
Hitting, kicking, beating by other person | 4 | 4 | 1 |
Bombing, arson by other person | -- | 1 | 0 |
Suicides (intentional self-harm) | 42 | 30 | 7 |
Intentional self-harm-- shooting | 12 | 13 | 3 |
Intentional self-harm-- hanging, strangulation, asphyxiation | 24 | 9 | 2 |
Intentional self-harm-- jump from building, structure | 3 | 5 | 1 |
Transportation incidents | 108 | 114 | 27 |
Aircraft incidents | 10 | 14 | 3 |
Aircraft crash during takeoff or landing | -- | 5 | 1 |
Aircraft crash during takeoff or landing into structure, object, or ground | -- | 5 | 1 |
Pedestrian incidents involving motorized land vehicles | 25 | 30 | 7 |
Pedestrian struck by vehicle in road work zone | -- | 5 | 1 |
Pedestrian struck by forward-moving vehicle in road work zone | -- | 3 | 1 |
Pedestrian struck by vehicle backing up in road work zone | -- | 2 | 0 |
Pedestrian struck by vehicle in roadway | 14 | 13 | 3 |
Pedestrian struck by forward-moving vehicle in roadway | -- | 11 | 3 |
Pedestrian struck by vehicle in nonroadway area | -- | 12 | 3 |
Pedestrian struck by forward-moving vehicle in nonroadway area | -- | 8 | 2 |
Pedestrian struck by vehicle backing up in nonroadway area | -- | 3 | 1 |
Roadway incidents involving motorized land vehicle | 48 | 55 | 13 |
Roadway collision with other vehicle(s) | 26 | 31 | 7 |
Roadway collision with other vehicle(s)-intersecting, turning | 8 | 7 | 2 |
Roadway collision with other vehicle(s)-moving in same direction | 4 | 3 | 1 |
Roadway collision with other vehicle(s)-moving in opposite directions, oncoming | 6 | 14 | 3 |
Roadway collision with other vehicle(s)-moving and standing vehicle | 7 | 6 | 1 |
Roadway collision with object other than vehicle | 12 | 14 | 3 |
Collision with object or animal on side of roadway | 10 | 14 | 3 |
Roadway noncollision incident | 10 | 10 | 2 |
Roadway noncollision- vehicle overturn | 7 | 7 | 2 |
Roadway noncollision- jack-knifed or ran off road | -- | 3 | 1 |
Nonroadway incidents involving motorized land vehicles | 20 | 11 | 3 |
Nonroadway noncollision incident | 11 | 7 | 2 |
Falls, slips, trips | 79 | 94 | 22 |
Fall to lower level | 65 | 81 | 19 |
Fall to lower level from collapsing structure or equipment | 12 | 15 | 4 |
Fall to lower level from collapsing structure or equipment- 6 to 30 feet | 8 | 12 | 3 |
Fall to lower level from collapsing structure or equipment- more than 30 feet | -- | 2 | 0 |
Fall to lower level resulting from exposure or contact | 4 | 3 | 1 |
Fall to lower level resulting in exposure or contact | 5 | 5 | 1 |
Fall to lower level resulting in exposure or contact- less than 6 feet | 5 | 4 | 1 |
Other fall to lower level | 43 | 56 | 13 |
Other fall to lower level- less than 6 feet | 4 | 7 | 2 |
Other fall to lower level- 6 to 30 feet | 32 | 40 | 10 |
Other fall to lower level- more than 30 feet | 4 | 4 | 1 |
Slip, trip, stumble or fall on same level | 14 | 11 | 3 |
Fall on same level | -- | 10 | 2 |
Fall on same level due to slip or trip | -- | 4 | 1 |
Exposure to harmful substances, environments | 106 | 83 | 20 |
Exposure to electricity | 11 | 5 | 1 |
Exposure to electric arc | -- | 1 | 0 |
Exposure to harmful substances | 91 | 74 | 18 |
Footnotes: | |||
Note: The Census of Fatal Occupational Injuries (CFOI) has published data on fatal occupational injuries for the United States since 1992. During this time, the classification systems and definitions of many data elements have changed. See the CFOI Definitions page (www.bls.gov/iif/definitions/census-of-fatal-occupational-injuries-definitions.htm) for a more detailed description of each data element. Data for all years are revised and final. Totals for major categories may include subcategories not shown separately. Dashes indicate no data reported or data that do not meet publication criteria. CFOI fatal injury counts exclude illness-related deaths unless precipitated by an injury event. | |||
| Industry | 2023 | 2024 | |
|---|---|---|---|
| Number | Number | Percent (%) | |
Total | 439 | 419 | 100 |
Private industry (1) | 405 | 374 | 89 |
Natural resources and mining | -- | 31 | 7 |
Agriculture, forestry, fishing and hunting | 45 | 31 | 7 |
Crop production | 24 | 13 | 3 |
Fruit and tree nut farming | 11 | 10 | 2 |
Noncitrus fruit and tree nut farming | -- | 10 | 2 |
Other crop farming | 1 | 1 | 0 |
All other crop farming | -- | 1 | 0 |
Support activities for agriculture and forestry | 15 | 13 | 3 |
Construction | 78 | 81 | 19 |
Construction | 78 | 81 | 19 |
Construction of buildings | 18 | 26 | 6 |
Residential building construction | 13 | 17 | 4 |
Residential building construction | 13 | 17 | 4 |
New single-family housing construction (except for-sale builders) | -- | 2 | 0 |
Residential remodelers | 10 | 12 | 3 |
Nonresidential building construction | 5 | 8 | 2 |
Commercial and institutional building construction | 5 | 8 | 2 |
Heavy and civil engineering construction | 7 | 9 | 2 |
Utility system construction | 4 | 4 | 1 |
Water and sewer line and related structures construction | -- | 1 | 0 |
Power and communication line and related structures construction | -- | 3 | 1 |
Specialty trade contractors | 52 | 44 | 11 |
Foundation, structure, and building exterior contractors | 17 | 22 | 5 |
Poured concrete foundation and structure contractors | -- | 4 | 1 |
Structural steel and precast concrete contractors | -- | 2 | 0 |
Framing contractors | -- | 2 | 0 |
Roofing contractors | 14 | 13 | 3 |
Other foundation, structure, and building exterior contractors | -- | 1 | 0 |
Building equipment contractors | 19 | 5 | 1 |
Building finishing contractors | 7 | 12 | 3 |
Flooring contractors | -- | 4 | 1 |
Finish carpentry contractors | -- | 4 | 1 |
Other specialty trade contractors | 9 | 5 | 1 |
Manufacturing | 21 | 24 | 6 |
Manufacturing | 21 | 24 | 6 |
Food manufacturing | 5 | 3 | 1 |
Animal slaughtering and processing | -- | 3 | 1 |
Animal slaughtering and processing | -- | 3 | 1 |
Beverage and tobacco product manufacturing | -- | 1 | 0 |
Beverage manufacturing | -- | 1 | 0 |
Apparel manufacturing | -- | 1 | 0 |
Apparel accessories and other apparel manufacturing | -- | 1 | 0 |
Apparel accessories and other apparel manufacturing | -- | 1 | 0 |
Chemical manufacturing | -- | 1 | 0 |
Fabricated metal product manufacturing | 3 | 3 | 1 |
Architectural and structural metals manufacturing | -- | 1 | 0 |
Plate work and fabricated structural product manufacturing | -- | 1 | 0 |
Transportation equipment manufacturing | 4 | 3 | 1 |
Trade, transportation, and utilities | -- | 108 | 26 |
Utilities | -- | 1 | 0 |
Utilities | -- | 1 | 0 |
Wholesale trade | 16 | 9 | 2 |
Merchant wholesalers, durable goods | 9 | 9 | 2 |
Lumber and other construction materials merchant wholesalers | -- | 1 | 0 |
Lumber, plywood, millwork, and wood panel merchant wholesalers | -- | 1 | 0 |
Machinery, equipment, and supplies merchant wholesalers | -- | 1 | 0 |
Industrial supplies merchant wholesalers | -- | 1 | 0 |
Miscellaneous durable goods merchant wholesalers | -- | 3 | 1 |
Retail trade | 34 | 28 | 7 |
Food and beverage retailers | 13 | 9 | 2 |
Furniture, home furnishings, electronics, and appliance retailers | -- | 1 | 0 |
Electronics and appliance retailers | -- | 1 | 0 |
Electronics and appliance retailers | -- | 1 | 0 |
General merchandise retailers | 3 | 3 | 1 |
Warehouse clubs, supercenters, and other general merchandise retailers | -- | 3 | 1 |
Warehouse clubs, supercenters, and other general merchandise retailers | -- | 3 | 1 |
Gasoline stations and fuel dealers | 4 | 4 | 1 |
Clothing, clothing accessories, shoe, and jewelry retailers | -- | 3 | 1 |
Sporting goods, hobby, musical instrument, book, and miscellaneous retailers | 5 | 5 | 1 |
Other miscellaneous retailers | 3 | 1 | 0 |
Transportation and warehousing | 66 | 70 | 17 |
Truck transportation | 31 | 43 | 10 |
General freight trucking | 24 | 32 | 8 |
General freight trucking, local | 11 | 10 | 2 |
General freight trucking, long-distance | 11 | 19 | 5 |
General freight trucking, long-distance, truckload | 6 | 9 | 2 |
General freight trucking, long-distance, less than truckload | -- | 1 | 0 |
Specialized freight trucking | 5 | 10 | 2 |
Specialized freight (except used goods) trucking, long-distance | -- | 4 | 1 |
Transit and ground passenger transportation | 9 | 3 | 1 |
Taxi and limousine service | 6 | 3 | 1 |
Taxi and ridesharing services | 6 | 3 | 1 |
Scenic and sightseeing transportation | -- | 2 | 0 |
Scenic and sightseeing transportation, other | -- | 2 | 0 |
Scenic and sightseeing transportation, other | -- | 2 | 0 |
Support activities for transportation | 10 | 10 | 2 |
Support activities for water transportation | -- | 3 | 1 |
Support activities for road transportation | 7 | 4 | 1 |
Motor vehicle towing | 7 | 4 | 1 |
Couriers and messengers | 4 | 8 | 2 |
Couriers and express delivery services | -- | 5 | 1 |
Couriers and express delivery services | -- | 5 | 1 |
Local messengers and local delivery | -- | 3 | 1 |
Local messengers and local delivery | -- | 3 | 1 |
Warehousing and storage | 4 | 4 | 1 |
Warehousing and storage | 4 | 4 | 1 |
General warehousing and storage | -- | 4 | 1 |
Information | -- | 7 | 2 |
Information | -- | 7 | 2 |
Motion picture and sound recording industries | -- | 3 | 1 |
Motion picture and video industries | -- | 3 | 1 |
Financial activities | 13 | 11 | 3 |
Real estate and rental and leasing | 13 | 11 | 3 |
Real estate | 6 | 8 | 2 |
Lessors of real estate | -- | 3 | 1 |
Activities related to real estate | 3 | 5 | 1 |
Real estate property managers | -- | 5 | 1 |
Residential property managers | -- | 5 | 1 |
Rental and leasing services | 7 | 3 | 1 |
Commercial and industrial machinery and equipment rental and leasing | 4 | 3 | 1 |
Professional and business services | 64 | 61 | 15 |
Professional, scientific, and technical services | 6 | 6 | 1 |
Professional, scientific, and technical services | 6 | 6 | 1 |
Architectural, engineering, and related services | -- | 3 | 1 |
Testing laboratories and services | -- | 1 | 0 |
Administrative and support and waste management and remediation services | 58 | 55 | 13 |
Administrative and support services | 54 | 45 | 11 |
Employment services | 6 | 4 | 1 |
Investigation and security services | 11 | 8 | 2 |
Investigation, guard, and armored car services | -- | 8 | 2 |
Security guards and patrol services | -- | 8 | 2 |
Services to buildings and dwellings | 36 | 33 | 8 |
Landscaping services | 30 | 22 | 5 |
Other services to buildings and dwellings | -- | 5 | 1 |
Waste management and remediation services | 4 | 10 | 2 |
Waste collection | -- | 3 | 1 |
Waste collection | -- | 3 | 1 |
Remediation and other waste management services | -- | 7 | 2 |
Remediation services | -- | 4 | 1 |
Educational and health services | 15 | 8 | 2 |
Health care and social assistance | 11 | 8 | 2 |
Hospitals | -- | 4 | 1 |
General medical and surgical hospitals | -- | 4 | 1 |
General medical and surgical hospitals | -- | 4 | 1 |
Leisure and hospitality | 28 | 28 | 7 |
Arts, entertainment, and recreation | 10 | 12 | 3 |
Performing arts, spectator sports, and related industries | 4 | 4 | 1 |
Performing arts companies | -- | 1 | 0 |
Museums, historical sites, and similar institutions | -- | 2 | 0 |
Museums, historical sites, and similar institutions | -- | 2 | 0 |
Museums | -- | 2 | 0 |
Amusement, gambling, and recreation industries | 6 | 6 | 1 |
Amusement parks and arcades | -- | 1 | 0 |
Other amusement and recreation industries | -- | 5 | 1 |
All other amusement and recreation industries | -- | 1 | 0 |
Accommodation and food services | 18 | 16 | 4 |
Accommodation | -- | 6 | 1 |
Traveler accommodation | -- | 5 | 1 |
Hotels (except casino hotels) and motels | -- | 5 | 1 |
Rv (recreational vehicle) parks and recreational camps | -- | 1 | 0 |
Rv (recreational vehicle) parks and recreational camps | -- | 1 | 0 |
Food services and drinking places | -- | 10 | 2 |
Special food services | -- | 3 | 1 |
Mobile food services | -- | 1 | 0 |
Restaurants and other eating places | -- | 7 | 2 |
Restaurants and other eating places | -- | 7 | 2 |
Full-service restaurants | -- | 4 | 1 |
Limited-service restaurants | -- | 3 | 1 |
Other services (except public administration) | 20 | 15 | 4 |
Other services (except public administration) | 20 | 15 | 4 |
Repair and maintenance | 14 | 11 | 3 |
Personal and laundry services | -- | 3 | 1 |
Other personal services | -- | 1 | 0 |
All other personal services | -- | 1 | 0 |
Religious, grantmaking, civic, professional, and similar organizations | -- | 1 | 0 |
Civic and social organizations | -- | 1 | 0 |
Civic and social organizations | -- | 1 | 0 |
Government (2) | 34 | 45 | 11 |
Federal government | 12 | 17 | 4 |
State government | 5 | 4 | 1 |
Local government | 17 | 24 | 6 |
Footnotes: | |||
Note: The Census of Fatal Occupational Injuries (CFOI) has published data on fatal occupational injuries for the United States since 1992. During this time, the classification systems and definitions of many data elements have changed. See the CFOI Definitions page (www.bls.gov/iif/definitions/census-of-fatal-occupational-injuries-definitions.htm) for a more detailed description of each data element. Data for all years are revised and final. Totals for major categories may include subcategories not shown separately. Dashes indicate no data reported or data that do not meet publication criteria. CFOI fatal injury counts exclude illness-related deaths unless precipitated by an injury event. | |||
| Occupation (1) | 2023 | 2024 | |
|---|---|---|---|
| Number | Number | Percent (%) | |
All occupations | 439 | 419 | 100 |
Management occupations | 13 | 13 | 3 |
Other management occupations | 10 | 9 | 2 |
Farmers, ranchers, and other agricultural managers | 6 | 1 | 0 |
Farmers, ranchers, and other agricultural managers | 6 | 1 | 0 |
Food service managers | -- | 1 | 0 |
Food service managers | -- | 1 | 0 |
Property, real estate, and community association managers | -- | 3 | 1 |
Property, real estate, and community association managers | -- | 3 | 1 |
Business and financial operations occupations | -- | 4 | 1 |
Educational instruction and library occupations | -- | 3 | 1 |
Other teachers and instructors | -- | 1 | 0 |
Self-enrichment teachers | -- | 1 | 0 |
Self-enrichment teachers | -- | 1 | 0 |
Arts, design, entertainment, sports, and media occupations | 4 | 6 | 1 |
Entertainers and performers, sports and related workers | -- | 1 | 0 |
Musicians, singers, and related workers | -- | 1 | 0 |
Media and communication equipment workers | -- | 3 | 1 |
Healthcare practitioners and technical occupations | -- | 4 | 1 |
Healthcare diagnosing or treating practitioners | -- | 4 | 1 |
Protective service occupations | 30 | 24 | 6 |
Other protective service workers | 20 | 11 | 3 |
Food preparation and serving related occupations | 13 | 5 | 1 |
Cooks and food preparation workers | -- | 3 | 1 |
Building and grounds cleaning and maintenance occupations | 40 | 39 | 9 |
Supervisors of building and grounds cleaning and maintenance workers | 6 | 4 | 1 |
First-line supervisors of building and grounds cleaning and maintenance workers | 6 | 4 | 1 |
Building cleaning and pest control workers | 7 | 16 | 4 |
Grounds maintenance workers | 27 | 19 | 5 |
Grounds maintenance workers | 27 | 19 | 5 |
Landscaping and groundskeeping workers | 14 | 9 | 2 |
Tree trimmers and pruners | 11 | 10 | 2 |
Personal care and service occupations | 5 | 7 | 2 |
Supervisors of personal care and service workers | 1 | 2 | 0 |
Animal care and service workers | -- | 3 | 1 |
Sales and related occupations | 26 | 23 | 5 |
Supervisors of sales workers | -- | 5 | 1 |
First-line supervisors of sales workers | -- | 5 | 1 |
First-line supervisors of retail sales workers | -- | 5 | 1 |
Retail sales workers | 14 | 16 | 4 |
Cashiers | 11 | 7 | 2 |
Retail salespersons | 3 | 9 | 2 |
Retail salespersons | 3 | 9 | 2 |
Sales representatives, wholesale and manufacturing | -- | 1 | 0 |
Sales representatives, wholesale and manufacturing | -- | 1 | 0 |
Sales representatives, wholesale and manufacturing, except technical and scientific products | -- | 1 | 0 |
Other sales and related workers | 6 | 1 | 0 |
Office and administrative support occupations | 11 | 8 | 2 |
Material recording, scheduling, dispatching, and distributing workers | -- | 5 | 1 |
Farming, fishing, and forestry occupations | 36 | 24 | 6 |
Supervisors of farming, fishing, and forestry workers | -- | 3 | 1 |
First-line supervisors of farming, fishing, and forestry workers | -- | 3 | 1 |
First-line supervisors of farming, fishing, and forestry workers | -- | 3 | 1 |
Agricultural workers | 31 | 17 | 4 |
Miscellaneous agricultural workers | 31 | 17 | 4 |
Farmworkers and laborers, crop, nursery, and greenhouse | 20 | 11 | 3 |
Construction and extraction occupations | 77 | 80 | 19 |
Supervisors of construction and extraction workers | 12 | 5 | 1 |
First-line supervisors of construction trades and extraction workers | 12 | 5 | 1 |
First-line supervisors of construction trades and extraction workers | 12 | 5 | 1 |
Construction trades workers | 61 | 71 | 17 |
Carpenters | 6 | 5 | 1 |
Carpenters | 6 | 5 | 1 |
Carpet, floor, and tile installers and finishers | -- | 4 | 1 |
Construction laborers | 24 | 39 | 9 |
Construction laborers | 24 | 39 | 9 |
Construction equipment operators | 3 | 1 | 0 |
Operating engineers and other construction equipment operators | 3 | 1 | 0 |
Pipelayers, plumbers, pipefitters, and steamfitters | 4 | 4 | 1 |
Plumbers, pipefitters, and steamfitters | -- | 4 | 1 |
Roofers | 10 | 13 | 3 |
Roofers | 10 | 13 | 3 |
Installation, maintenance, and repair occupations | 39 | 29 | 7 |
Supervisors of installation, maintenance, and repair workers | 16 | 3 | 1 |
First-line supervisors of mechanics, installers, and repairers | 16 | 3 | 1 |
First-line supervisors of mechanics, installers, and repairers | 16 | 3 | 1 |
Vehicle and mobile equipment mechanics, installers, and repairers | -- | 11 | 3 |
Aircraft mechanics and service technicians | -- | 1 | 0 |
Aircraft mechanics and service technicians | -- | 1 | 0 |
Automotive technicians and repairers | -- | 4 | 1 |
Bus and truck mechanics and diesel engine specialists | -- | 3 | 1 |
Bus and truck mechanics and diesel engine specialists | -- | 3 | 1 |
Other installation, maintenance, and repair occupations | 16 | 15 | 4 |
Maintenance and repair workers, general | 6 | 8 | 2 |
Maintenance and repair workers, general | 6 | 8 | 2 |
Miscellaneous installation, maintenance, and repair workers | 4 | 4 | 1 |
Production occupations | 11 | 19 | 5 |
Assemblers and fabricators | -- | 4 | 1 |
Food processing workers | 3 | 3 | 1 |
Other production occupations | -- | 5 | 1 |
Transportation and material moving occupations | 105 | 110 | 26 |
Supervisors of transportation and material moving workers | 7 | 1 | 0 |
First-line supervisors of transportation and material moving workers | 7 | 1 | 0 |
First-line supervisors of material-moving machine and vehicle operators | 4 | 1 | 0 |
Air transportation workers | 7 | 6 | 1 |
Aircraft pilots and flight engineers | 7 | 6 | 1 |
Commercial pilots | -- | 6 | 1 |
Motor vehicle operators | 63 | 73 | 17 |
Driver/sales workers and truck drivers | 52 | 68 | 16 |
Driver/sales workers | -- | 13 | 3 |
Heavy and tractor-trailer truck drivers | 40 | 44 | 11 |
Light truck drivers | -- | 11 | 3 |
Passenger vehicle drivers | -- | 5 | 1 |
Taxi drivers | -- | 3 | 1 |
Material moving workers | 24 | 30 | 7 |
Laborers and material movers | 19 | 22 | 5 |
Laborers and freight, stock, and material movers, hand | 13 | 16 | 4 |
Stockers and order fillers | 3 | 4 | 1 |
Refuse and recyclable material collectors | -- | 4 | 1 |
Refuse and recyclable material collectors | -- | 4 | 1 |
Footnotes: | |||
Note: The Census of Fatal Occupational Injuries (CFOI) has published data on fatal occupational injuries for the United States since 1992. During this time, the classification systems and definitions of many data elements have changed. See the CFOI Definitions page (www.bls.gov/iif/definitions/census-of-fatal-occupational-injuries-definitions.htm) for a more detailed description of each data element. Data for all years are revised and final. Totals for major categories may include subcategories not shown separately. Dashes indicate no data reported or data that do not meet publication criteria. CFOI fatal injury counts exclude illness-related deaths unless precipitated by an injury event. | |||
| Demographic | 2023 | 2024 | |
|---|---|---|---|
| Number | Number | Percent (%) | |
Total | 439 | 419 | 100 |
Employee status | |||
Wage and salary workers (1) | 354 | 335 | 80 |
Self-employed (2) | 85 | 84 | 20 |
Sex | |||
Male | 402 | 384 | 92 |
Female | 37 | 35 | 8 |
Age (3) | |||
Under 16 years | -- | -- | -- |
16 to 17 years | -- | -- | -- |
18 to 19 years | -- | 5 | 1 |
20 to 24 years | 32 | 25 | 6 |
25 to 34 years | 85 | 76 | 18 |
35 to 44 years | 90 | 77 | 18 |
45 to 54 years | 95 | 89 | 21 |
55 to 64 years | 82 | 89 | 21 |
65 years and over | 52 | 58 | 14 |
Race or ethnic origin (4) | |||
White, non-Hispanic | 146 | 135 | 32 |
Black or African-American, non-Hispanic | 28 | 23 | 5 |
Hispanic or Latino | 210 | 215 | 51 |
American Indian or Alaska Native, non-Hispanic | -- | -- | -- |
Asian, non-Hispanic | 52 | 41 | 10 |
Native Hawaiian or Pacific Islander, non-Hispanic | -- | -- | -- |
Person of multiple races, non-Hispanic | -- | -- | -- |
Other or not reported, non-Hispanic | -- | -- | -- |
Footnotes: | |||
Note: The Census of Fatal Occupational Injuries (CFOI) has published data on fatal occupational injuries for the United States since 1992. During this time, the classification systems and definitions of many data elements have changed. See the CFOI Definitions page (www.bls.gov/iif/definitions/census-of-fatal-occupational-injuries-definitions.htm) for a more detailed description of each data element. Data for all years are revised and final. Totals for major categories may include subcategories not shown separately. Dashes indicate no data reported or data that do not meet publication criteria. CFOI fatal injury counts exclude illness-related deaths unless precipitated by an injury event. | |||
Last Modified Date: Wednesday, April 01, 2026