An official website of the United States government
An official website of the United States government
The .gov means it's official.
Federal government websites often end in .gov or .mil. Before sharing sensitive information,
make sure you're on a federal government site.
The site is secure.
The
https:// ensures that you are connecting to the official website and that any
information you provide is encrypted and transmitted securely.
26-581-SAN
Wednesday, April 01, 2026
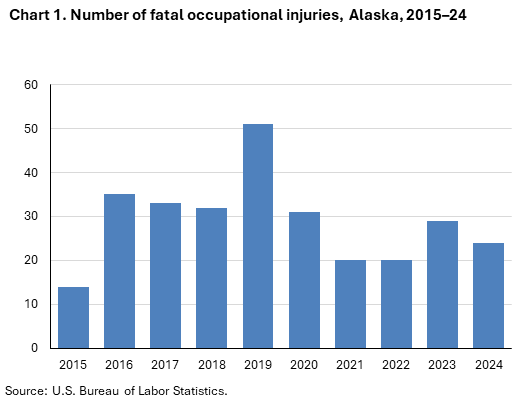
Fatal work injuries totaled 24 in 2024 for Alaska, the U.S. Bureau of Labor Statistics reported today. Regional Commissioner Chris Rosenlund noted that the number of work-related fatalities in Alaska was down 17.2 percent from 29 in 2023. (See chart 1.) The fatal work injury rate was 7.1 fatalities per 100,000 full-time equivalent (FTE) workers in 2024, a decrease from a rate of 7.4 in 2023. Nationwide, a total of 5,070 fatal work injuries were recorded in 2024, a 4.0-percent decrease from 5,283 in 2023. These data are from the Census of Fatal Occupational Injuries (CFOI).
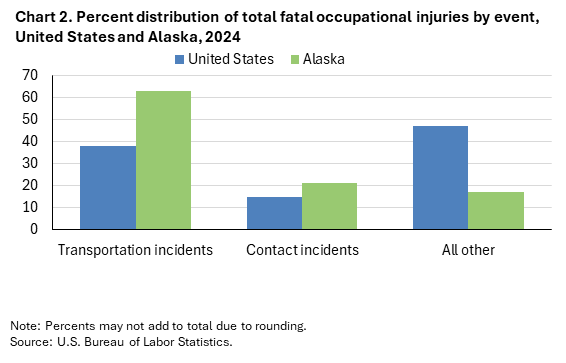
Fatal event or exposureTransportation incidents (15) were the most frequent type of fatal event in Alaska, accounting for 63 percent of all fatal work injuries in the state. Nationally the share was 38 percent. Worker deaths from transportation incidents were down from 18 over the year. (See chart 2 and table 1.)
Contact incidents (5) accounted for 21 percent of Alaska worker fatalities; nationally the share was 15 percent.
The agriculture, forestry, fishing and hunting sector had the highest number of fatalities with 10, up from 3 the previous year. (See table 2.)
Transportation incidents resulted in 8 of the 10 fatalities in this sector.
The fishing industry group accounted for all 10 of the sector’s fatal workplace injuries.
Transportation and material moving workers experienced 7 fatal work injuries in 2024, compared to 10 the previous year. Commercial pilots accounted for 5 of the 7 fatalities. (See table 3.)
The farming, fishing, and forestry occupational group had the highest number of fatal workplace injuries with 10. Fishing and hunting workers accounted for all 10 of the major group’s fatal workplace injuries.
Males accounted for 92 percent of the work-related fatalities in both Alaska and nationally. (See table 4.)
Fatal workplace injuries among male workers decreased from 26 to 22, with transportation incidents accounting for 59 percent of fatal events in 2024.
White non-Hispanics accounted for 79 percent of those who died from a workplace injury. Nationwide, this group accounted for 56 percent of work-related deaths.
Workers aged 55 years and older accounted for 29 percent of the state’s work-related fatalities in 2024, compared to 37 percent of on-the-job fatalities nationally.
Background of the program. The Census of Fatal Occupational Injuries (CFOI), part of the Bureau of Labor Statistics (BLS) Occupational Safety and Health Statistics (OSHS) program, is a count of all fatalities resulting from workplace injuries occurring in the U.S. during the calendar year. For technical information and definitions for the CFOI, see the national CFOI release Technical notes, the BLS Handbook of Methods, and the CFOI definitions.
Acknowledgments. BLS thanks the Alaska Department of Labor and Workforce Development for their efforts in collecting accurate, comprehensive, and useful data on fatal work injuries. BLS also appreciates the efforts of all federal, state, local, and private sector entities that provided source documents used to identify fatal work injuries nationally. See the national CFOI release Technical Notes for details on cooperating entities.
If you are deaf, hard of hearing, or have a speech disability, please dial 7-1-1 to access telecommunications relay services.
| Event or Exposure (1) | 2023 | 2024 | |
|---|---|---|---|
| Number | Number | Percent (%) | |
|
All events and exposures |
29 | 24 | 100 |
|
Transportation incidents |
18 | 15 | 63 |
|
Water vehicle incidents |
-- | 8 | 33 |
|
Capsized or sinking water vehicle (non collision) |
-- | 5 | 21 |
|
Incidents onboard water vehicle in normal operation |
-- | 3 | 13 |
|
Fall, jump from water vehicle |
-- | 3 | 13 |
|
Contact incidents |
3 | 5 | 21 |
|
Footnotes: |
|||
|
Note: The Census of Fatal Occupational Injuries (CFOI) has published data on fatal occupational injuries for the United States since 1992. During this time, the classification systems and definitions of many data elements have changed. See the CFOI Definitions page (www.bls.gov/iif/definitions/census-of-fatal-occupational-injuries-definitions.htm) for a more detailed description of each data element. Data for all years are revised and final. Totals for major categories may include subcategories not shown separately. Dashes indicate no data reported or data that do not meet publication criteria. CFOI fatal injury counts exclude illness-related deaths unless precipitated by an injury event. |
|||
| Industry | 2023 | 2024 | |
|---|---|---|---|
| Number | Number | Percent (%) | |
|
Total |
29 | 24 | 100 |
|
Private industry (1) |
20 | 21 | 88 |
|
Natural resources and mining |
6 | -- | -- |
|
Agriculture, forestry, fishing and hunting |
3 | 10 | 42 |
|
Fishing, hunting and trapping |
3 | 10 | 42 |
|
Fishing |
3 | 10 | 42 |
|
Fishing |
3 | 10 | 42 |
|
Construction |
-- | -- | -- |
|
Manufacturing |
-- | -- | -- |
|
Trade, transportation, and utilities |
7 | -- | -- |
|
Wholesale trade |
-- | 2 | 8 |
|
Transportation and warehousing |
6 | 3 | 13 |
|
Information |
-- | -- | -- |
|
Financial activities |
1 | -- | -- |
|
Professional and business services |
-- | -- | -- |
|
Educational and health services |
-- | 1 | 4 |
|
Educational services |
-- | 1 | 4 |
|
Educational services |
-- | 1 | 4 |
|
Technical and trade schools |
-- | 1 | 4 |
|
Technical and trade schools |
-- | 1 | 4 |
|
Flight training |
-- | 1 | 4 |
|
Leisure and hospitality |
-- | -- | -- |
|
Other services (except public administration) |
-- | -- | -- |
|
Government (2) |
9 | 3 | 12 |
|
Federal government |
6 | 2 | 8 |
|
State government |
3 | -- | -- |
|
Local government |
-- | 1 | 4 |
|
Footnotes: |
|||
|
Note: The Census of Fatal Occupational Injuries (CFOI) has published data on fatal occupational injuries for the United States since 1992. During this time, the classification systems and definitions of many data elements have changed. See the CFOI Definitions page (www.bls.gov/iif/definitions/census-of-fatal-occupational-injuries-definitions.htm) for a more detailed description of each data element. Data for all years are revised and final. Totals for major categories may include subcategories not shown separately. Dashes indicate no data reported or data that do not meet publication criteria. CFOI fatal injury counts exclude illness-related deaths unless precipitated by an injury event. |
|||
| Occupation (1) | 2023 | 2024 | |
|---|---|---|---|
| Number | Number | Percent (%) | |
|
All occupations |
29 | 24 | 100 |
|
Farming, fishing, and forestry occupations |
-- | 10 | 42 |
|
Fishing and hunting workers |
-- | 10 | 42 |
|
Fishing and hunting workers |
-- | 10 | 42 |
|
Fishing and hunting workers |
-- | 10 | 42 |
|
Transportation and material moving occupations |
10 | 7 | 29 |
|
Air transportation workers |
4 | 5 | 21 |
|
Aircraft pilots and flight engineers |
4 | 5 | 21 |
|
Commercial pilots |
4 | 5 | 21 |
|
Footnotes: |
|||
|
Note: The Census of Fatal Occupational Injuries (CFOI) has published data on fatal occupational injuries for the United States since 1992. During this time, the classification systems and definitions of many data elements have changed. See the CFOI Definitions page (www.bls.gov/iif/definitions/census-of-fatal-occupational-injuries-definitions.htm) for a more detailed description of each data element. Data for all years are revised and final. Totals for major categories may include subcategories not shown separately. Dashes indicate no data reported or data that do not meet publication criteria. CFOI fatal injury counts exclude illness-related deaths unless precipitated by an injury event. |
|||
| Demographic | 2023 | 2024 | |
|---|---|---|---|
| Number | Number | Percent (%) | |
|
Total |
29 | 24 | 100 |
|
Employee status |
|||
|
Wage and salary workers (1) |
23 | -- | -- |
|
Self-employed (2) |
6 | -- | -- |
|
Sex |
|||
|
Male |
26 | 22 | 92 |
|
Female |
-- | -- | -- |
|
Age (3) |
|||
|
Under 16 years |
-- | -- | -- |
|
16 to 17 years |
-- | -- | -- |
|
18 to 19 years |
-- | -- | -- |
|
20 to 24 years |
-- | 5 | 21 |
|
25 to 34 years |
11 | 5 | 21 |
|
35 to 44 years |
4 | 6 | 25 |
|
45 to 54 years |
5 | -- | -- |
|
55 to 64 years |
-- | 3 | 13 |
|
65 years and over |
3 | 4 | 17 |
|
Race or ethnic origin (4) |
|||
|
White, non-Hispanic |
22 | 19 | 79 |
|
Black or African-American, non-Hispanic |
-- | -- | -- |
|
Hispanic or Latino |
-- | -- | -- |
|
American Indian or Alaska Native, non-Hispanic |
-- | -- | -- |
|
Asian, non-Hispanic |
-- | -- | -- |
|
Native Hawaiian or Pacific Islander, non-Hispanic |
-- | -- | -- |
|
Person of multiple races, non-Hispanic |
-- | -- | -- |
|
Other or not reported, non-Hispanic |
-- | -- | -- |
|
Footnotes: |
|||
|
Note: The Census of Fatal Occupational Injuries (CFOI) has published data on fatal occupational injuries for the United States since 1992. During this time, the classification systems and definitions of many data elements have changed. See the CFOI Definitions page (www.bls.gov/iif/definitions/census-of-fatal-occupational-injuries-definitions.htm) for a more detailed description of each data element. Data for all years are revised and final. Totals for major categories may include subcategories not shown separately. Dashes indicate no data reported or data that do not meet publication criteria. CFOI fatal injury counts exclude illness-related deaths unless precipitated by an injury event. |
|||
Last Modified Date: Wednesday, April 01, 2026