An official website of the United States government
An official website of the United States government
The .gov means it's official.
Federal government websites often end in .gov or .mil. Before sharing sensitive information,
make sure you're on a federal government site.
The site is secure.
The
https:// ensures that you are connecting to the official website and that any
information you provide is encrypted and transmitted securely.
26-588-SAN
Wednesday, April 01, 2026
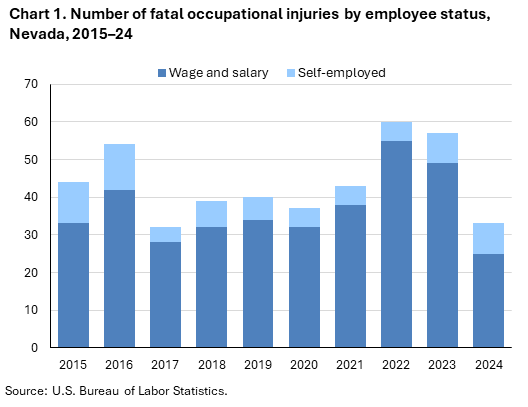
Fatal work injuries totaled 33 in 2024 for Nevada, the U.S. Bureau of Labor Statistics reported today. Regional Commissioner Chris Rosenlund noted that the number of work-related fatalities in Nevada was down 42.1 percent from 57 in 2023. (See chart 1.) The fatal work injury rate was 2.3 fatalities per 100,000 full-time equivalent (FTE) workers in 2024, a decrease from a rate of 4.0 in 2023. Nationwide, a total of 5,070 fatal work injuries were recorded in 2024, a 4.0-percent decrease from 5,283 in 2023. These data are from the Census of Fatal Occupational Injuries (CFOI).
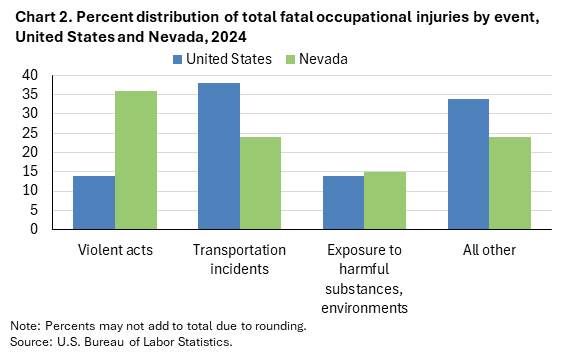
Fatal event or exposureViolent acts (12) were the most frequent type of fatal event in Nevada, accounting for 36 percent of all fatal work injuries in the state. Nationally the share was 14 percent. (See chart 2 and table 1.)
Transportation incidents (8) accounted for 24 percent of Nevada workplace fatalities; exposure to harmful substances or environments (5) accounted for 15 percent. Nationally the shares were 38 percent and 14 percent, respectively.
The construction sector had nine fatalities. (See table 2.)
Transportation incidents resulted in 3 of the 9 construction sector fatalities.
The specialty trade contractors subsector accounted for seven of the sector’s fatal workplace injuries.
Fatal work injuries declined by six over the year in the construction and extraction occupational group. (See table 3.)
The transportation and material moving occupational group had the highest number of fatal workplace injuries with 10. Violent acts and transportation incidents each resulted in four fatalities among these workers. Heavy and tractor-trailer truck drivers accounted for six of the major group’s fatal workplace injuries.
Wage and salary workers accounted for 76 percent of fatal workplace injuries in Nevada; the self-employed comprised the remaining 24 percent. (See chart 1 and table 4.) Nationally, wage and salary workers comprised 82 percent of fatalities.
Workers 35-44 years old had a decrease in fatalities from 17 in 2023 to 5 in 2024.
Fatal injuries declined for both White, non-Hispanic workers (down 10 to 20) and Hispanic or Latino workers (down 11 to 9) over the year.
Background of the program. The Census of Fatal Occupational Injuries (CFOI), part of the Bureau of Labor Statistics (BLS) Occupational Safety and Health Statistics (OSHS) program, is a count of all fatalities resulting from workplace injuries occurring in the U.S. during the calendar year. For technical information and definitions for the CFOI, see the national CFOI release Technical notes, the BLS Handbook of Methods, and the CFOI definitions.
Acknowledgments. BLS thanks the Nevada Division of Industrial Relations for their efforts in collecting accurate, comprehensive, and useful data on fatal work injuries. BLS also appreciates the efforts of all federal, state, local, and private sector entities that provided source documents used to identify fatal work injuries nationally. See the national CFOI release Technical Notes for details on cooperating entities.
If you are deaf, hard of hearing, or have a speech disability, please dial 7-1-1 to access telecommunications relay services.
| Event or Exposure (1) | 2023 | 2024 | |
|---|---|---|---|
| Number | Number | Percent (%) | |
|
All events and exposures |
57 | 33 | 100 |
|
Violent acts |
-- | 12 | 36 |
|
Transportation incidents |
17 | 8 | 24 |
|
Exposure to harmful substances, environments |
10 | 5 | 15 |
|
Exposure to harmful substances |
7 | 5 | 15 |
|
Drug, alcohol overdose |
7 | 5 | 15 |
|
Footnotes: |
|||
|
Note: The Census of Fatal Occupational Injuries (CFOI) has published data on fatal occupational injuries for the United States since 1992. During this time, the classification systems and definitions of many data elements have changed. See the CFOI Definitions page (www.bls.gov/iif/definitions/census-of-fatal-occupational-injuries-definitions.htm) for a more detailed description of each data element. Data for all years are revised and final. Totals for major categories may include subcategories not shown separately. Dashes indicate no data reported or data that do not meet publication criteria. CFOI fatal injury counts exclude illness-related deaths unless precipitated by an injury event. |
|||
| Industry | 2023 | 2024 | |
|---|---|---|---|
| Number | Number | Percent (%) | |
|
Total |
57 | 33 | 100 |
|
Private industry (1) |
49 | 31 | 94 |
|
Natural resources and mining |
-- | -- | -- |
|
Construction |
8 | 9 | 27 |
|
Construction |
8 | 9 | 27 |
|
Specialty trade contractors |
6 | 7 | 21 |
|
Other specialty trade contractors |
-- | 4 | 12 |
|
Manufacturing |
7 | -- | -- |
|
Trade, transportation, and utilities |
-- | -- | -- |
|
Transportation and warehousing |
4 | 5 | 15 |
|
Truck transportation |
3 | 3 | 9 |
|
Transit and ground passenger transportation |
-- | 1 | 3 |
|
Taxi and limousine service |
-- | 1 | 3 |
|
Taxi and ridesharing services |
-- | 1 | 3 |
|
Support activities for transportation |
1 | 1 | 3 |
|
Support activities for road transportation |
1 | 1 | 3 |
|
Motor vehicle towing |
1 | 1 | 3 |
|
Information |
-- | -- | -- |
|
Financial activities |
-- | -- | -- |
|
Professional and business services |
-- | -- | -- |
|
Administrative and support and waste management and remediation services |
7 | 6 | 18 |
|
Administrative and support services |
-- | 6 | 18 |
|
Investigation and security services |
-- | 3 | 9 |
|
Investigation, guard, and armored car services |
-- | 3 | 9 |
|
Security guards and patrol services |
-- | 3 | 9 |
|
Educational and health services |
-- | -- | -- |
|
Leisure and hospitality |
-- | -- | -- |
|
Accommodation and food services |
-- | 3 | 9 |
|
Other services (except public administration) |
-- | -- | -- |
|
Government (2) |
8 | -- | -- |
|
Federal government |
1 | -- | -- |
|
State government |
5 | -- | -- |
|
Local government |
-- | -- | -- |
|
Footnotes: |
|||
|
Note: The Census of Fatal Occupational Injuries (CFOI) has published data on fatal occupational injuries for the United States since 1992. During this time, the classification systems and definitions of many data elements have changed. See the CFOI Definitions page (www.bls.gov/iif/definitions/census-of-fatal-occupational-injuries-definitions.htm) for a more detailed description of each data element. Data for all years are revised and final. Totals for major categories may include subcategories not shown separately. Dashes indicate no data reported or data that do not meet publication criteria. CFOI fatal injury counts exclude illness-related deaths unless precipitated by an injury event. |
|||
| Occupation (1) | 2023 | 2024 | |
|---|---|---|---|
| Number | Number | Percent (%) | |
|
All occupations |
57 | 33 | 100 |
|
Protective service occupations |
-- | 4 | 12 |
|
Other protective service workers |
-- | 3 | 9 |
|
Security guards and gambling surveillance officers |
-- | 3 | 9 |
|
Security guards |
-- | 3 | 9 |
|
Food preparation and serving related occupations |
-- | 3 | 9 |
|
Construction and extraction occupations |
9 | 3 | 9 |
|
Transportation and material moving occupations |
13 | 10 | 30 |
|
Motor vehicle operators |
6 | 7 | 21 |
|
Driver/sales workers and truck drivers |
6 | 6 | 18 |
|
Heavy and tractor-trailer truck drivers |
3 | 6 | 18 |
|
Passenger vehicle drivers |
-- | 1 | 3 |
|
Taxi drivers |
-- | 1 | 3 |
|
Material moving workers |
-- | 3 | 9 |
|
Footnotes: |
|||
|
Note: The Census of Fatal Occupational Injuries (CFOI) has published data on fatal occupational injuries for the United States since 1992. During this time, the classification systems and definitions of many data elements have changed. See the CFOI Definitions page (www.bls.gov/iif/definitions/census-of-fatal-occupational-injuries-definitions.htm) for a more detailed description of each data element. Data for all years are revised and final. Totals for major categories may include subcategories not shown separately. Dashes indicate no data reported or data that do not meet publication criteria. CFOI fatal injury counts exclude illness-related deaths unless precipitated by an injury event. |
|||
| Demographic | 2023 | 2024 | |
|---|---|---|---|
| Number | Number | Percent (%) | |
|
Total |
57 | 33 | 100 |
|
Employee status |
|||
|
Wage and salary workers (1) |
49 | 25 | 76 |
|
Self-employed (2) |
8 | 8 | 24 |
|
Sex |
|||
|
Male |
-- | -- | -- |
|
Female |
-- | -- | -- |
|
Age (3) |
|||
|
Under 16 years |
-- | -- | -- |
|
16 to 17 years |
-- | -- | -- |
|
18 to 19 years |
-- | -- | -- |
|
20 to 24 years |
3 | -- | -- |
|
25 to 34 years |
8 | -- | -- |
|
35 to 44 years |
17 | 5 | 15 |
|
45 to 54 years |
11 | 10 | 30 |
|
55 to 64 years |
6 | 6 | 18 |
|
65 years and over |
10 | 8 | 24 |
|
Race or ethnic origin (4) |
|||
|
White, non-Hispanic |
30 | 20 | 61 |
|
Black or African-American, non-Hispanic |
-- | -- | -- |
|
Hispanic or Latino |
20 | 9 | 27 |
|
American Indian or Alaska Native, non-Hispanic |
-- | -- | -- |
|
Asian, non-Hispanic |
-- | 4 | 12 |
|
Native Hawaiian or Pacific Islander, non-Hispanic |
-- | -- | -- |
|
Person of multiple races, non-Hispanic |
-- | -- | -- |
|
Other or not reported, non-Hispanic |
-- | -- | -- |
|
Footnotes: |
|||
|
Note: The Census of Fatal Occupational Injuries (CFOI) has published data on fatal occupational injuries for the United States since 1992. During this time, the classification systems and definitions of many data elements have changed. See the CFOI Definitions page (www.bls.gov/iif/definitions/census-of-fatal-occupational-injuries-definitions.htm) for a more detailed description of each data element. Data for all years are revised and final. Totals for major categories may include subcategories not shown separately. Dashes indicate no data reported or data that do not meet publication criteria. CFOI fatal injury counts exclude illness-related deaths unless precipitated by an injury event. |
|||
Last Modified Date: Wednesday, April 01, 2026