An official website of the United States government
An official website of the United States government
The .gov means it's official.
Federal government websites often end in .gov or .mil. Before sharing sensitive information,
make sure you're on a federal government site.
The site is secure.
The
https:// ensures that you are connecting to the official website and that any
information you provide is encrypted and transmitted securely.

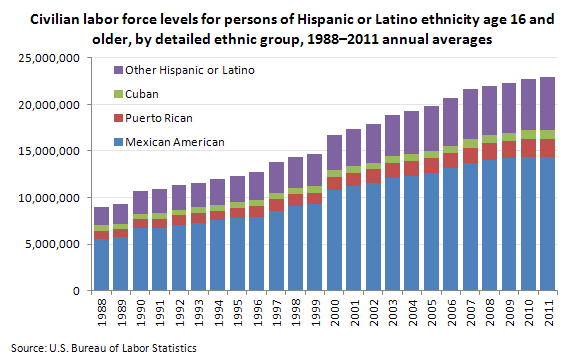
| Year | Other Hispanic or Latino | Cuban | Puerto Rican | Mexican American | Total Hispanic or Latino |
|---|---|---|---|---|---|
1988 | 1,962,000 | 565,000 | 883,000 | 5,572,000 | 8,982,000 |
1989 | 2,132,000 | 562,000 | 889,000 | 5,740,000 | 9,323,000 |
1990 | 2,450,000 | 603,000 | 960,000 | 6,707,000 | 10,720,000 |
1991 | 2,574,000 | 593,000 | 1,041,000 | 6,712,000 | 10,920,000 |
1992 | 2,622,000 | 577,000 | 1,048,000 | 7,091,000 | 11,338,000 |
1993 | 2,652,000 | 604,000 | 1,073,000 | 7,281,000 | 11,610,000 |
1994 | 2,778,000 | 604,000 | 1,026,000 | 7,567,000 | 11,975,000 |
1995 | 2,791,000 | 613,000 | 1,098,000 | 7,765,000 | 12,267,000 |
1996 | 3,024,000 | 637,000 | 1,170,000 | 7,943,000 | 12,774,000 |
1997 | 3,311,000 | 646,000 | 1,293,000 | 8,546,000 | 13,796,000 |
1998 | 3,321,000 | 651,000 | 1,249,000 | 9,096,000 | 14,317,000 |
1999 | 3,415,000 | 714,000 | 1,269,000 | 9,267,000 | 14,665,000 |
2000 | 3,755,000 | 740,000 | 1,411,000 | 10,783,000 | 16,689,000 |
2001 | 3,985,000 | 671,000 | 1,454,000 | 11,218,000 | 17,328,000 |
2002 | 4,220,000 | 635,000 | 1,546,000 | 11,542,000 | 17,943,000 |
2003 | 4,404,000 | 679,000 | 1,649,000 | 12,081,000 | 18,813,000 |
2004 | 4,553,000 | 769,000 | 1,610,000 | 12,340,000 | 19,272,000 |
2005 | 4,779,000 | 755,000 | 1,619,000 | 12,671,000 | 19,824,000 |
2006 | 5,130,000 | 807,000 | 1,599,000 | 13,158,000 | 20,694,000 |
2007 | 5,348,000 | 898,000 | 1,684,000 | 13,672,000 | 21,602,000 |
2008 | 5,296,000 | 897,000 | 1,822,000 | 14,009,000 | 22,024,000 |
2009 | 5,415,000 | 877,000 | 1,850,000 | 14,210,000 | 22,352,000 |
2010 | 5,469,000 | 970,000 | 1,906,000 | 14,403,000 | 22,748,000 |
2011 | 5,669,000 | 976,000 | 1,893,000 | 14,360,000 | 22,898,000 |
Source: Current Population Survey
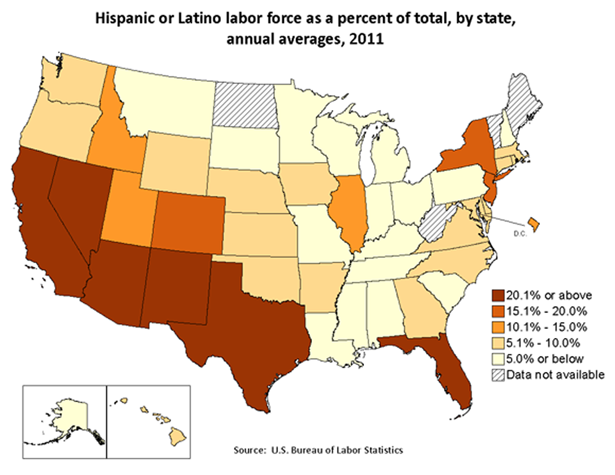
| State | Hispanic or Latino labor force as a percent of total | Total civilian labor force | Hispanic or Latino labor force |
|---|---|---|---|
New Mexico | 42.0 | 927,000 | 389,000 |
Texas | 36.4 | 12,449,000 | 4,527,000 |
California | 35.9 | 18,377,000 | 6,593,000 |
Arizona | 28.6 | 3,021,000 | 863,000 |
Nevada | 23.0 | 1,376,000 | 316,000 |
Florida | 21.2 | 9,293,000 | 1,971,000 |
New Jersey | 19.5 | 4,590,000 | 896,000 |
Colorado | 16.6 | 2,738,000 | 454,000 |
New York | 15.2 | 9,476,000 | 1,444,000 |
Illinois | 13.2 | 6,559,000 | 865,000 |
Idaho | 11.3 | 769,000 | 87,000 |
District of Columbia | 10.9 | 348,000 | 38,000 |
Utah | 10.6 | 1,337,000 | 142,000 |
Connecticut | 10.0 | 1,916,000 | 192,000 |
Rhode Island | 10.0 | 559,000 | 56,000 |
Nebraska | 9.7 | 1,009,000 | 98,000 |
Washington | 8.4 | 3,452,000 | 291,000 |
Georgia | 8.3 | 4,743,000 | 392,000 |
Maryland | 8.1 | 3,090,000 | 251,000 |
Delaware | 8.1 | 446,000 | 36,000 |
Oregon | 7.8 | 2,005,000 | 156,000 |
Massachusetts | 7.6 | 3,458,000 | 263,000 |
North Carolina | 7.6 | 4,631,000 | 350,000 |
Virginia | 7.4 | 4,229,000 | 315,000 |
Hawaii | 7.3 | 668,000 | 49,000 |
Wyoming | 7.1 | 308,000 | 22,000 |
Kansas | 7.1 | 1,500,000 | 106,000 |
Oklahoma | 5.8 | 1,768,000 | 102,000 |
Arkansas | 5.6 | 1,364,000 | 76,000 |
Iowa | 5.1 | 1,667,000 | 85,000 |
Wisconsin | 5.0 | 3,089,000 | 155,000 |
Pennsylvania | 4.7 | 6,395,000 | 300,000 |
Alaska | 4.3 | 370,000 | 16,000 |
Indiana | 4.2 | 3,201,000 | 136,000 |
Minnesota | 4.0 | 2,954,000 | 119,000 |
Louisiana | 3.9 | 2,054,000 | 81,000 |
Michigan | 3.9 | 4,658,000 | 180,000 |
South Carolina | 3.7 | 2,167,000 | 81,000 |
Tennessee | 3.5 | 3,142,000 | 110,000 |
Kentucky | 3.4 | 2,055,000 | 69,000 |
Missouri | 3.1 | 3,070,000 | 95,000 |
Alabama | 3.0 | 2,224,000 | 67,000 |
Ohio | 2.9 | 5,765,000 | 166,000 |
South Dakota | 2.5 | 443,000 | 11,000 |
Mississippi | 2.3 | 1,348,000 | 31,000 |
Montana | 2.0 | 503,000 | 10,000 |
New Hampshire | 1.9 | 737,000 | 14,000 |
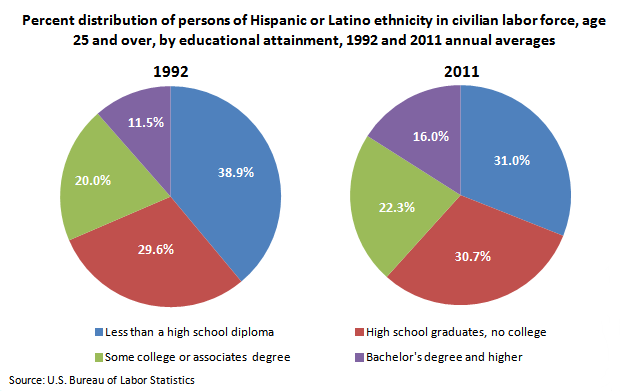
| Year | Less than a high school diploma | High school graduates, no college | Some college or associates degree | Bachelor's degree and higher |
|---|---|---|---|---|
1992 | 38.9 | 29.6 | 20.0 | 11.5 |
2011 | 31.0 | 30.7 | 22.3 | 16.0 |
Source: Current Population Survey
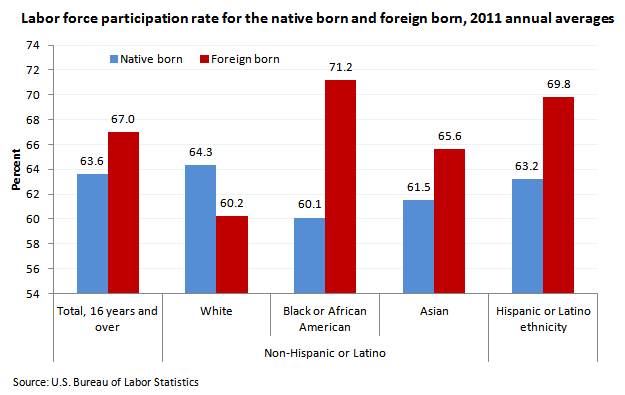
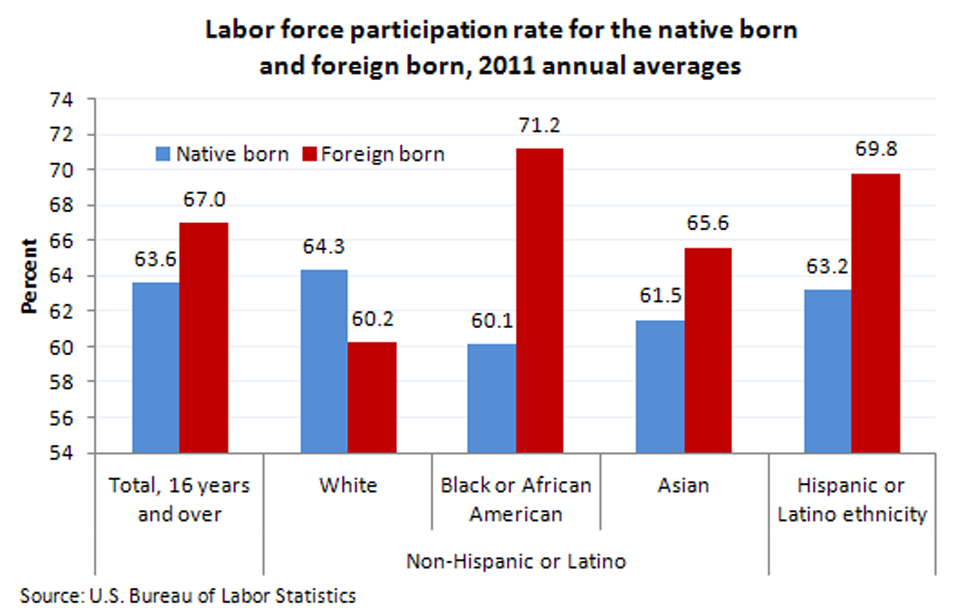
| Race or ethnicity | Native born | Foreign born |
|---|---|---|
Total, 16 years and over | 63.6 | 67.0 |
Non-Hispanic or Latino | ||
White | 64.3 | 60.2 |
Black or African American | 60.1 | 71.2 |
Asian | 61.5 | 65.6 |
Hispanic or Latino ethnicity | 63.2 | 69.8 |
Source: Current Population Survey
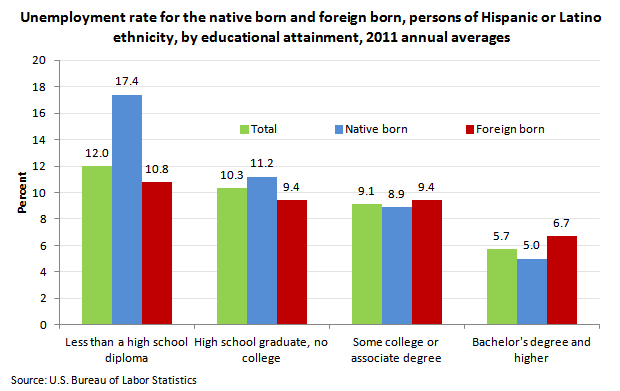
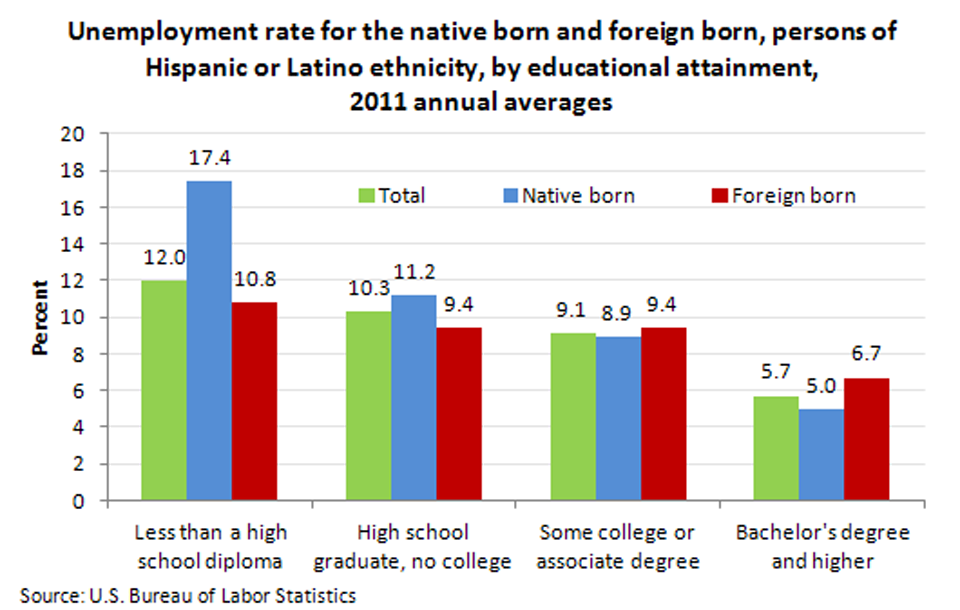
| Education | Total | Native born | Foreign born |
|---|---|---|---|
Less than a high school diploma | 12.0 | 17.4 | 10.8 |
High school graduate, no college | 10.3 | 11.2 | 9.4 |
Some college or associate degree | 9.1 | 8.9 | 9.4 |
Bachelor's degree and higher | 5.7 | 5.0 | 6.7 |
Source: Current Population Survey
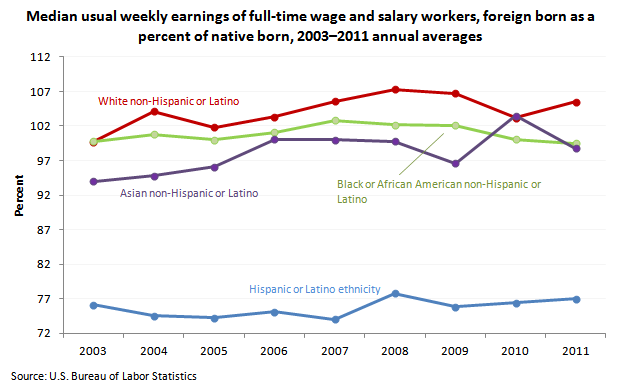
| Year | Hispanic or Latino ethnicity | Non-Hispanic or Latino | ||
|---|---|---|---|---|
| White | Black | Asian | ||
2003 | 76.1 | 99.7 | 99.8 | 94.0 |
2004 | 74.5 | 104.1 | 100.8 | 94.8 |
2005 | 74.2 | 101.8 | 100.0 | 96.1 |
2006 | 75.1 | 103.3 | 101.1 | 100.1 |
2007 | 74.0 | 105.6 | 102.8 | 100 |
2008 | 77.8 | 107.3 | 102.2 | 99.8 |
2009 | 75.8 | 106.7 | 102.1 | 96.6 |
2010 | 76.4 | 103.2 | 100.1 | 103.5 |
2011 | 77.0 | 105.5 | 99.5 | 98.8 |
Source: Current Population Survey
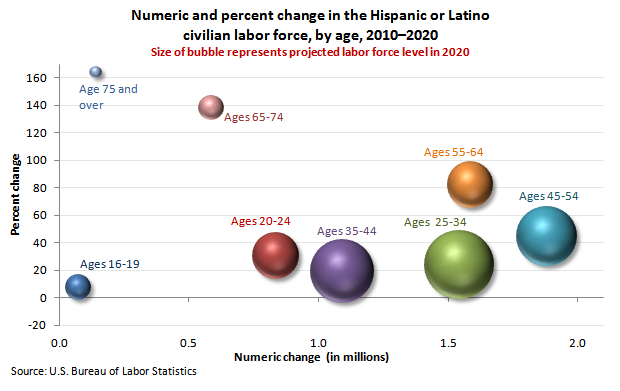
| Age | Numeric change | Percent change | Projected labor force level in 2020 |
|---|---|---|---|
16 to 19 | 74,308 | 7.4 | 1,076,308 |
20 to 24 | 835,287 | 30.3 | 3,595,287 |
25 to 34 | 1,543,380 | 23.7 | 8,060,380 |
35 to 44 | 1,092,960 | 18.9 | 6,875,960 |
45 to 54 | 1,881,734 | 44.4 | 6,119,734 |
55 to 64 | 1,587,010 | 82.0 | 3,523,010 |
65 to 74 | 587,136 | 137.8 | 1,013,136 |
75 and over | 142,500 | 163.8 | 229,500 |
Source: Employment Projections
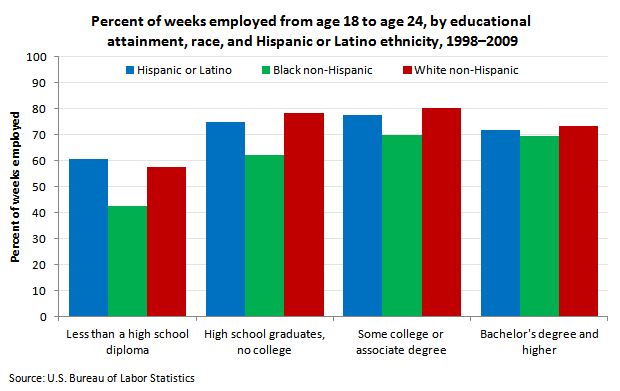
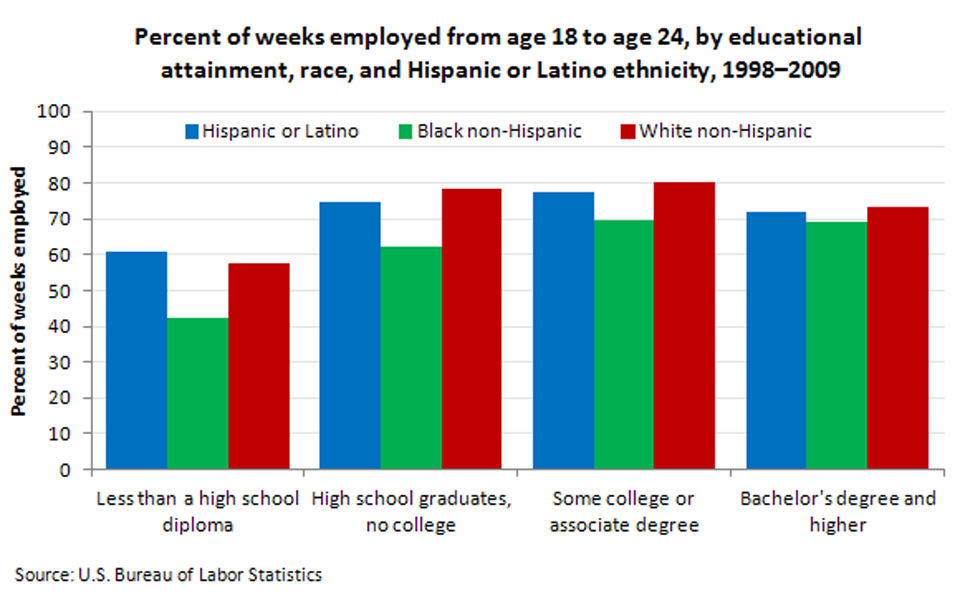
| Educational attainment | Hispanic or Latino | Black non-Hispanic | White non-Hispanic |
|---|---|---|---|
Less than a high school diploma | 60.7 | 42.4 | 57.6 |
High school graduates, no college | 74.7 | 62.3 | 78.5 |
Some college or associate degree | 77.5 | 69.8 | 80.2 |
Bachelor's degree and higher | 71.7 | 69.3 | 73.5 |
Source: National Longitudinal Surveys
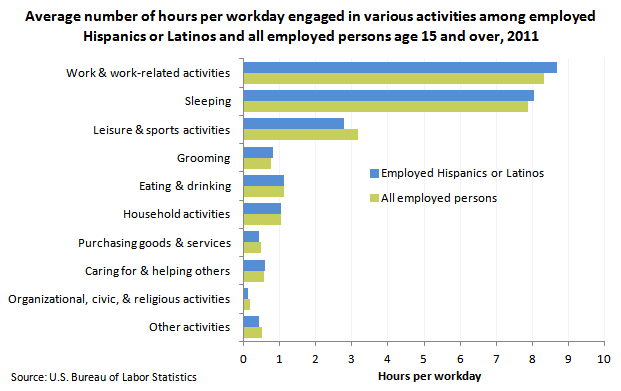
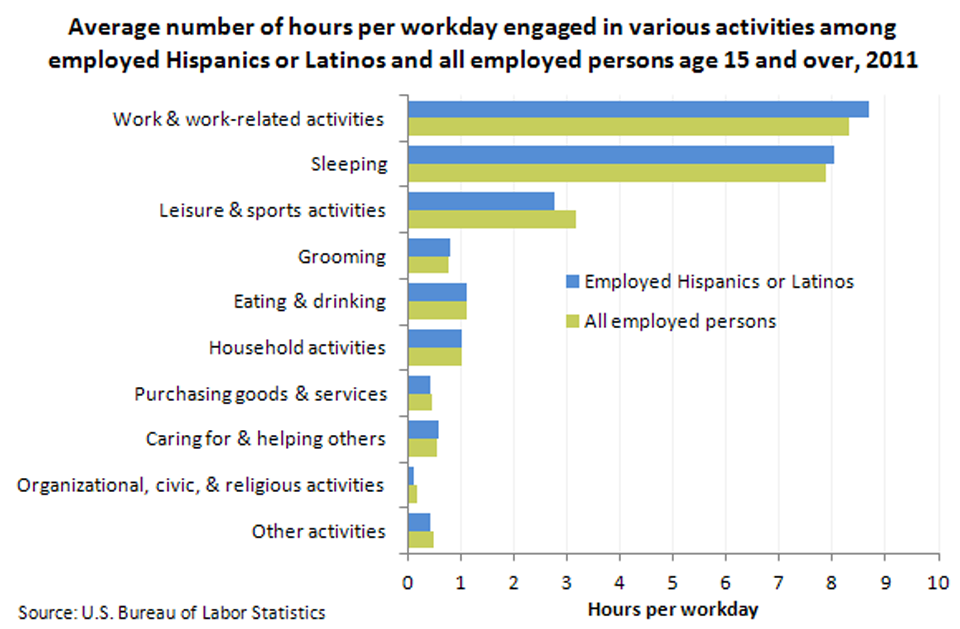
| Activity | Employed Hispanics or Latinos | All employed persons |
|---|---|---|
Work & work-related activities | 8.68 | 8.32 |
Sleeping | 8.05 | 7.87 |
Leisure & sports activities | 2.77 | 3.18 |
Grooming | 0.81 | 0.77 |
Eating & drinking | 1.12 | 1.12 |
Household activities | 1.03 | 1.04 |
Purchasing goods & services | 0.42 | 0.47 |
Caring for & helping others | 0.58 | 0.56 |
Organizational, civic, & religious activities | 0.12 | 0.17 |
Other activities | 0.42 | 0.50 |
Source: American Time Use Survey
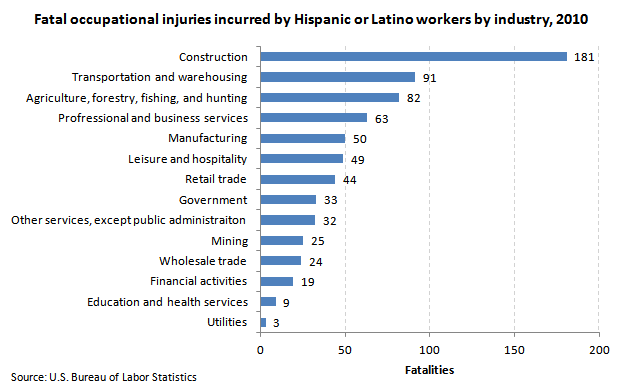
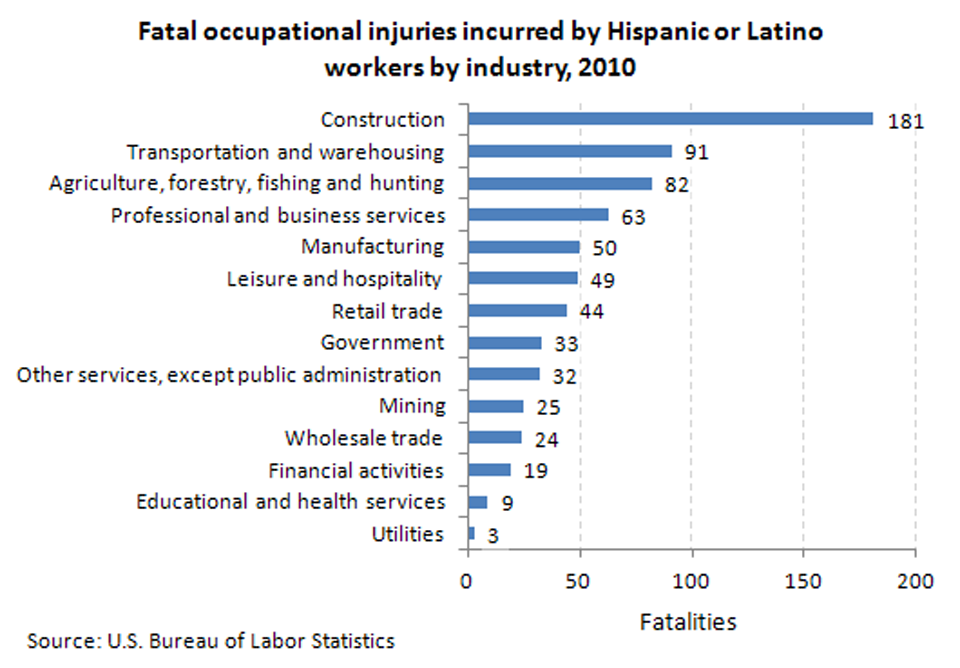
| Industry | Fatalities |
|---|---|
|
Construction |
181 |
|
Transportation and warehousing |
91 |
|
Agriculture, forestry, fishing, and hunting |
82 |
|
Professional and business services |
63 |
|
Manufacturing |
50 |
|
Leisure and hospitality |
49 |
|
Retail trade |
44 |
|
Government |
33 |
|
Other services, except public administraiton |
32 |
|
Mining |
25 |
|
Wholesale trade |
24 |
|
Financial activities |
19 |
|
Education and health services |
9 |
|
Utilities |
3 |
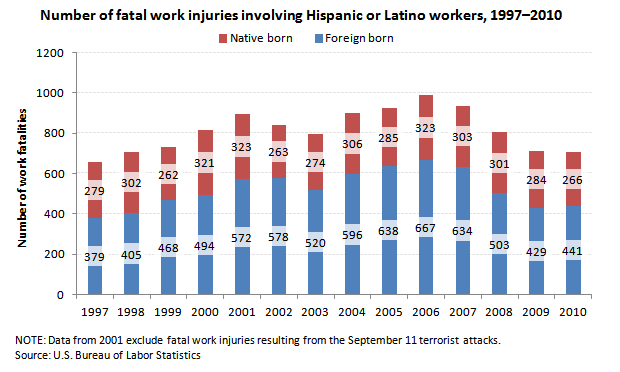
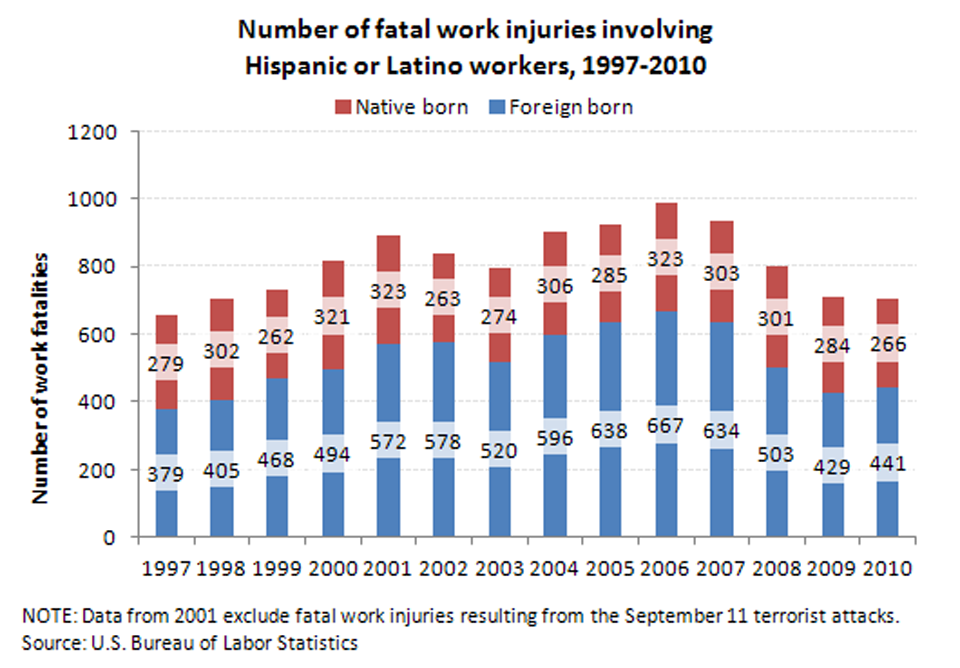
| Year | Foreign born | Native born |
|---|---|---|
1997 | 379 | 279 |
1998 | 405 | 302 |
1999 | 468 | 262 |
2000 | 494 | 321 |
2001 | 572 | 323 |
2002 | 578 | 263 |
2003 | 520 | 274 |
2004 | 596 | 306 |
2005 | 638 | 285 |
2006 | 667 | 323 |
2007 | 634 | 303 |
2008 | 503 | 301 |
2009 | 429 | 284 |
2010 | 441 | 266 |