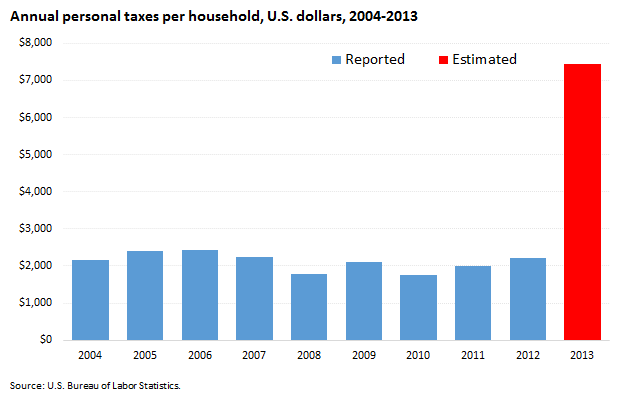
Annual income and personal taxes per household by income group, U.S. dollars, 2013
| Measure |
Lowest 20 percent |
Second 20 percent |
Third 20 percent |
Fourth 20 percent |
Highest 20 percent |
|
Income before taxes
|
$9,658 |
$26,275 |
$45,826 |
$74,546 |
$162,720 |
|
Personal taxes
|
-434 |
-489 |
2,233 |
7,203 |
28,676 |
Households in the top 20 percent of income pay more income taxes than the other 80 percent
A household may include a family, a single consumer, or a group of individuals who share one budget. We divide households into five equally sized groups arranged from lowest to highest according to their pretax income.
In 2013, households with the highest 20 percent of income earned more than the other 80 percent of households combined. The households with the highest income also paid more personal taxes than households in the other four income groups combined. In contrast, households in the lowest two income groups received more tax credits than they paid in personal taxes. (Tax credits are money that taxpayers can subtract from any taxes they owe.)
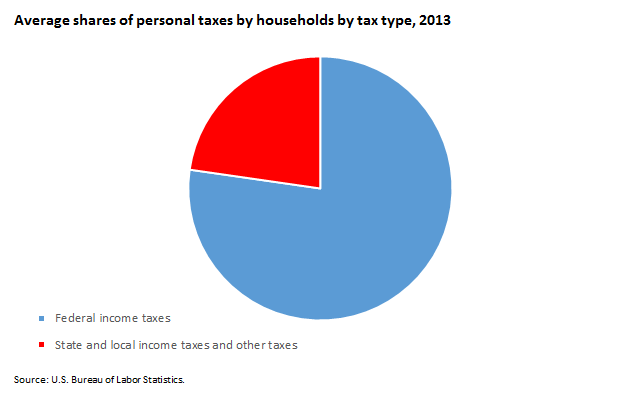
Average shares of personal taxes by households by tax type
| Tax Type |
Average |
|
Federal income taxes
|
$5,743 |
|
State and local income taxes and other taxes
|
1689 |
Federal income taxes account for 77 percent of all personal taxes
Federal income taxes accounted for 77.3 percent of all personal taxes that households paid in 2013. Federal income taxes averaged more than $5,700 per household. The remaining 22.7 percent of personal taxes that households paid include state and local income taxes, personal property taxes, vehicle taxes, and other small taxes and refunds.
Data shown here do not include state and local sales taxes, which are paid by residents in most states and are a major share of state and local government revenue.
Personal taxes by tax type and income group, U.S. dollars, 2013
| Tax Type |
Income group |
Average |
| Lowest 20 percent |
Second 20 percent |
Third 20 percent |
Fourth 20 percent |
Highest 20 percent |
|
Federal income taxes
|
-$396 |
-$663 |
$1,447 |
$5,362 |
$22,990 |
$5,743 |
|
State and local income taxes and other taxes
|
-38 |
174 |
787 |
1,841 |
5,685 |
1689 |
Households in highest income group paid an average of $29,000 in personal taxes
Households with the highest 20 percent of income paid about three quarters of personal taxes, almost $29,000 per household in 2013. Of that total, 80.2 percent was for federal income taxes.
Households in the third, or middle, income group paid slightly more than $2,200 in personal taxes in 2013; 64.8 percent of that amount was for federal income taxes.
Households in the two lowest income groups received more in tax credits than they paid in personal taxes. These tax credits came mainly from federal tax credits.
Savings rate by income group, 2013
| Year |
Income group |
Average |
| Lowest 20 percent |
Second 20 percent |
Third 20 percent |
Fourth 20 percent |
Highest 20 percent |
|
2013
|
-123.2 |
-21.8 |
2.5 |
12.5 |
26.0 |
9.3 |
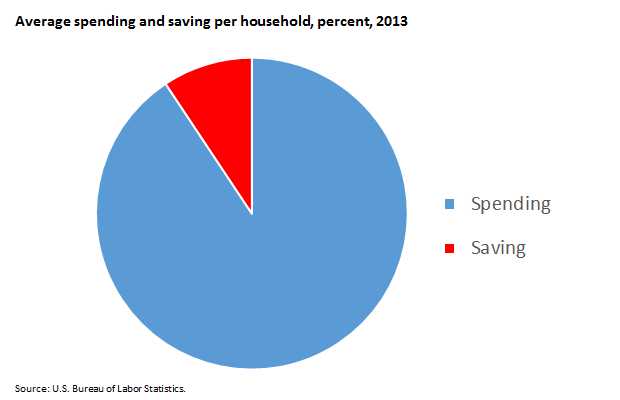
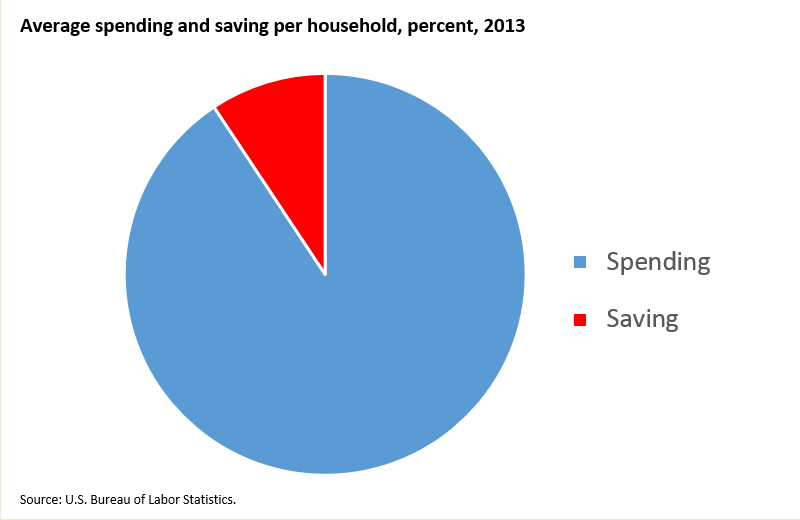
The lowest two income groups spent more than their income
Savings rates differed significantly across the five income groups. Households in the highest income group saved 26.0 percent of their after-tax income in 2013. The next-highest income group saved 12.5 percent of their after-tax income. The middle income group saved 2.5 percent.
The two lowest income groups did not save. In fact, they spent more than their income; households with the lowest income had a savings rate of -123.2 percent. Households can spend more than their income by taking on debt. Even without any debt, some households can draw on funds that the survey does not count as income, such as savings and personal retirement accounts.
More information
Aaron E. Cobet is a senior economist in the Division of Consumer Expenditure Surveys, U.S. Bureau of Labor Statistics. You can contact him at Cobet.Aaron@bls.gov.
The Consumer Expenditure Survey annually conducts about 28,000 interview surveys and 14,000 diary surveys. The survey asks questions about income, spending, and demographic information. The Consumer Expenditure Survey provides estimates of personal taxes. These taxes include federal and state income taxes and other taxes. Other taxes consist of personal property taxes, vehicle taxes, and additional small taxes and refunds. The personal taxes do not include sales taxes and Social Security taxes. For 2013, the income tax data for more than 90 percent of the households were estimated using a program called TAXSIM, developed by the National Bureau of Economic Research. Tax information for the remaining households is still based on survey questions.
The TAXSIM program estimates federal, state, and local income taxes using sources of income and household characteristics reported in the Consumer Expenditure Survey. The survey staff uses four main steps to estimate income taxes. First, the staff divides households into tax units, which are families or individuals who prepare their own tax returns. Second, the staff prepares the income data for each tax unit. Third, the staff runs TAXSIM to estimate tax liabilities for tax units. Fourth, the staff sums taxes for tax units into taxes for households. For more information about how the program estimates taxes, see "TAXSIM Related files at the NBER."
In this Spotlight, households have been divided into five equally sized groups arranged from lowest to highest pretax income. For 2013, the lowest income group consists of households reporting a pretax income below $17,883; the second group a pretax income from $17,884 to $34,957; the third group a pretax income from $34,958 to $57,967; the fourth group a pretax income from $57,988 to $95,335; and the highest group a pretax income above $95,336.
Income thresholds for five income groups
| Group |
Lowest |
Second |
Third |
Fourth |
Highest |
| Income |
Below $17,883 |
$17,884 to $34,957 |
$34,958 to $57,967 |
$57,988 to $95,335 |
Above $95,336 |
BLS calculates an income group’s share of all personal taxes as the total personal taxes of the income group divided by the total personal taxes of all income groups. The average tax share differs from the marginal tax rate. The average tax share typically is lower than the marginal tax rate because the marginal tax rate is the rate paid on the last dollar earned. Tax shares are total taxes divided by the total income before taxes. Savings shares are savings divided by total income after taxes. We define savings here as after-tax income taxes minus total spending for goods and services. Contributions to personal pensions are counted as spending rather than savings.
For more information about the improvements in tax data from the Consumer Expenditure Survey, see the Monthly Labor Review article “Estimating Taxes in the Consumer Expenditure Survey” by Geoffrey Paulin and William Hawk.