
An official website of the United States government
An official website of the United States government
The .gov means it's official.
Federal government websites often end in .gov or .mil. Before sharing sensitive information,
make sure you're on a federal government site.
The site is secure.
The
https:// ensures that you are connecting to the official website and that any
information you provide is encrypted and transmitted securely.
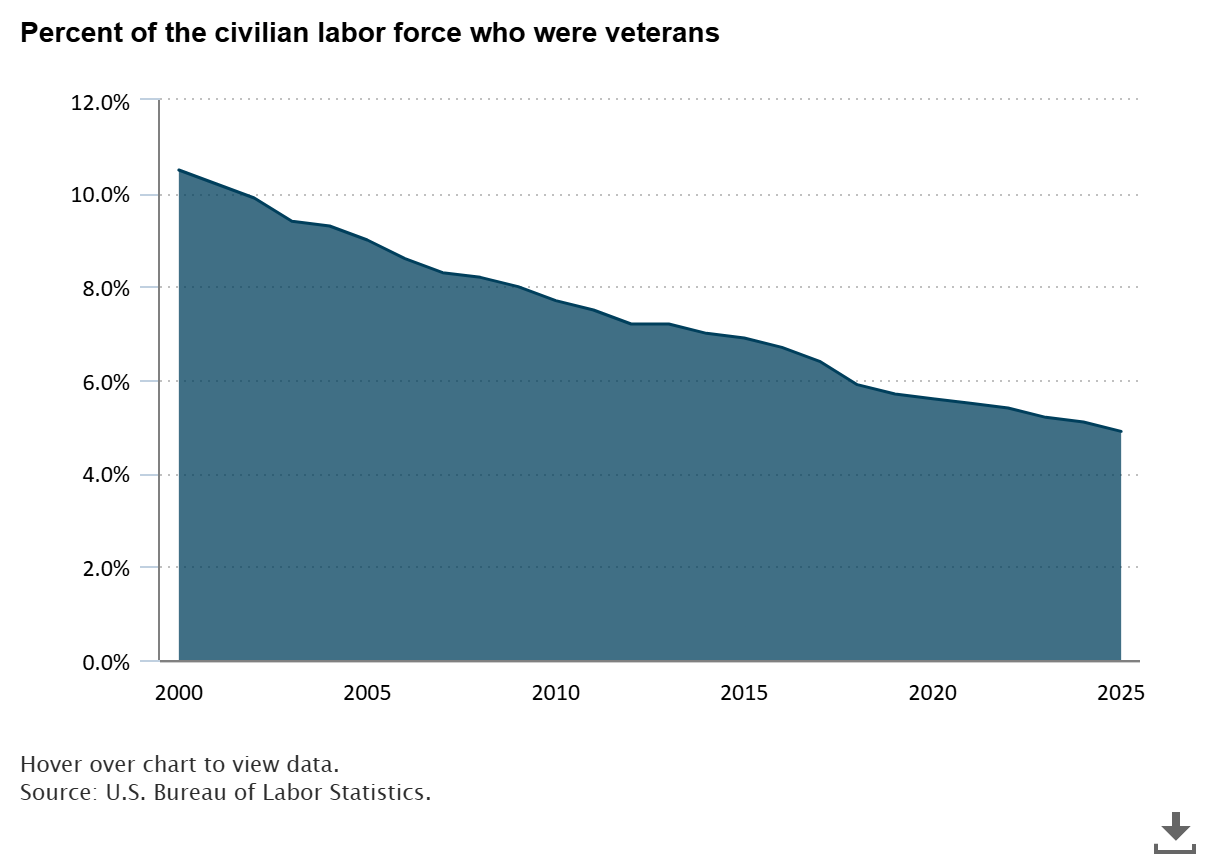
In 2025, there were 168.5 million people age 18 and over in the civilian labor force. Of those, 4.9 percent (8.3 million) were military veterans.
read full article »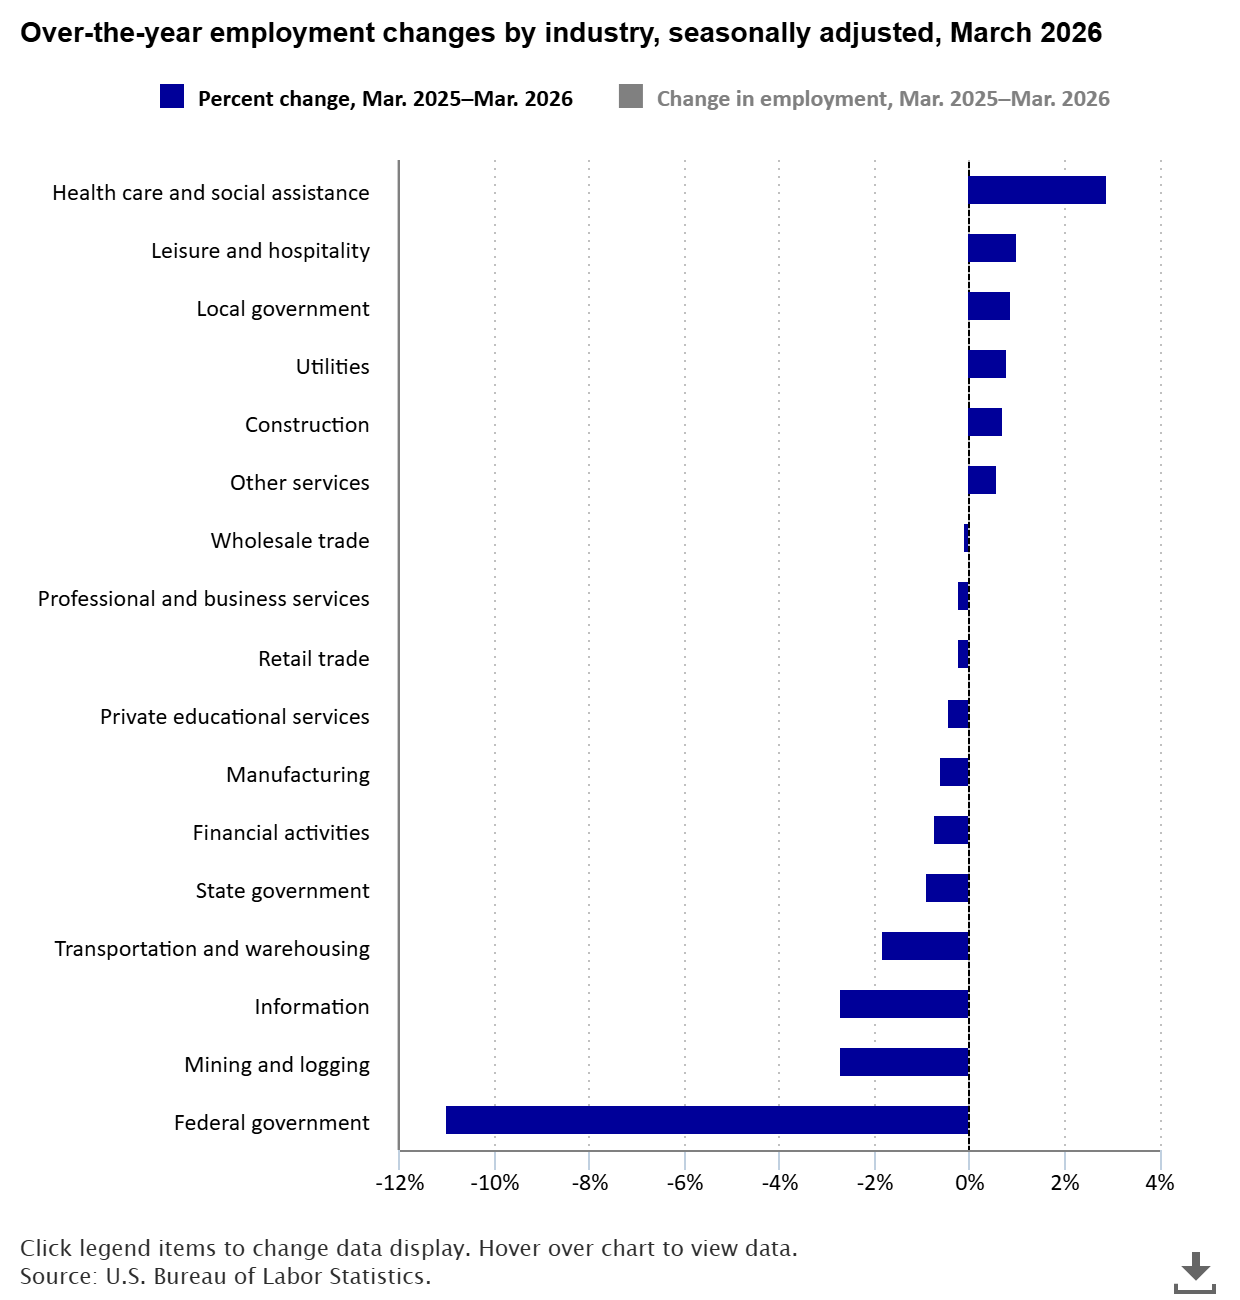
Total nonfarm payroll employment changed little on net over the year ended March 2026. Health care and social assistance employment increased by 2.9 percent, or 680,500 jobs, from March 2025 to March 2026. Leisure and hospitality employment increased by 1.0 percent, or 176,000, over the year. Employment in local government increased by 0.9 percent, or 135,000.
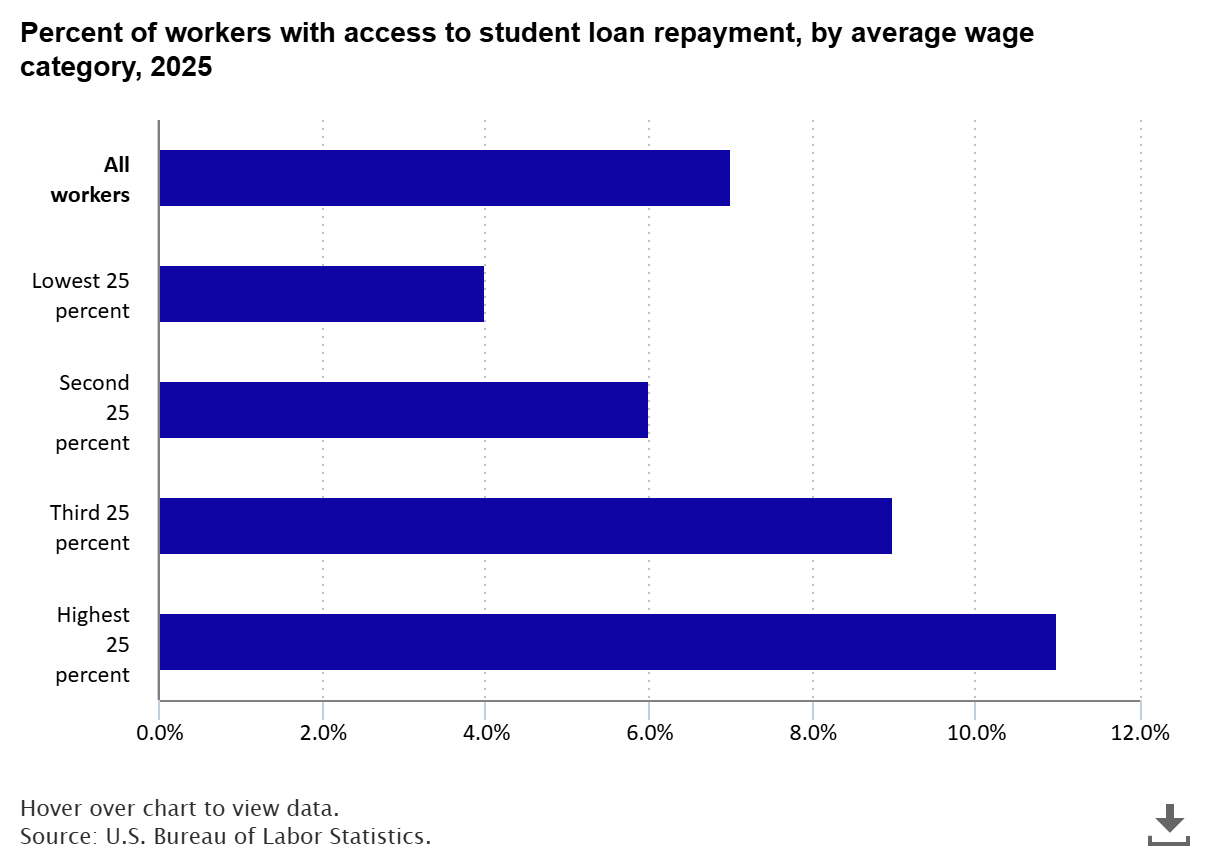
Access to student loan repayment was available to 7 percent of civilian workers in 2025. When workers were classified by wage category, just 4 percent of those in the lowest 25 percent of earnings had student loan repayment benefits available.
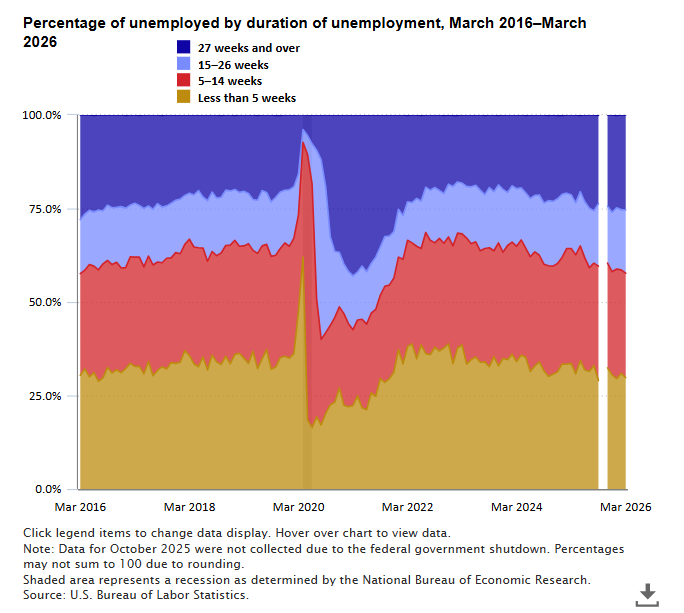
In March 2026, short-term unemployment, defined as the number of people unemployed for less than 5 weeks, was 2.1 million, or 29.8 percent of all unemployed people. A year earlier, in March 2025, there were 2.4 million people unemployed less than 5 weeks, accounting for 33.6 percent of the unemployed.
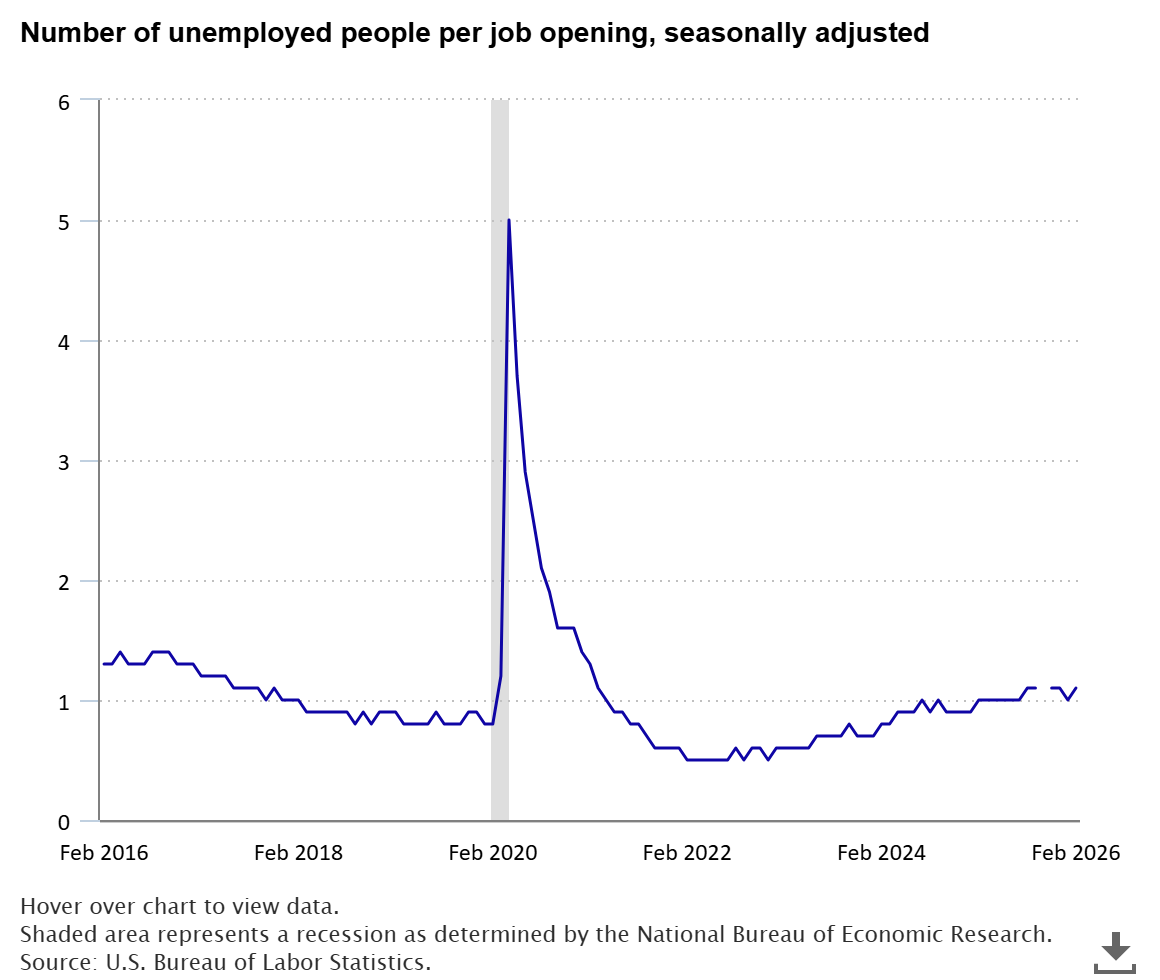
There were 7.6 million unemployed people in February 2026 and, on the last business day, 6.9 million job openings. This yielded a ratio of 1.1 unemployed people per job opening. The ratio has been 1.0 or 1.1 since February 2025 (unemployment data were not collected in October 2025 due to the federal government shutdown).
