
The Local Area Unemployment Statistics program publishes monthly and yearly estimates of unemployment and the labor force for about 7,000 areas:
- States
- Counties and county equivalents
- Metropolitan areas
- Cities with 25,000+ population
If you’re looking for local unemployment data, we’ve got you covered!
State Unemployment Rates
This map shows the 2017 unemployment rates for all states (The lighter the color, the better!)
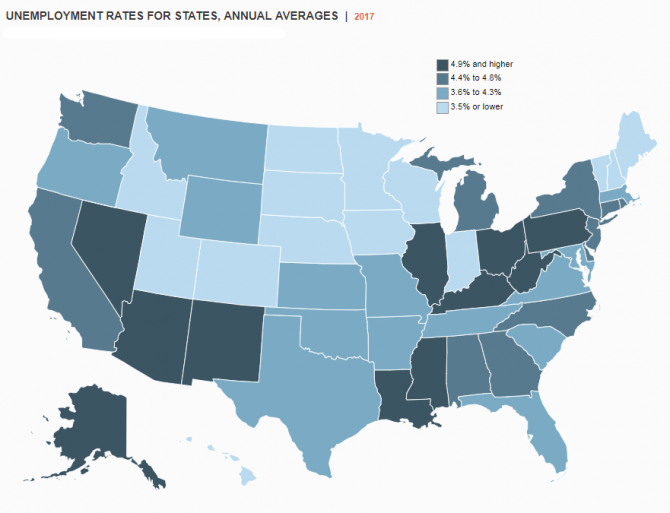
How do states compare with the 2017 national unemployment rate of 4.4 percent?
- Hawaii and North Dakota had the lowest unemployment rates, 2.4 percent and 2.6 percent, respectively.
- Alaska had the highest unemployment rate, 7.2 percent.
- Seven states recorded the lowest annual unemployment rates since the series began in 1976: Arkansas (3.7 percent), California (4.8 percent), Hawaii (2.4 percent), Maine (3.3 percent), North Dakota (2.6 percent), Oregon (4.1 percent), and Tennessee (3.7 percent).
To learn more, table 1 in the Regional and State Unemployment — 2017 Annual Averages news release provides the unemployment rate for each state.
State Employment–Population Ratios
Another interesting piece of information is the employment–population ratio, which answers the question: “What percent of the population age 16 and older is employed?”
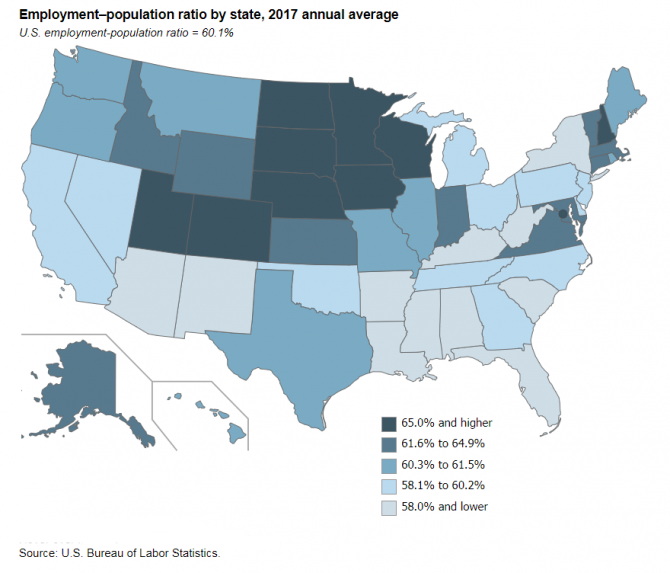
The national employment–population ratio in 2017 was 60.1 percent. The employment–population ratio continues to climb from its recessionary low of 58.4 percent in 2011. Here are some 2017 state highlights:
- North Dakota had the highest proportion of employed people, 69.6 percent. The next highest ratios were in Minnesota, 67.8 percent, and Utah, 67.2 percent.
- West Virginia had the lowest employment–population ratio among the states, 50.5 percent.
To learn more, table 2 in the Regional and State Unemployment — 2017 Annual Averages news release provides the employment–population ratios by state.
County Unemployment Rates
What if you want to do a deep dive to find out about unemployment in the counties in your state? That’s easy to do, too. You can create your state map showing the current unemployment rates for all your counties in less than a minute by following these instructions:
Mapping Unemployment Rates (States and Counties) -> Counties tab -> Select a state from the dropdown -> Select unemployment data and time period -> Hit draw map.
That’s it! Below the map is a chart with the county data listed in alphabetical order. For comparison purposes, you may want to pick up the state unemployment rate from the state tab. Be sure to choose the not seasonally adjusted data, since the county data are not seasonally adjusted.
We have a webpage where you can get annual data for all counties for 2017 and earlier years.
How does BLS get all of this great data?
Unlike many of our other statistical programs, the Local Area Unemployment Statistics program is not a survey. Instead, the program uses survey and administrative data from multiple sources to produce its estimates, including:
- Current Population Survey
- Current Employment Statistics program
- Quarterly Census of Employment and Wages
- State unemployment insurance programs
- American Community Survey and Population Estimates Program of the U.S. Census Bureau
We have a short summary of the estimation methods. We also have a longer description (including formulas!) in our Handbook of Methods.
What is the relationship between local information and the national unemployment rate?
We use the same definitions for our local estimates as we do for the national unemployment rate, which we get from the Current Population Survey. Through a feature known as real-time benchmarking, the local data are controlled to the national totals each month to make the data comparable.
Video: Understanding BLS Unemployment Statistics
Why should I care about local data anyway?
We’re glad you asked! As you can see, individual states and areas can have very different economic conditions than the country as a whole. Local labor force measures provide critical information for states and areas that can help local leaders, communities, and businesses make better economic decisions. The local unemployment estimates also are used by 25 federal programs across 9 departments and independent agencies.
- Most programs use the data to help determine how to spread funds to communities across the country.
- Some programs use the data to determine funding eligibility.
- See the Administrative Uses of Local Area Unemployment Statistics for the full list of federal uses of local unemployment data.
Finally, check out the most recent monthly state and metropolitan area news releases to get all the latest numbers. Like maps and graphics? See our series of graphics for the most recent unemployment data for states and metropolitan areas. Head to our Frequently Asked Questions to learn more.
Have more questions? Contact the information folks at (202) 691-6392 or by email. You also can contact the offices on our State Labor Market Information Contact List.