An official website of the United States government
An official website of the United States government
The .gov means it's official.
Federal government websites often end in .gov or .mil. Before sharing sensitive information,
make sure you're on a federal government site.
The site is secure.
The
https:// ensures that you are connecting to the official website and that any
information you provide is encrypted and transmitted securely.
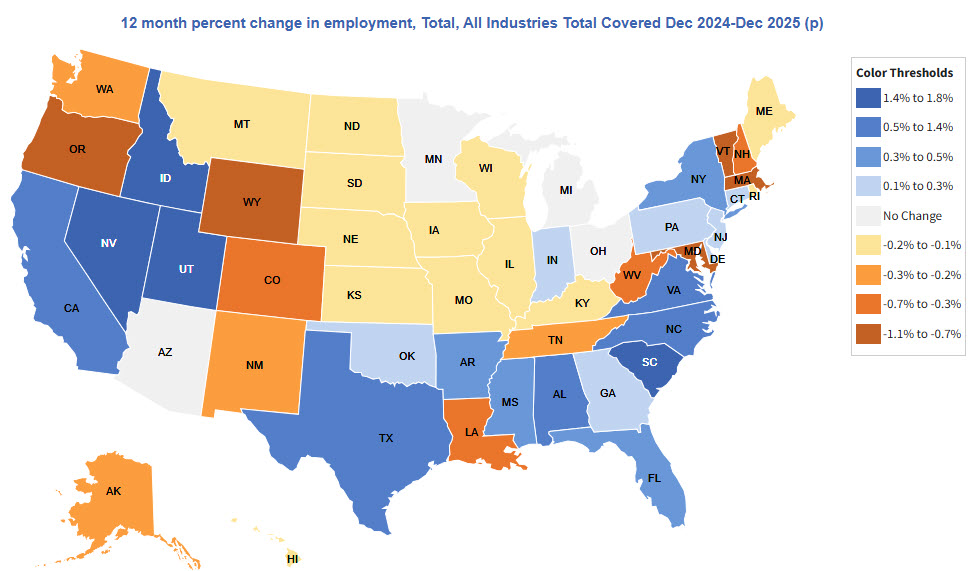
The Quarterly Census of Employment and Wages (QCEW) program publishes a quarterly count of employment and wages reported by employers covering more than 95 percent of U.S. jobs, available at the county, MSA, state and national levels by industry.
Percent change in employment, average weekly wages, and establishments in 10 largest counties, total covered employment, December 2024 to December 2025
County
Percent change in employment
Percent change in establishments
Percent change in average weekly wages
Los Angeles, CA
0.6%
4.6%
3.6%
Cook, IL
0.6%
0.0%
3.2%
New York, NY
0.6%
0.4%
5.8%
Harris, TX
-0.3%
-1.1%
4.7%
Maricopa, AZ
0.1%
-0.9%
2.4%
Dallas, TX
0.2%
-1.3%
4.1%
Orange, CA
1.0%
5.7%
4.1%
San Diego, CA
0.4%
4.9%
2.8%
King, WA
-1.4%
-0.9%
-0.3%
Miami-Dade, FL
0.6%
1.6%
5.1%
U.S. TOTAL
+0.2%(p) since Dec 2024
![]()
Los Angeles County, California
+0.6%(p) since Dec 2024
![]()
Cook County, Illinois
+0.6%(p) since Dec 2024
![]()
New York County, New York
+0.6%(p) since Dec 2024
![]()
Harris County, Texas
-0.3%(p) since Dec 2024
![]()
Maricopa County, Arizona
+0.1%(p) since Dec 2024
![]()
Dallas County, Texas
+0.2%(p) since Dec 2024
![]()
Orange County, California
+1.0%(p) since Dec 2024
![]()
San Diego County, California
+0.4%(p) since Dec 2024
![]()
King County, Washington
-1.4%(p) since Dec 2024
![]()
Miami-Dade County, Florida
+0.6%(p) since Dec 2024
![]()
U.S. TOTAL
+4.2%(p) since 4th Qtr of 2024
![]()
Los Angeles County, California
+3.6%(p) since 4th Qtr of 2024
![]()
Cook County, Illinois
+3.2%(p) since 4th Qtr of 2024
![]()
New York County, New York
+5.8%(p) since 4th Qtr of 2024
![]()
Harris County, Texas
+4.7%(p) since 4th Qtr of 2024
![]()
Maricopa County, Arizona
+2.4%(p) since 4th Qtr of 2024
![]()
Dallas County, Texas
+4.1%(p) since 4th Qtr of 2024
![]()
Orange County, California
+4.1%(p) since 4th Qtr of 2024
![]()
San Diego County, California
+2.8%(p) since 4th Qtr of 2024
![]()
King County, Washington
-0.3%(p) since 4th Qtr of 2024
![]()
Miami-Dade County, Florida
+5.1%(p) since 4th Qtr of 2024
![]()
06/02/2026
From fourth quarter 2024 to fourth quarter 2025, San Mateo, CA, had the largest county percentage increase in average weekly wages at 11.1 percent. Buncombe, NC, had the largest county over-the-year percentage increase in employment in December 2025 at 3.7 percent.
HTML
|
PDF
|
RSS
|
Charts
03/05/2025
BLS updated the full Quarterly Census of Employment and Wages (QCEW) database through the third quarter of 2024. Links to updated databases, files, and tables can be found at www.bls.gov/web/cewdat.supp.toc.htm.
HTML
|
PDF
|
RSS
|
Charts
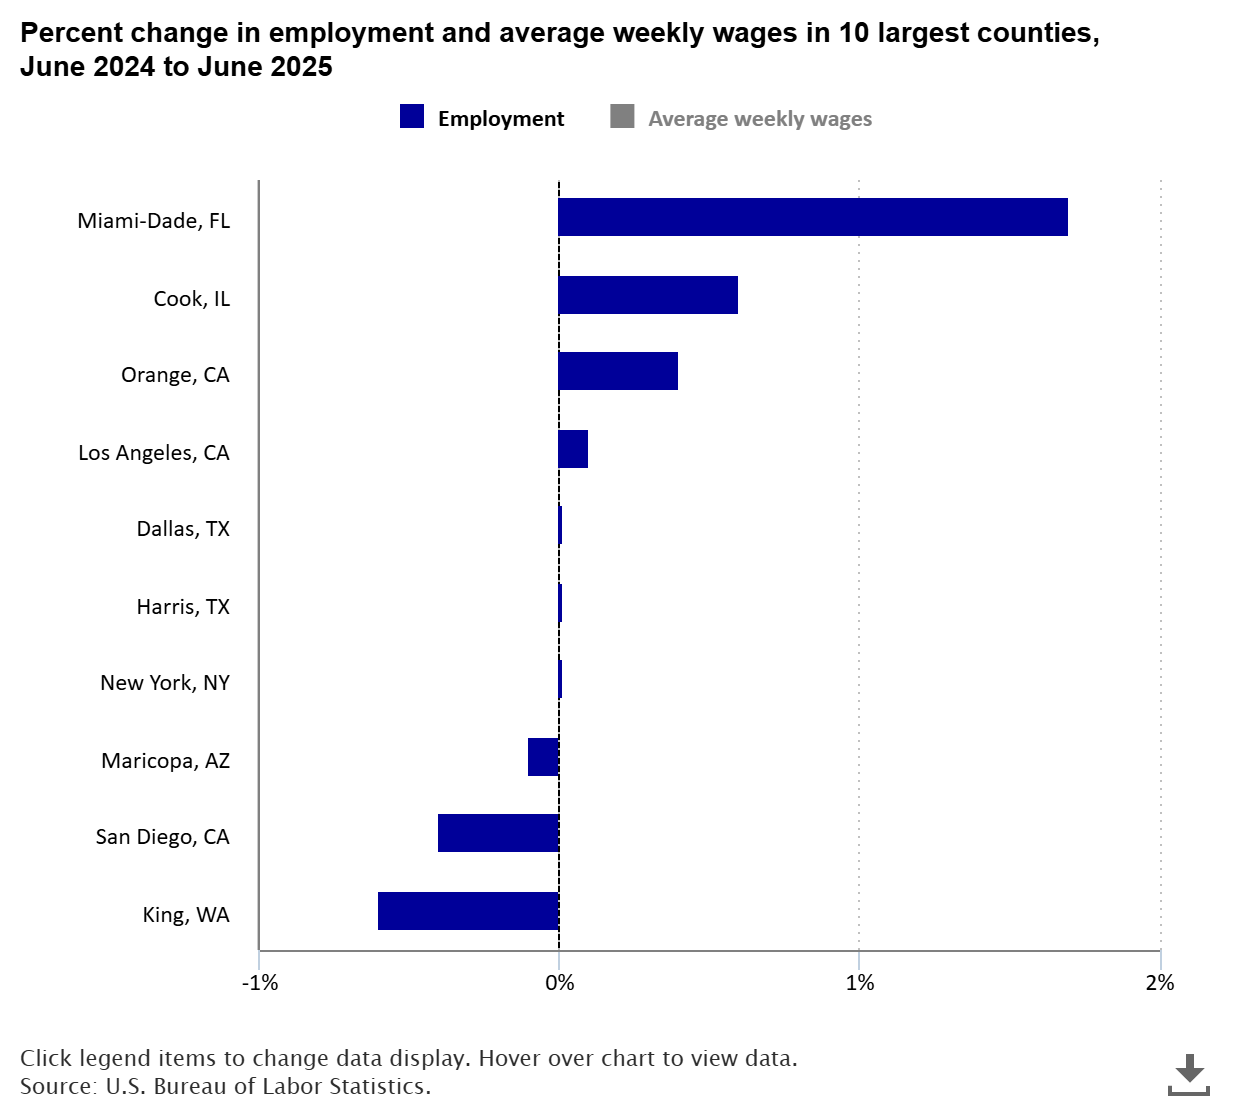
Employment grew 1.7 percent in Miami-Dade, Florida, from June 2024 to June 2025, the highest percentage growth among the 10 largest U.S. counties. In Cook, Illinois (part of the Chicago area) employment increased 0.6 percent, while in Orange, California (Los Angeles area), employment increased by 0.4 percent. read more »
Click a state on the map for economic summaries produced by BLS Regional Information Offices.