
In May 2020, we announced a new research index designed to improve the way we measure consumer price changes for new vehicles. Part of the Consumer Price Index (CPI) program, the research index uses transaction data on vehicle purchases. BLS obtains the data from J.D. Power. After carefully studying the data, we now plan to implement the new data source into the official CPI, effective with the April 2022 release, which we will publish on May 11, 2022. We also will update Measuring Price Change in the CPI: New vehicles factsheet at that time.
The research index departs from the traditional survey methods and data sources we have used in the CPI. The traditional methods sample vehicle dealers and the makes, models, and features of the vehicles they sell. That’s why we took a very deliberate approach before we incorporated the new data into the official CPI. We discuss details of our methods and research in “A New Vehicles Transaction Price Index: Offsetting the Effects of Price Discrimination and Product Cycle Bias with a Year-Over-Year Index.”
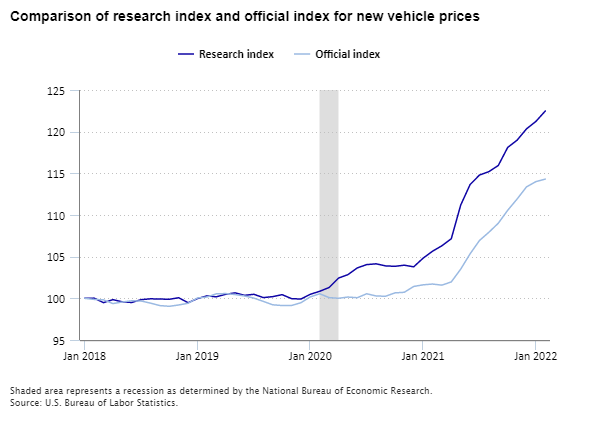
Leading up to March 2020, the movements of the research index for new vehicles were similar to the official index for new vehicles. Since March 2020, the indexes began to diverge, with the research index showing faster price increases that the official index did not reflect.
Editor’s note: Data for this chart are available in the table below.
Since the COVID-19 pandemic began in March 2020, the economy experienced significant disruption. This is especially true of the automobile industry, which saw fluctuations in the supply chain, employment, and consumer demand. Combining these shifts in the economy with the changes in methods represented by the research index made it challenging to assess our results.
While the research index and the official new vehicles index maintained similar trends, the recent divergence between them provided an opportunity to assess the robustness of the two approaches.
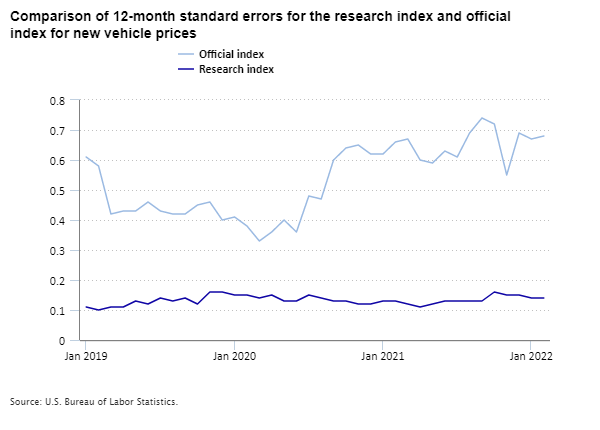
We weighed several factors in deciding whether to incorporate the J.D Power data on new vehicle prices into the official CPI. The new data include records of the prices paid during hundreds of thousands of transactions each month. That dwarfs the roughly 500 prices collected using traditional CPI methods. The larger dataset allows us to estimate price changes more precisely. As a result, the research index has a much lower standard error than the official new vehicles index.
Editor’s note: Data for this chart are available in the table below.
Because the research data reflect actual transactions, the shift in consumer preference from cars to other types of vehicles, such as trucks, is built into the data. This differs from the official index, which has maintained a roughly equal weight between cars and trucks.
In addition to the quantitative evaluations, BLS continued to ask for feedback on the research index through our website and by consulting with other statistical agencies. We received positive feedback and no major concerns, and we remain confident the research index is statistically sound. For these reasons, we have decided to incorporate the new data source and methods for new vehicles in the official CPI.
In some ways, the past 2 years have been an unprecedented time for statistical measurement, but in other ways business at BLS has continued as usual. When the COVID-19 pandemic began in March 2020, BLS ceased in-person data collection for the CPI and other programs. We collected more data online, by telephone, and through video. While the pandemic affected data collection, we continue to publish data on schedule. We also continue to assess our methods and seek ways to improve the quality of our data. Improving our methods for collecting price data for new vehicles is another step forward in innovating and improving the CPI.
| Month | Research index | Official index |
|---|---|---|
Jan 2018 | 100.000 | 100.000 |
Feb 2018 | 100.026 | 99.871 |
Mar 2018 | 99.481 | 99.817 |
Apr 2018 | 99.842 | 99.370 |
May 2018 | 99.583 | 99.560 |
Jun 2018 | 99.499 | 99.705 |
Jul 2018 | 99.841 | 99.681 |
Aug 2018 | 99.942 | 99.424 |
Sep 2018 | 99.917 | 99.129 |
Oct 2018 | 99.886 | 99.043 |
Nov 2018 | 100.072 | 99.204 |
Dec 2018 | 99.471 | 99.409 |
Jan 2019 | 99.969 | 100.043 |
Feb 2019 | 100.295 | 100.157 |
Mar 2019 | 100.182 | 100.539 |
Apr 2019 | 100.487 | 100.574 |
May 2019 | 100.659 | 100.452 |
Jun 2019 | 100.362 | 100.287 |
Jul 2019 | 100.484 | 100.027 |
Aug 2019 | 100.089 | 99.633 |
Sep 2019 | 100.203 | 99.224 |
Oct 2019 | 100.443 | 99.136 |
Nov 2019 | 99.965 | 99.138 |
Dec 2019 | 99.912 | 99.472 |
Jan 2020 | 100.486 | 100.175 |
Feb 2020 | 100.843 | 100.549 |
Mar 2020 | 101.301 | 100.087 |
Apr 2020 | 102.431 | 100.008 |
May 2020 | 102.842 | 100.154 |
Jun 2020 | 103.653 | 100.076 |
Jul 2020 | 104.047 | 100.549 |
Aug 2020 | 104.142 | 100.284 |
Sep 2020 | 103.895 | 100.249 |
Oct 2020 | 103.841 | 100.653 |
Nov 2020 | 103.977 | 100.726 |
Dec 2020 | 103.781 | 101.425 |
Jan 2021 | 104.818 | 101.620 |
Feb 2021 | 105.652 | 101.714 |
Mar 2021 | 106.308 | 101.582 |
Apr 2021 | 107.156 | 101.971 |
May 2021 | 111.189 | 103.502 |
Jun 2021 | 113.656 | 105.341 |
Jul 2021 | 114.795 | 106.944 |
Aug 2021 | 115.205 | 107.930 |
Sep 2021 | 115.942 | 109.013 |
Oct 2021 | 118.107 | 110.566 |
Nov 2021 | 118.980 | 111.915 |
Dec 2021 | 120.336 | 113.373 |
Jan 2022 | 121.230 | 114.005 |
Feb 2022 | 122.481 | 114.308 |
| Month | Research index | Official index |
|---|---|---|
Jan 2019 | 0.11 | 0.61 |
Feb 2019 | 0.10 | 0.58 |
Mar 2019 | 0.11 | 0.42 |
Apr 2019 | 0.11 | 0.43 |
May 2019 | 0.13 | 0.43 |
Jun 2019 | 0.12 | 0.46 |
Jul 2019 | 0.14 | 0.43 |
Aug 2019 | 0.13 | 0.42 |
Sep 2019 | 0.14 | 0.42 |
Oct 2019 | 0.12 | 0.45 |
Nov 2019 | 0.16 | 0.46 |
Dec 2019 | 0.16 | 0.40 |
Jan 2020 | 0.15 | 0.41 |
Feb 2020 | 0.15 | 0.38 |
Mar 2020 | 0.14 | 0.33 |
Apr 2020 | 0.15 | 0.36 |
May 2020 | 0.13 | 0.40 |
Jun 2020 | 0.13 | 0.36 |
Jul 2020 | 0.15 | 0.48 |
Aug 2020 | 0.14 | 0.47 |
Sep 2020 | 0.13 | 0.60 |
Oct 2020 | 0.13 | 0.64 |
Nov 2020 | 0.12 | 0.65 |
Dec 2020 | 0.12 | 0.62 |
Jan 2021 | 0.13 | 0.62 |
Feb 2021 | 0.13 | 0.66 |
Mar 2021 | 0.12 | 0.67 |
Apr 2021 | 0.11 | 0.60 |
May 2021 | 0.12 | 0.59 |
Jun 2021 | 0.13 | 0.63 |
Jul 2021 | 0.13 | 0.61 |
Aug 2021 | 0.13 | 0.69 |
Sep 2021 | 0.13 | 0.74 |
Oct 2021 | 0.16 | 0.72 |
Nov 2021 | 0.15 | 0.55 |
Dec 2021 | 0.15 | 0.69 |
Jan 2022 | 0.14 | 0.67 |
Feb 2022 | 0.14 | 0.68 |