An official website of the United States government
 United States Department of Labor
Friday, August 30, 2024
Labor Day provides an opportunity to highlight some of the information available from the Bureau of Labor Statistics (BLS) that tells the story of the American worker:
In 2024, there are nearly 160 million employees on nonfarm payrolls, according to the Current Employment Statistics program.
Median weekly earnings for full-time wage and salary workers were just shy of $1,150 in the second quarter of 2024, according to the Current Population Survey.
Employer costs for wages and benefits increased 4.1 percent for the year ending June 2024, according to the Employment Cost Index.
Labor productivity increased 2.3 percent in the second quarter of 2024, according to the Productivity program.
But there’s more to the labor story than just a bunch of numbers. Let’s take a step back and explore how BLS, throughout its history, has put flesh on the bony skeleton of statistics by expanding analysis of, and adding visualizations to, labor-related data.
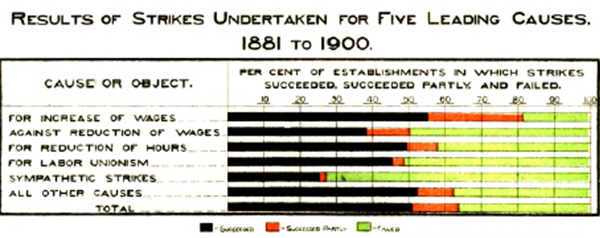
You can find an extensive history of Labor Day on the Department of Labor website. There you will learn that the first Labor Day celebrations were in the 1880s, close to the establishment of BLS in 1884. From the start, BLS has found ways to illustrate the information it gathered. An early example looks at strike activity from the late 19th century, with a chart that may have been drawn with colored pencils.

Results of strikes undertaken for five leading causes, 1881 to 1900
As BLS began to focus on current economic indicators in the early years of the 20th century, we began to supplement statistics with analytical work, leading to the introduction of the Monthly Review in 1915, later renamed the Monthly Labor Review (MLR). The Review added context to economic data, including explanations of survey methodology and explorations of detailed series beyond the headline statistics. A friendly reader once said, “If you see it in the Review, it’s so.”

Monthly Review of the U.S. Bureau of Labor Statistics, July 1915
Celebrating the MLR centennial 100 years later, BLS Commissioner Erica Groshen wrote:
Knowing that the data we produce depend so crucially on the support of the American people, we do not take lightly our responsibilities to protect respondent confidentiality and to produce statistics based on transparent methods that adhere to the highest professional standards. The fruit of this special relationship is readily apparent in the MLR, which takes BLS statistical products one step further, turning them into analytical stories that respond to a wide variety of current interests.
Commissioner Groshen’s remarks echo the sentiments of several of her predecessors, who sought to put BLS numbers in context and expand the amount of analysis that accompanies BLS statistics. In the 1920s, Commissioner Ethelbert Stewart, a long-serving BLS career employee who rose through the ranks to become Commissioner, cautioned against the “mania of statistics,” warning “the only things that make human life human do not lend themselves readily to the statistical method.” He declared, bluntly: “For 30 years, I have been struggling to put some flesh upon the bony skeleton of mere tabulations — it’s about human lives.” [Quotation from BLS Centennial Album.]
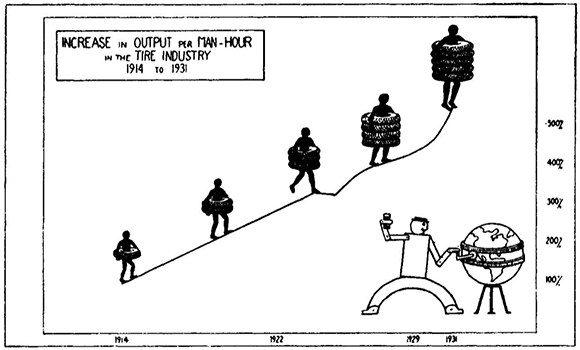
Perhaps in response to Ethelbert’s comment, BLS prepared a “series of pictorial charts” for the Department of Labor’s exhibit at the Century of Progress Exposition in Chicago in 1933. Among the charts are:
Trends in hourly earnings, showing dollar signs climbing a line chart.
Changes in cost of living, with a chart of market baskets.
Accident history in the iron and steel industry, including a chart with a stretcher and wheelchair.
Trends in work hours, with a chart full of clocks.
Trends in industrial disputes, shown as a tug of war.

Increase in Output per Man-Hour in the Tire Industry, 1914–1931
During the Great Depression, Commissioner Isador Lubin echoed his predecessor’s request for expanded data analysis, this time to assess the effect of economic interventions. “Not only must raw data be improved but the Bureau must be enabled more fully to analyze the material it now has, so that evidence may be available as to where the recovery program is having the greatest effect and where it is falling down.” Commissioner Lubin’s use of the term “evidence” is an early precursor of today’s Foundations for Evidence-based Policymaking Act, which encourages the use of statistics in decision-making. [Quotation from Hundred Years Book, page 144.]
Fast forward to the 1960s, when Commissioner Arthur Ross said that BLS products “will not simply be raw data but will be usable to labor, management, and to other customers.” His sentiments were echoed by then Labor Secretary Willard Wirtz, who opined that statistical information is “sterile.” He argued for more personal stories, more about the impact of unemployment and inflation on the American people. [Ross quotation, Hundred Years Book, page 216.]
BLS heeded those requests by moving to make data more accessible, first with a public database followed by a website, application programming interface (API), social media presence, and more. On the occasion of the BLS centennial in 1984, Commissioner Janet Norwood looked toward the future: “… a statistical agency that does not constantly move ahead in the use of new techniques quickly moves backwards.” [Centennial booklet.]
Today the flesh on the statistical skeleton takes many forms, including:
Extensive, high-quality analysis, including special series dedicated to major events such as Hurricane Katrina and the COVID-19 pandemic.
Maps showing employment, wages, and establishment counts in hurricane flood zones.
Videos describing data products and methodology.
This blog, which has featured cicadas, doughnuts, and Festivus.
The Economics Daily, which provides a fresh topic every business day, such as the recent celebration of National Roller Coaster Day.
And interactive graphics for news releases, as well as several other BLS products, such as this map showing state unemployment rates:
Editor’s note: Data for this map are available in the table below.
As we recognize all workers this Labor Day, BLS continues to add analysis and visualizations to bring statistics to life.
| State | July 2024 unemployment rate (percent) | July 2023 unemployment rate (percent) | 12-month change (percentage points) |
|---|---|---|---|
| Alabama | 2.8 | 2.4 | 0.4 |
| Alaska | 4.5 | 4.3 | 0.2 |
| Arizona | 3.4 | 3.9 | -0.5 |
| Arkansas | 3.3 | 3.2 | 0.1 |
| California | 5.2 | 4.7 | 0.5 |
| Colorado | 3.9 | 3.2 | 0.7 |
| Connecticut | 3.6 | 3.6 | 0.0 |
| Delaware | 4.1 | 3.9 | 0.2 |
| District of Columbia | 5.5 | 4.7 | 0.8 |
| Florida | 3.3 | 2.9 | 0.4 |
| Georgia | 3.4 | 3.2 | 0.2 |
| Hawaii | 2.9 | 2.8 | 0.1 |
| Idaho | 3.5 | 3.1 | 0.4 |
| Illinois | 5.2 | 4.4 | 0.8 |
| Indiana | 4.0 | 3.4 | 0.6 |
| Iowa | 2.8 | 3.0 | -0.2 |
| Kansas | 3.2 | 2.6 | 0.6 |
| Kentucky | 4.7 | 4.2 | 0.5 |
| Louisiana | 3.9 | 3.4 | 0.5 |
| Maine | 2.8 | 2.8 | 0.0 |
| Maryland | 2.8 | 1.9 | 0.9 |
| Massachusetts | 3.5 | 3.2 | 0.3 |
| Michigan | 4.4 | 3.8 | 0.6 |
| Minnesota | 3.2 | 3.0 | 0.2 |
| Mississippi | 2.7 | 3.1 | -0.4 |
| Missouri | 3.8 | 3.1 | 0.7 |
| Montana | 3.1 | 2.8 | 0.3 |
| Nebraska | 2.6 | 2.3 | 0.3 |
| Nevada | 5.4 | 5.0 | 0.4 |
| New Hampshire | 2.5 | 2.1 | 0.4 |
| New Jersey | 4.7 | 4.5 | 0.2 |
| New Mexico | 4.0 | 3.7 | 0.3 |
| New York | 4.3 | 4.1 | 0.2 |
| North Carolina | 3.7 | 3.4 | 0.3 |
| North Dakota | 2.2 | 1.8 | 0.4 |
| Ohio | 4.5 | 3.4 | 1.1 |
| Oklahoma | 3.5 | 3.2 | 0.3 |
| Oregon | 4.1 | 3.6 | 0.5 |
| Pennsylvania | 3.4 | 3.2 | 0.2 |
| Rhode Island | 4.5 | 2.7 | 1.8 |
| South Carolina | 3.9 | 2.8 | 1.1 |
| South Dakota | 2.0 | 2.0 | 0.0 |
| Tennessee | 3.0 | 3.2 | -0.2 |
| Texas | 4.1 | 3.9 | 0.2 |
| Utah | 3.2 | 2.7 | 0.5 |
| Vermont | 2.1 | 1.9 | 0.2 |
| Virginia | 2.7 | 2.6 | 0.1 |
| Washington | 4.9 | 3.9 | 1.0 |
| West Virginia | 4.2 | 4.0 | 0.2 |
| Wisconsin | 3.0 | 3.2 | -0.2 |
| Wyoming | 2.9 | 2.8 | 0.1 |