An official website of the United States government
An official website of the United States government
The .gov means it's official.
Federal government websites often end in .gov or .mil. Before sharing sensitive information,
make sure you're on a federal government site.
The site is secure.
The
https:// ensures that you are connecting to the official website and that any
information you provide is encrypted and transmitted securely.
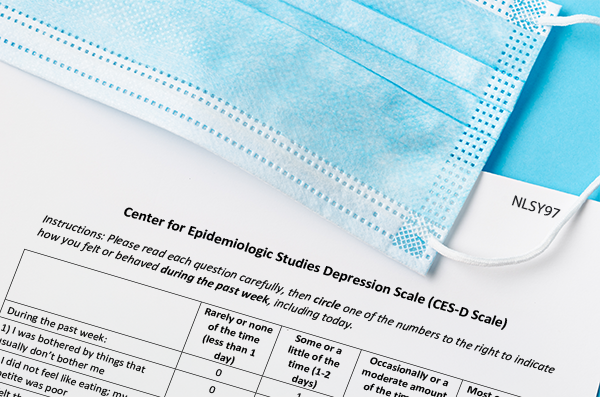
This article examines how depressive symptoms changed during and after the COVID-19 pandemic and how those symptoms were associated with demographic characteristics and adverse labor market outcomes between 2019 and 2022. read more »

The U.S. Bureau of Labor Statistics has incorporated used clothing into the Consumer Price Index. read more »
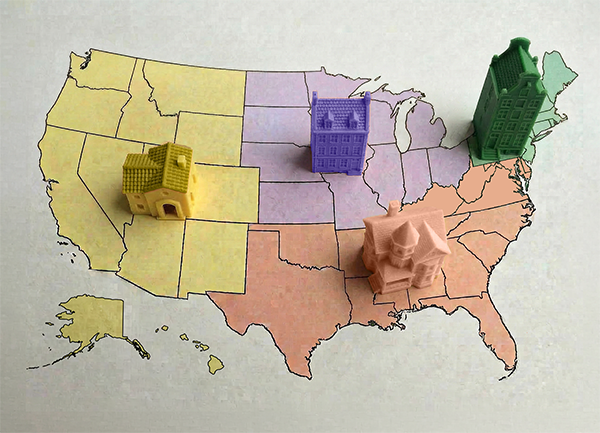
The change in rental costs has been larger in some places than in others. read more »
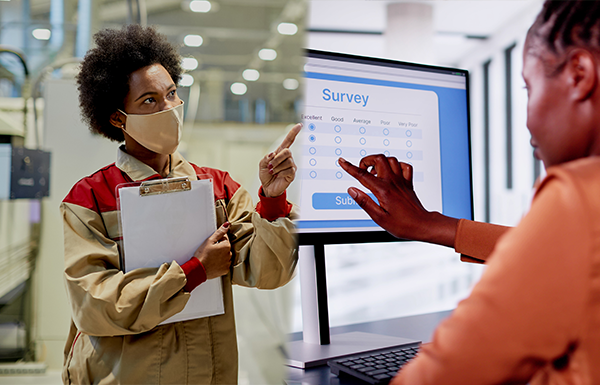
Data collection rapidly shifted in response to the COVID-19 pandemic. read more »

This article compares sales- and margin-based measures of output and productivity for the retail trade sector. read more »
This article examines data on people who were not in the labor force—those who neither worked nor looked for work—and the reasons they gave for not working. read more »

This article examines changes in spending on public transportation from January 2018 to December 2021. read more »

COVID-19 hit childcare industry employment hard and kept running. read more »

Using value-added-output, sectoral-output, and gross-output concepts, economists look at the contribution of industries to the manufacturing sector and how the industries affect sector size and total factor productivity growth. read more »

A textual analysis of International Labour Organization publications. read more »

This article presents U.S. Bureau of Labor Statistics projections for the labor force and the aggregate economy for the 2022–32 period. read more »

This article shows how automotive dealerships contributed to new-vehicle consumer inflation through markup increases during the economic recovery from the COVID-19 pandemic. read more »
This article presents the U.S. Bureau of Labor Statistics employment and output projections for the 2021–31 period. read more »

This article reviews data from the National Longitudinal Survey of Youth 1997 on the likelihoods of work and telework associated with characteristics related to demographics, education, geography, and prepandemic jobs. read more »

This article compares the labor market outcomes of workers with and without a criminal history record during the early stages of the COVID-19 pandemic. read more »

This article reports on an examination of whether the pandemic led to changes in job requirements measured in the U.S. Bureau of Labor Statistics Occupational Requirements Survey. read more »

This article empirically assesses the observed increase in job resignations during the coronavirus disease 2019 (COVID-19) pandemic and examines the pandemic’s uniqueness from prior macroeconomic events. read more »
This article presents the U.S. Bureau of Labor Statistics employment and output projections for the 2021–31 period. read more »

From the 2007–09 Great Recession to the onset of the coronavirus disease 2019 pandemic, the new-vehicle market in the United States changed significantly. Consumer and producer price trends examined in this article show how dealers’ profits on new vehicles declined and, subsequently, how dealers successfully expanded financial services to improve revenue and profit. read more »

This article examines recent trends in job quit rates, placing them in historical perspective. read more »

Total nonfarm employment in the United States continued to recover in 2021, with some industries fully recovering and subsequently expanding amid the coronavirus disease 2019 pandemic. read more »
The CES program enhances seasonal adjustment procedure to combat Covid-19. read more »

The CPI and PPI mitigated the effects of the COVID-19 pandemic on their seasonally adjusted price indexes. read more »

This article examines the revisions to the BLS labor productivity and costs estimates, with the goal of developing intervals to help data users better assess the size of the revisions. read more »
The U.S. Bureau of Labor Statistics publishes eight diffusion index series that measure the geographic dispersion of employment change and are useful in describing the impact of the pandemic and ongoing job recovery. read more »

Using new data from the 2021 Business Response Survey, this article presents unique estimates of telework patterns observed during the coronavirus disease 2019 (COVID-19) pandemic. read more »
This article examines target-year employment levels across four sets of U.S. Bureau of Labor Statistics industry and occupational employment projections, evaluating possible long-term pandemic-induced structural changes to the U.S. labor market. read more »

This article provides an analysis of the recent employment declines in the rail transportation industry. read more »

This article presents the U.S. Bureau of Labor Statistics employment and output projections for the 2020–30 period. read more »
Unemployment insurance during the pandemic improved people’s well-being in areas such as household finances, food security, and mental health. read more »

A third of U.S. workers reported teleworking during the coronavirus, and workers in occupations suitable for telework had lower rates of lost work. read more »
This article examines employment changes in 2020, taking into account the effects of the coronavirus disease 2019 (COVID-19) pandemic. read more »

Employment declined and unemployment rose over the year, as the nation battled the COVID-19 pandemic. read more »

This article examines how a series of major hurricanes in 2017 and 2018 affected the estimation of state and metropolitan area payroll employment and how lessons learned from these disasters has provided a playbook for producing estimates during the COVID-19 pandemic. read more »
Using data from the U.S. Bureau of Labor Statistics (BLS) National Compensation Survey and two BLS supplemental surveys, this article examines changes to sick leave provisions and use before and during the COVID-19 pandemic. read more »

This article examines the impact of the coronavirus disease 2019 (COVID-19) pandemic on the U.S. Bureau of Labor Statistics 2019–29 employment projections through two alternate scenarios: a moderate impact scenario and a strong impact scenario. read more »
Two prominent economists examine the economic effects of self-testing for COVID-19 versus being tested by healthcare professionals. read more »

This article reviews recent economic research on pandemic-related job losses in the United States in order to understand the prospects for employment recovery. read more »

Using data from the Household Pulse Survey, this article examines pandemic-related changes in consumer spending behavior in August 2020. The article also shows how these changes differed across generations and geography. read more »

This article uses microdata from the Current Employment Statistics survey for the private sector to calculate employment changes from February 2020 to August 2020, by employer size. read more »

This article describes the impact the COVID-19 pandemic has had on price changes for food categories within the U.S. Bureau of Labor Statistics import/export price indexes, producer price indexes, and consumer price indexes. In addition, the article assesses the pandemic’s impact on price data collection efforts. Safety precautions established during the pandemic created data collection challenges for some price indexes more than others. read more »

The local spread of coronavirus-19 has disproportionally affected employment across industries. read more »

This article examines the relationship between workers’ ability to work at home, as captured in job characteristics measured by the Occupational Information Network, and the actual incidence of working at home, as measured by the American Time Use Survey and the National Longitudinal Survey of Youth 1979. read more »

Workers in the highly exposed industries and their families were disproportionally affected by COVID-19 pandemic. read more »
This article examines the labor market impacts of establishment shutdowns implemented in response to coronavirus disease 2019 (COVID-19). read more »
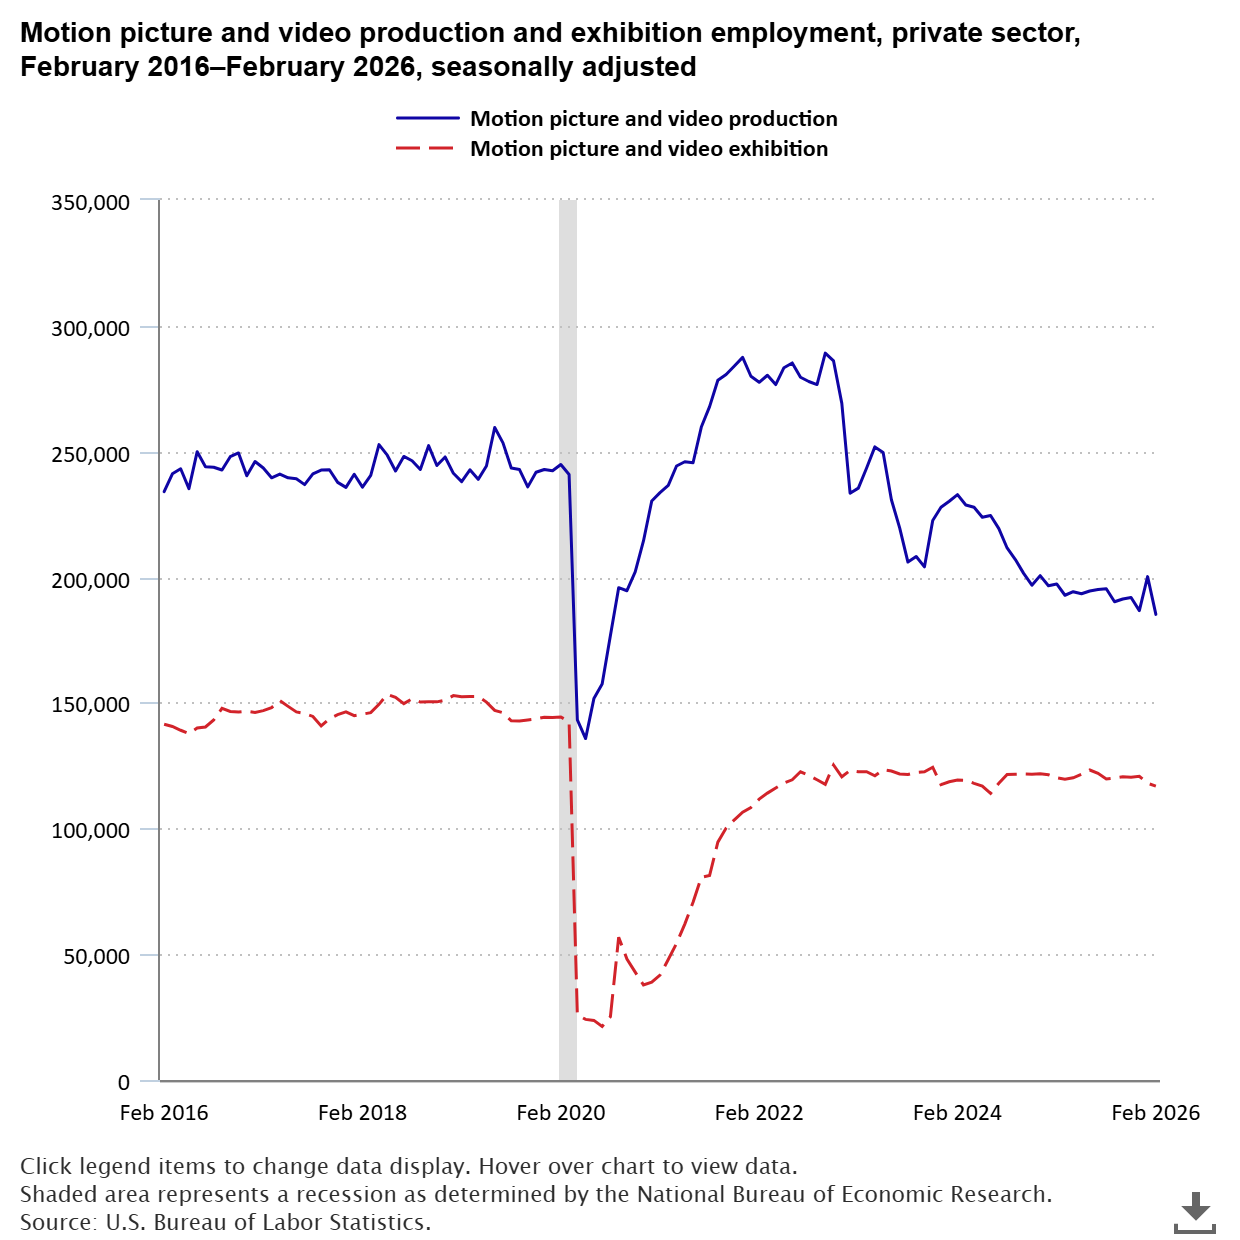
From February 2016 through February 2026, employment in the motion picture and video industries reel-y put on a show. After contending with the pandemic, the resulting reduction in film releases, and multiple worker strikes, employment in the industry ended the decade lower than where it started. read more »
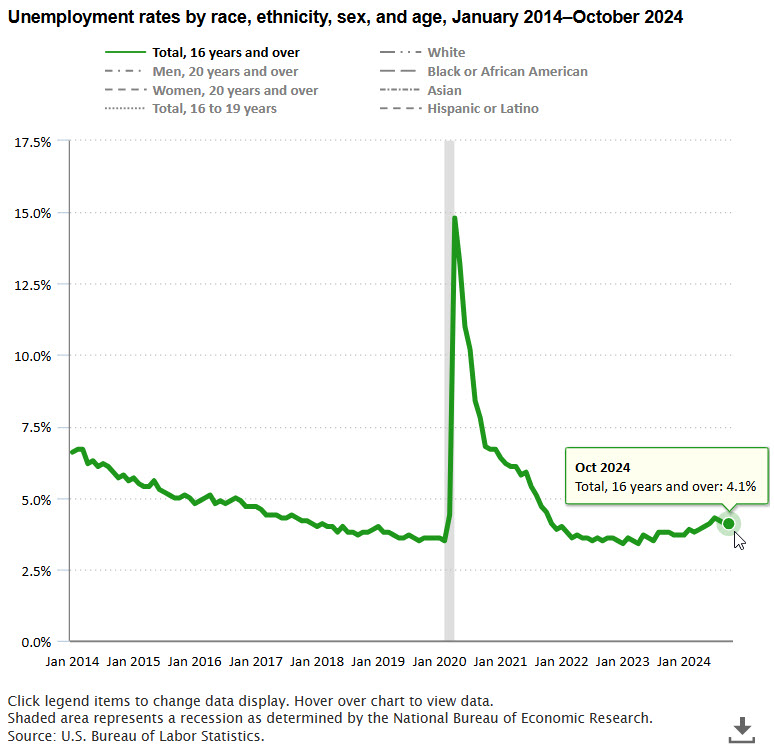
The unemployment rate for people age 16 and older was unchanged at 4.1 percent in October 2024, but higher than a year earlier (3.8 percent). The rate has ranged from 4.0 percent to 4.3 percent since May 2024. read more »
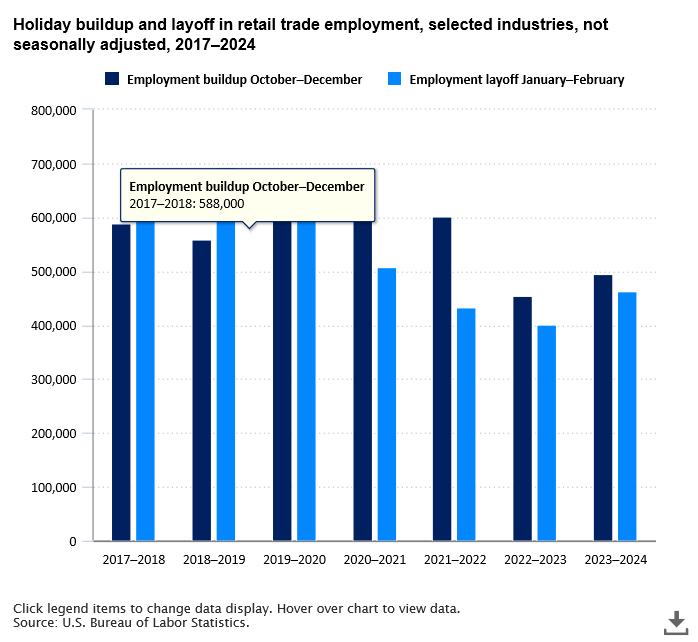
Employment in retail trade industries that hire seasonal employees to meet holiday demand increased by 494,000 from October to December 2023, a stronger holiday buildup than in 2022. The subsequent holiday layoff in January and February was smaller than the buildup. read more »
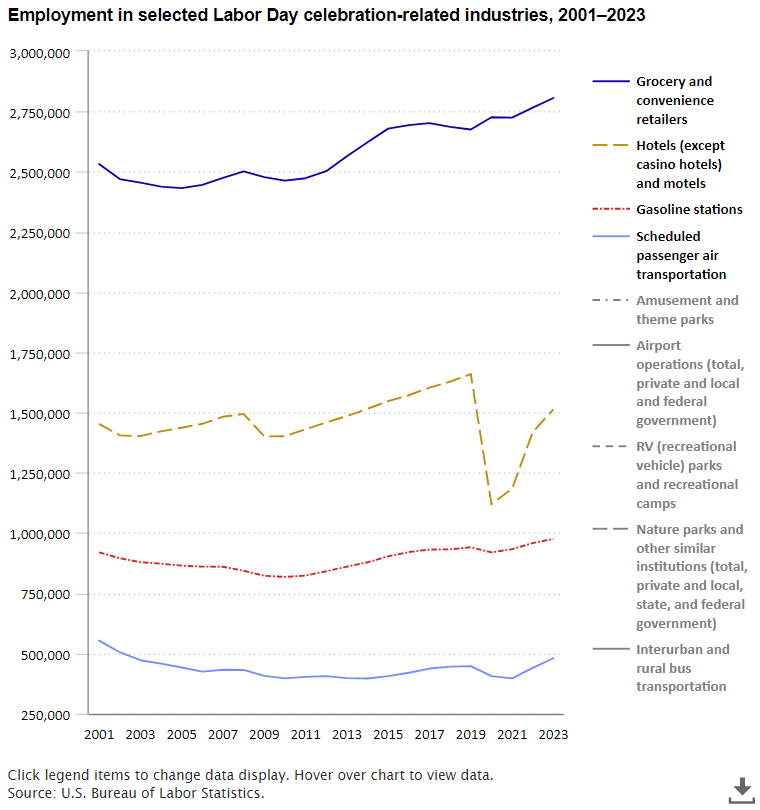
Labor Day, celebrated on the first Monday of September, celebrates the social and economic achievements of American workers. Labor Day is also often seen as the unofficial end of summer, the last weekend before the beginning of the school year, and an occasion for a memorable meal or an opportunity for a three-day-weekend getaway. In this TED, we present data about workers that make our Labor Day events possible, often with extra work before Labor Day or working on Labor Day itself. read more »
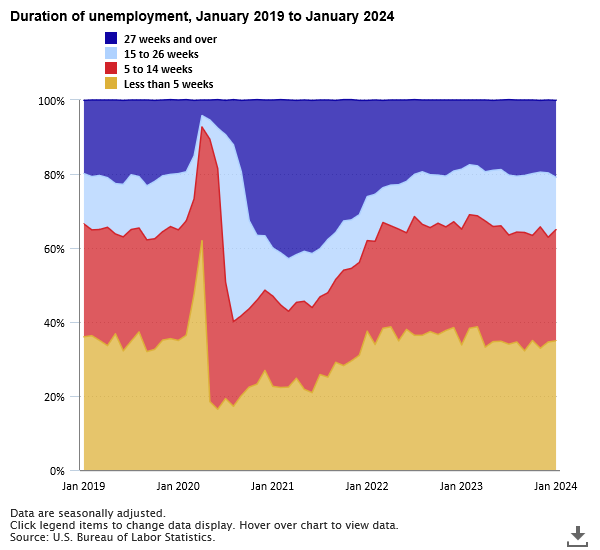
The number of long-term unemployed (those jobless for 27 weeks or more), at 1.3 million, was little changed in January, and the long-term unemployed accounted for 20.8 percent of all unemployed people. These figures were little changed from the previous month. read more »
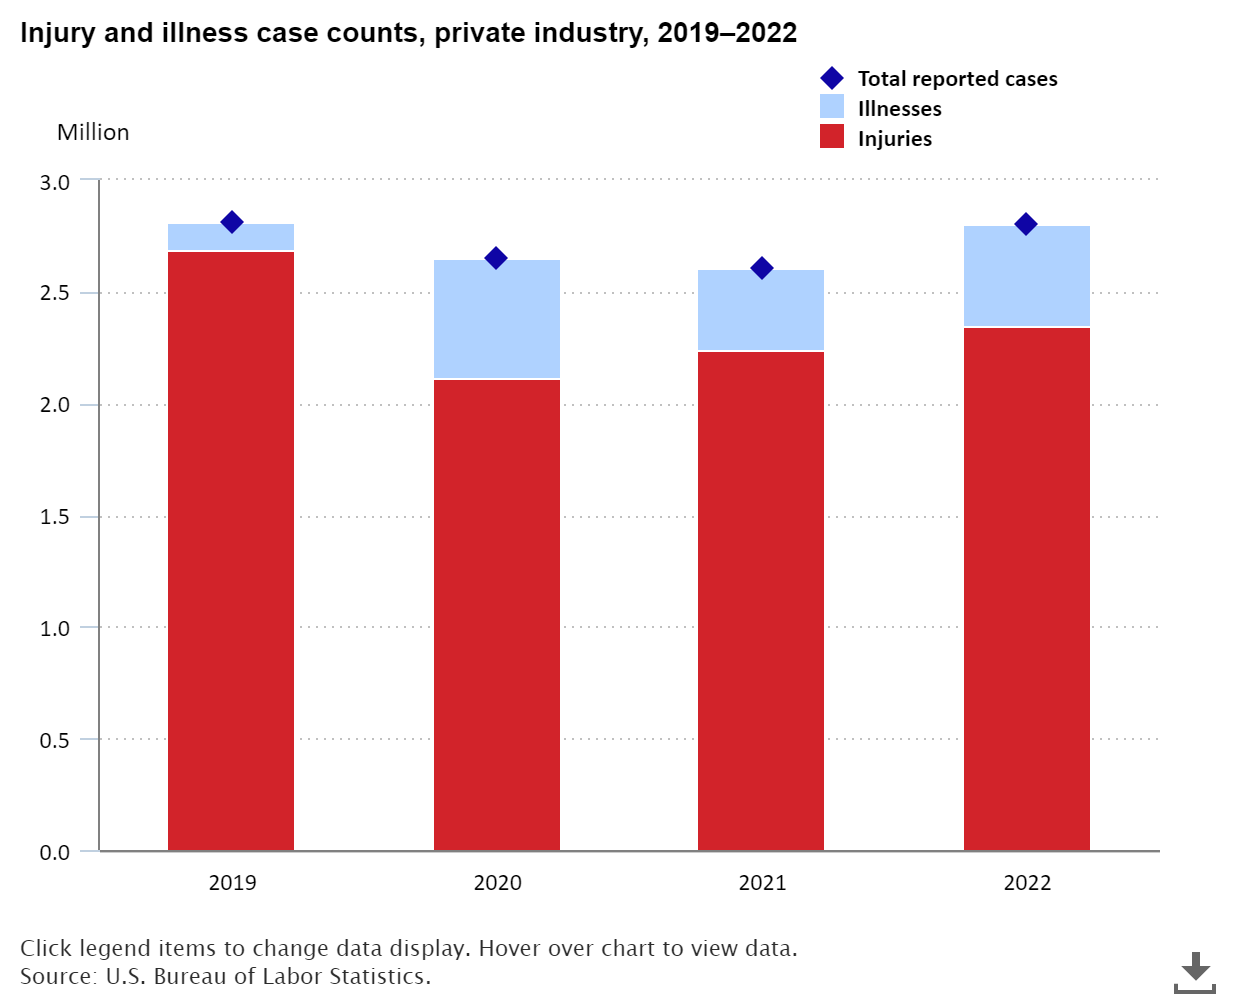
Private industry employers reported 2.8 million nonfatal workplace injuries and illnesses in 2022, up 7.5 percent from 2021. This increase was driven by the rise in both injuries, up 4.5 percent to 2.3 million cases, and illnesses, up 26.1 percent to 460,700 cases. read more »
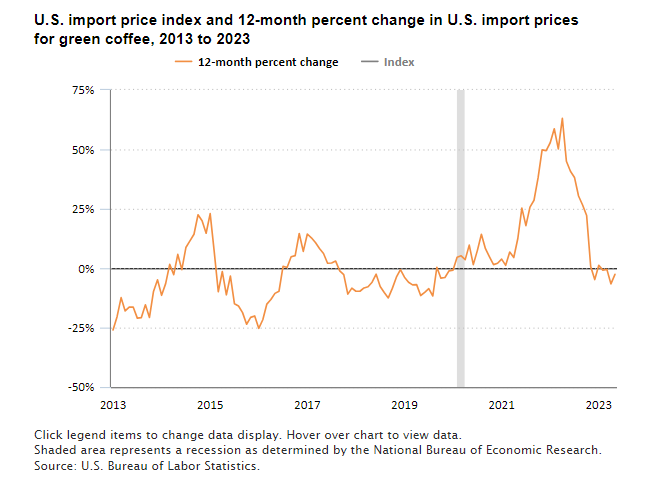
Prices for U.S. imports of coffee fell 2.6 percent from May 2022 to May 2023. The decline followed a series of increases since the spring of 2021. Prices for U.S. imports of coffee were 57 percent higher in May 2023 than in February 2021. read more »
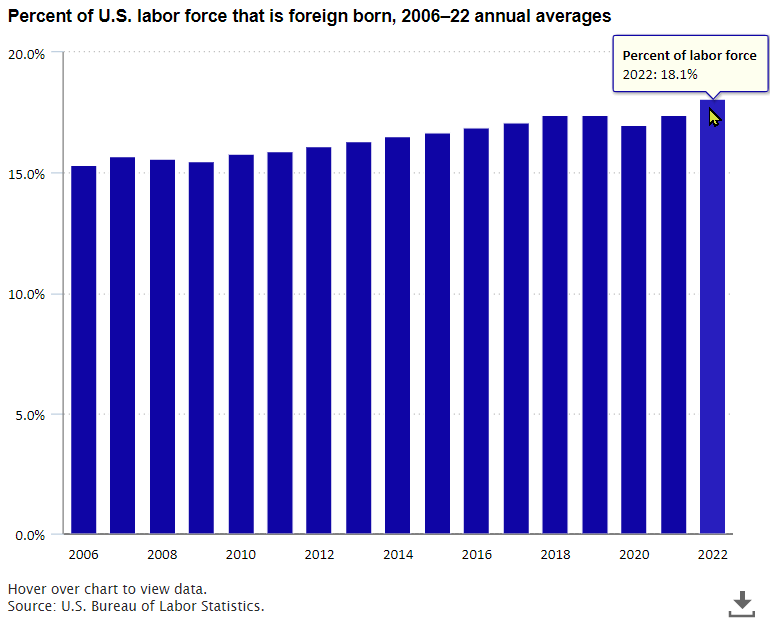
In 2022, foreign-born workers accounted for a record high 18.1 percent of the U.S. civilian labor force, up from 17.4 percent in 2021. The share of foreign born has followed an upward trend since collection of these data began in 1996. read more »
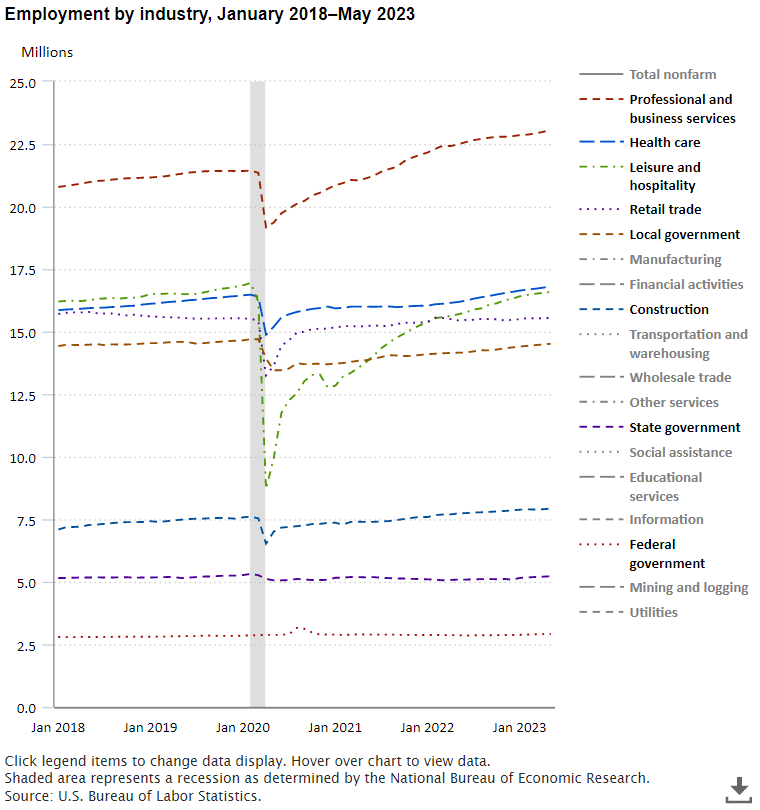
Total nonfarm payroll employment increased by 339,000 in May 2023, in line with the average monthly gain of 341,000 over the prior 12 months. In May, employment increases occurred in professional and business services, government, health care, construction, transportation and warehousing, and social assistance. read more »
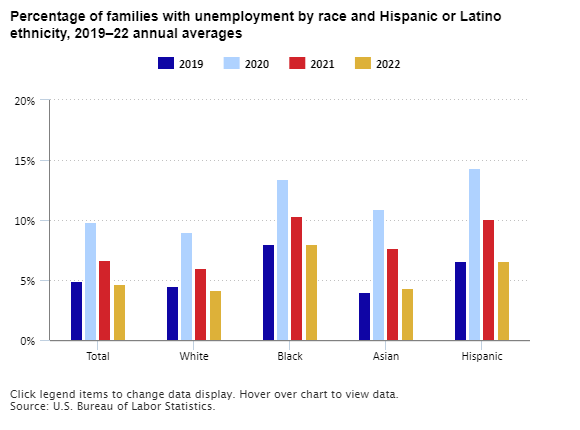
The proportion of families with an unemployed person shrank from 6.7 percent in 2021 to 4.7 percent in 2022. This reflects the continued labor market recovery from the February to April 2020 recession induced by the COVID-19 pandemic. The proportion of families with at least one unemployed member in 2022 was smaller than the proportion in 2019 (4.9 percent), before the pandemic. read more »
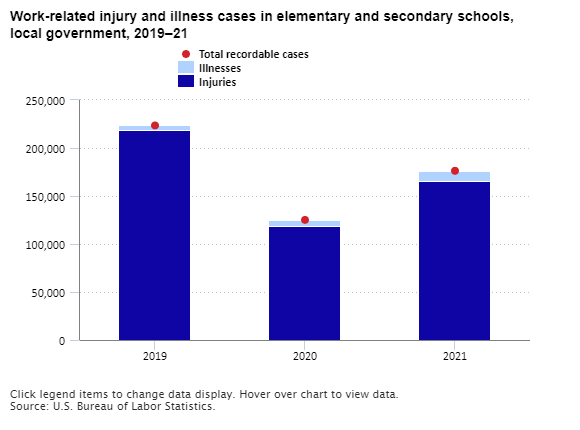
There were 176,200 work-related injuries and illnesses in elementary and secondary schools in local government in 2021, a 40.9-percent increase from 2020. The 2021 total was still 21.1 percent lower than in 2019. read more »
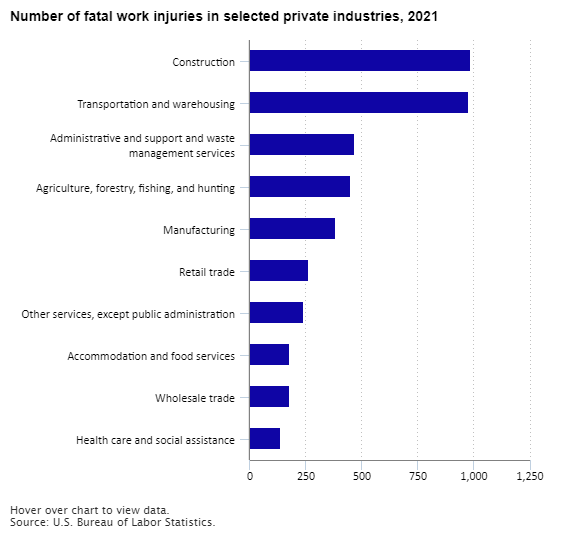
Workers’ Memorial Day, a day of remembrance for workers killed, disabled, or injured on the job, is observed annually on April 28. In 2021, 5,190 workers in the United States suffered fatal work injuries. read more »
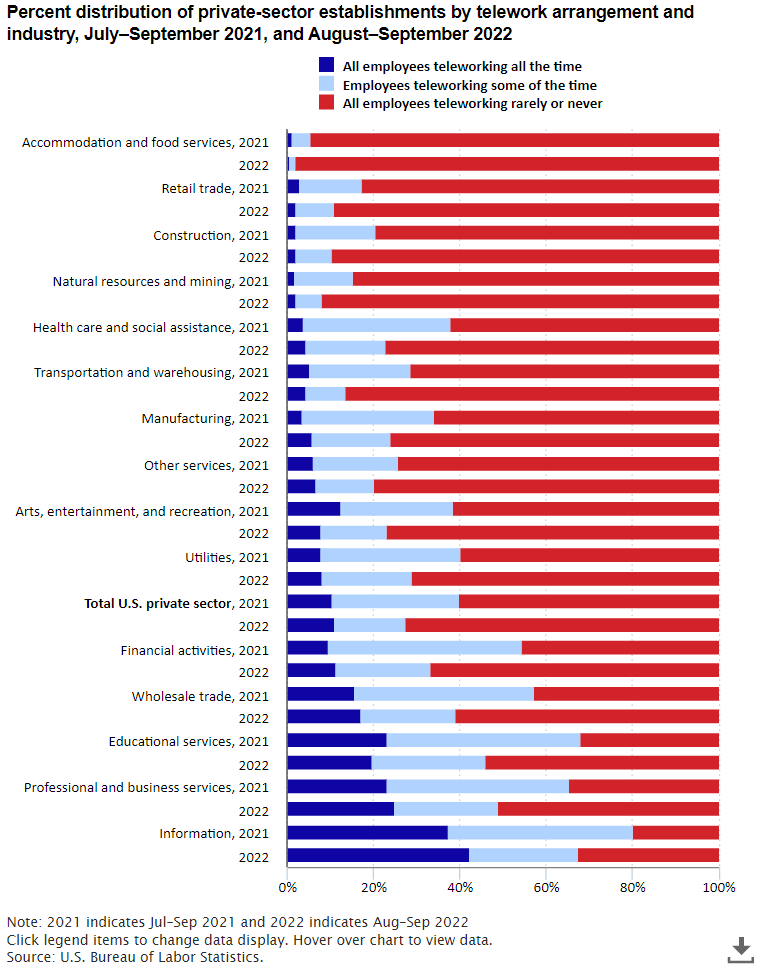
In July–September 2021, 40.1 percent of private-sector establishments had employees teleworking some or all of the time. A year later, in August–September 2022, that number had decreased to 27.5 percent. read more »
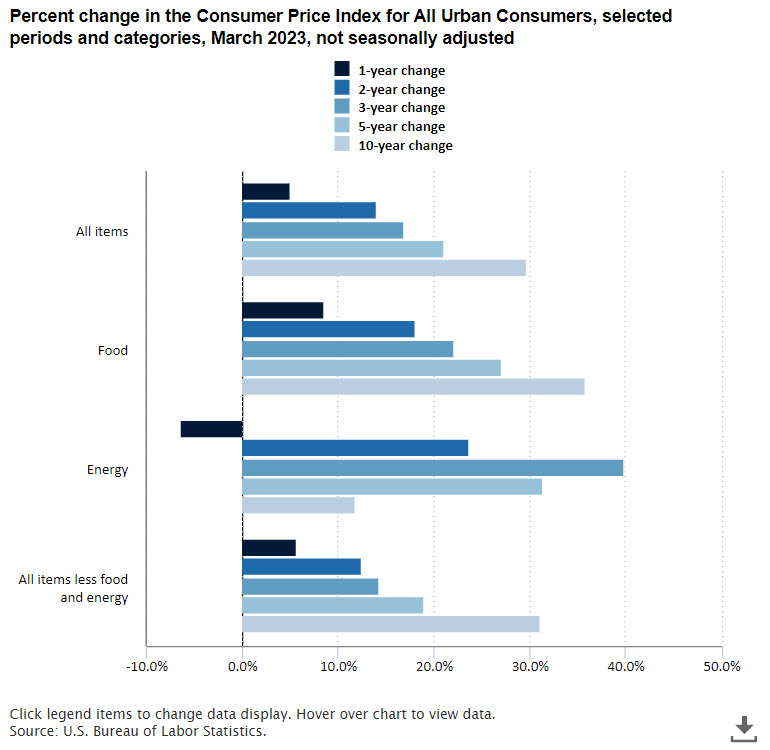
Over the 12 months ended March 2023, the Consumer Price Index for All Urban Consumers increased 5.0 percent; this was the smallest 12-month increase since the year ending May 2021. Energy prices decreased 6.4 percent since March 2022. read more »
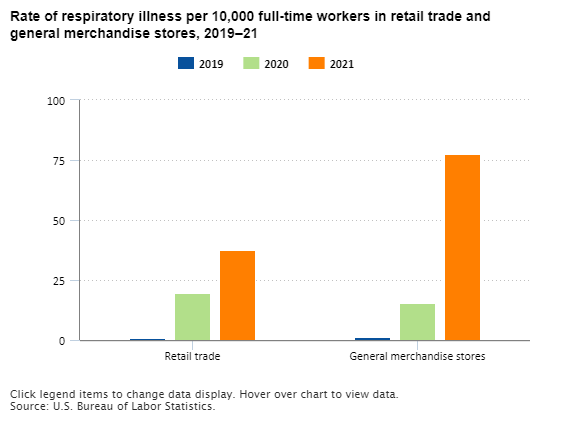
Respiratory illnesses in the retail trade sector rose 96.0 percent from 2020 (21,500 cases) to 2021 (42,100 cases). That drove a 75.6-percent increase in all illnesses (29,500 to 51,850). read more »
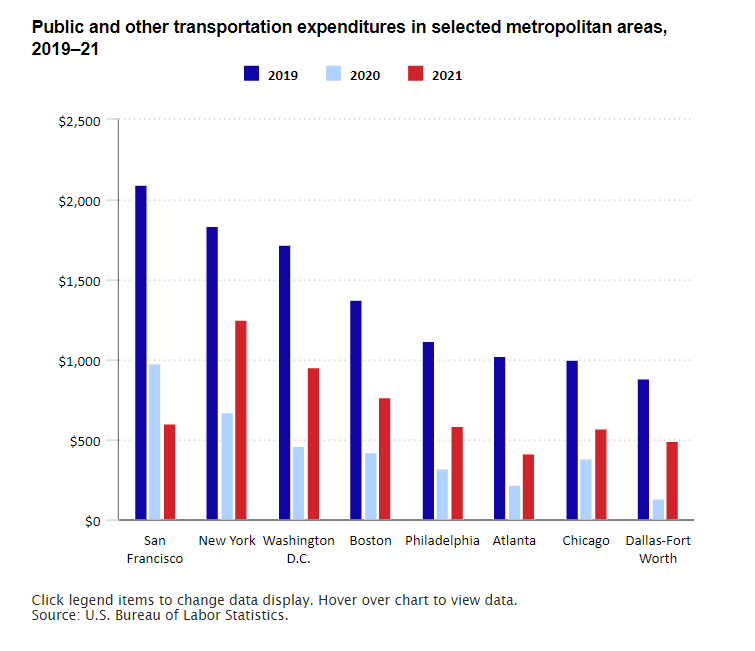
Consumer spending on public and other transportation rose sharply in 2021, after declining sharply in 2020, when the COVID-19 pandemic began. Average annual expenditures varied widely in 2021 among eight selected metropolitan areas, ranging from $415 for the average consumer unit in Atlanta to $1,252 for the average consumer unit in New York. read more »
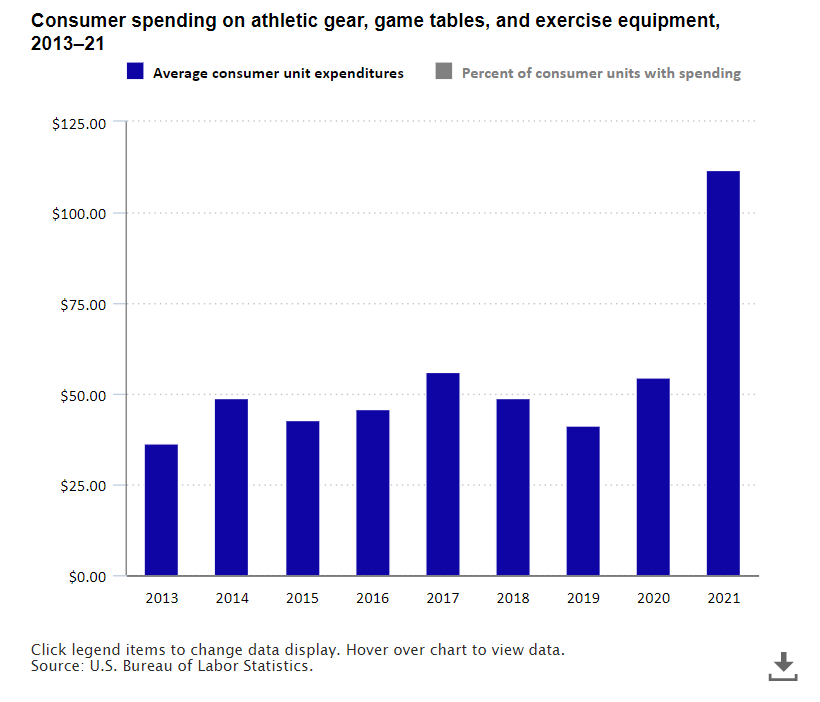
The average consumer unit spent $111.80 on athletic gear, game tables, and exercise equipment in 2021. That was more than double the average spending of $54.33 in 2020. read more »
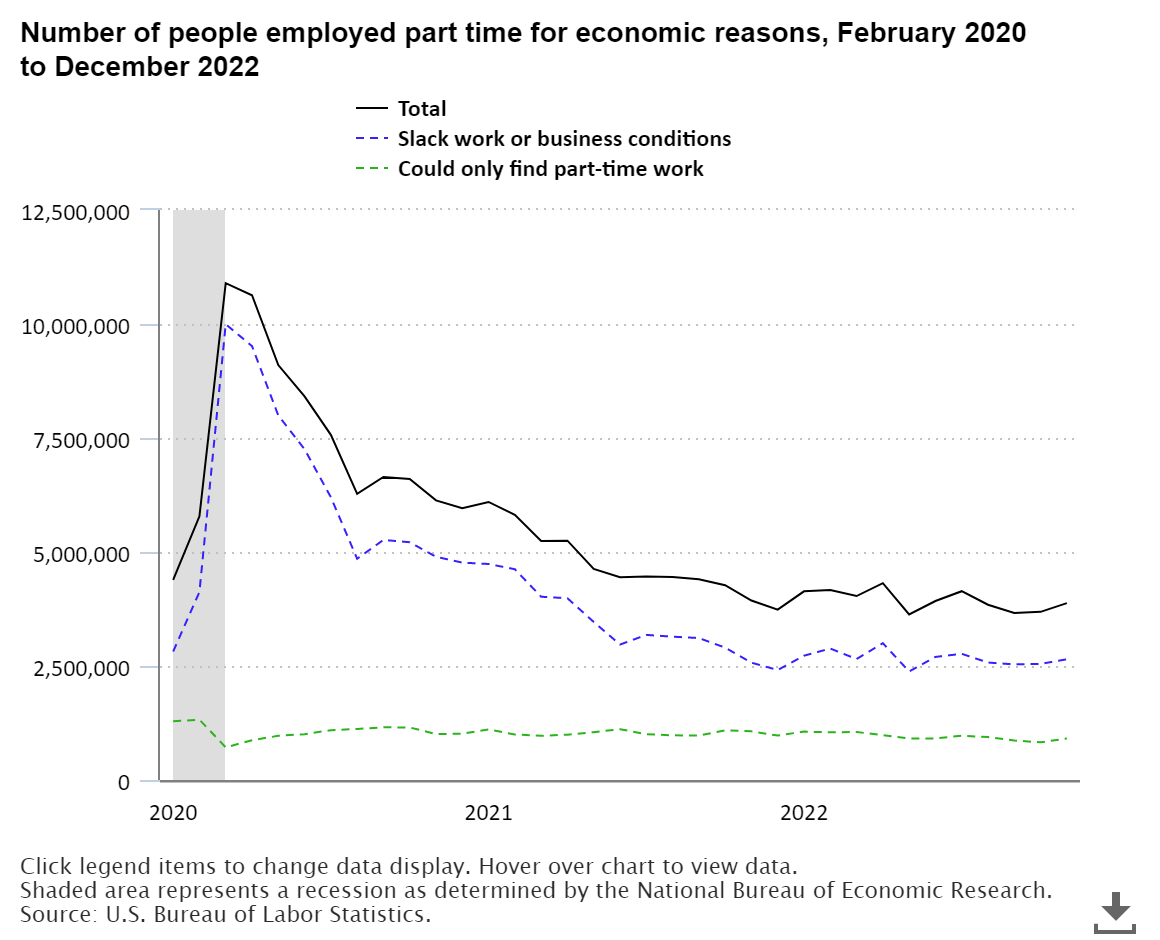
The number of people at work part time for economic reasons, also called involuntary part-time workers, totaled 3.9 million in December 2022. These workers would have preferred full-time employment but were working part time because their hours had been reduced due to slack work or they were unable to find full-time jobs. This was a half million fewer people than in February 2020, the month before the start of the COVID-19 pandemic and the recession that resulted from it. read more »
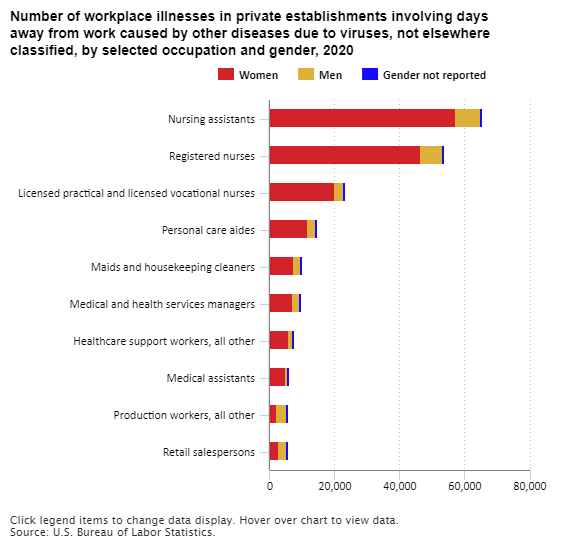
Women accounted for 70.8 percent of the 390,020 reported workplace illness cases caused by “other diseases due to viruses, not elsewhere classified” in private establishments in 2020. This category includes COVID-19 cases. read more »
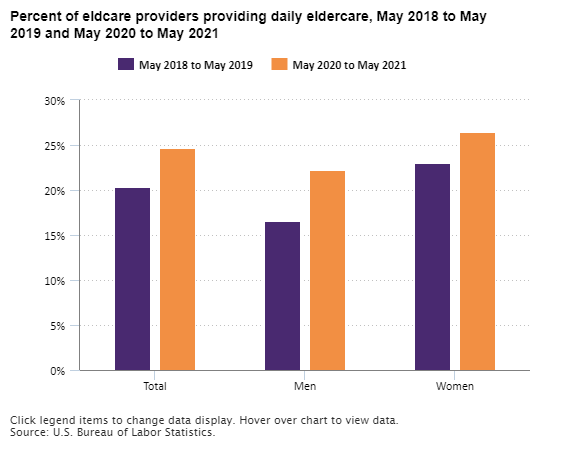
From May 2020 to May 2021, 13.8 percent of the civilian population age 15 and older provided unpaid eldercare, compared with 15.0 percent who did so from May 2018 to May 2019. Of these providers, 24.7 percent provided eldercare daily from May 2020 to May 2021, compared with 20.3 percent who did so daily from May 2018 to May 2019. read more »
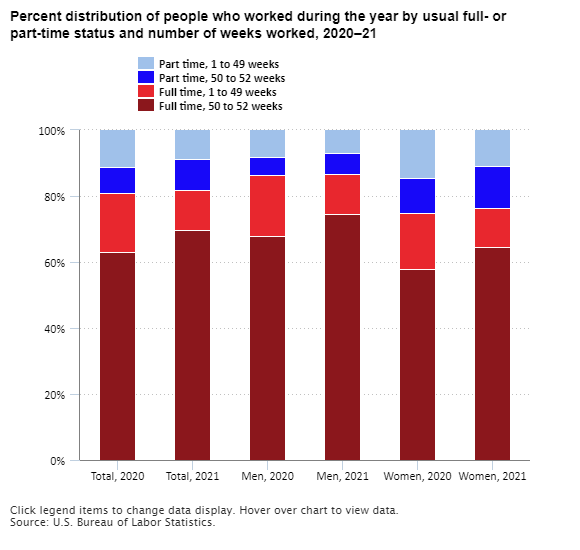
A total of 166.8 million people worked at some point during 2021, up by 1.2 million from 2020. The proportion of workers who worked full time, year round (that is, 50 to 52 weeks) rose from 63.1 percent in 2020 to 69.8 percent in 2021. read more »
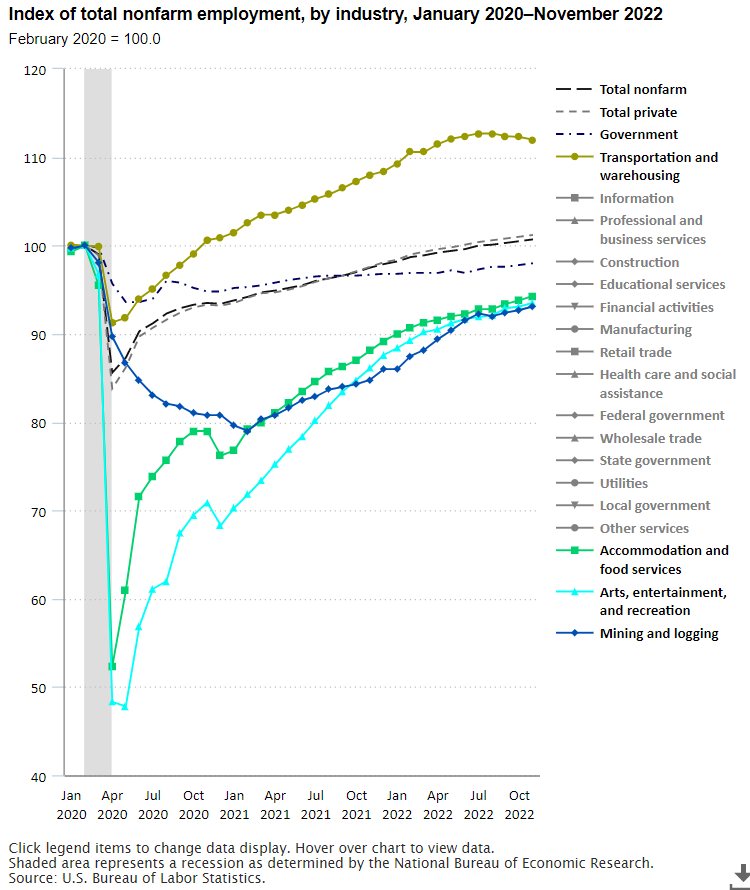
In November 2022, total nonfarm employment increased by 263,000 to reach 100.7 percent of its level in February 2020, the month before the start of the COVID-19 pandemic and the recession that resulted from it. In April 2020, nonfarm employment was 85.6 percent of its level 2 months earlier. read more »
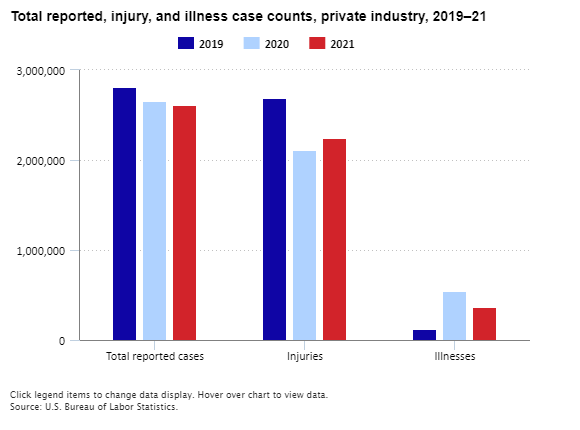
There were 2.6 million nonfatal workplace injuries and illnesses reported by private industry employers in 2021, a 1.8-percent decrease from 2.7 million cases in 2020. In 2021, the incidence rate of total recordable cases in private industry was 2.7 cases per 100 full-time workers, unchanged from 2020. read more »
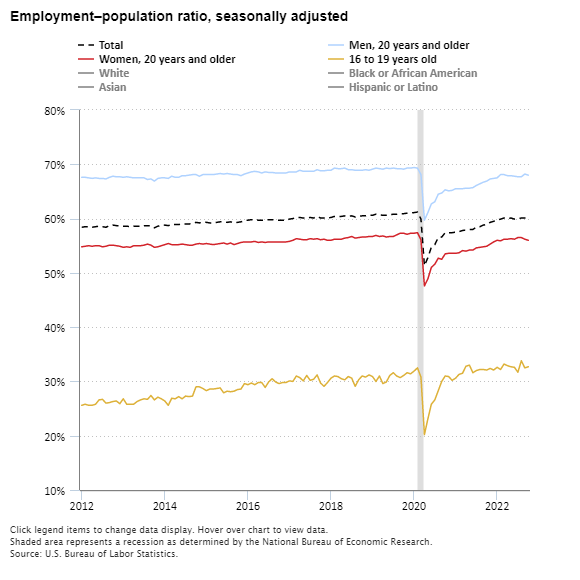
The employment–population ratio—the proportion of the population that is employed—was 60.0 percent in October 2022 for people age 16 and older. The ratio was about unchanged over the month and has shown little change since early this year. The October 2022 ratio was 1.1 percentage points higher than in October 2021 (58.9 percent) and is 1.2 percentage points below its February 2020 value, before the COVID-19 pandemic. read more »
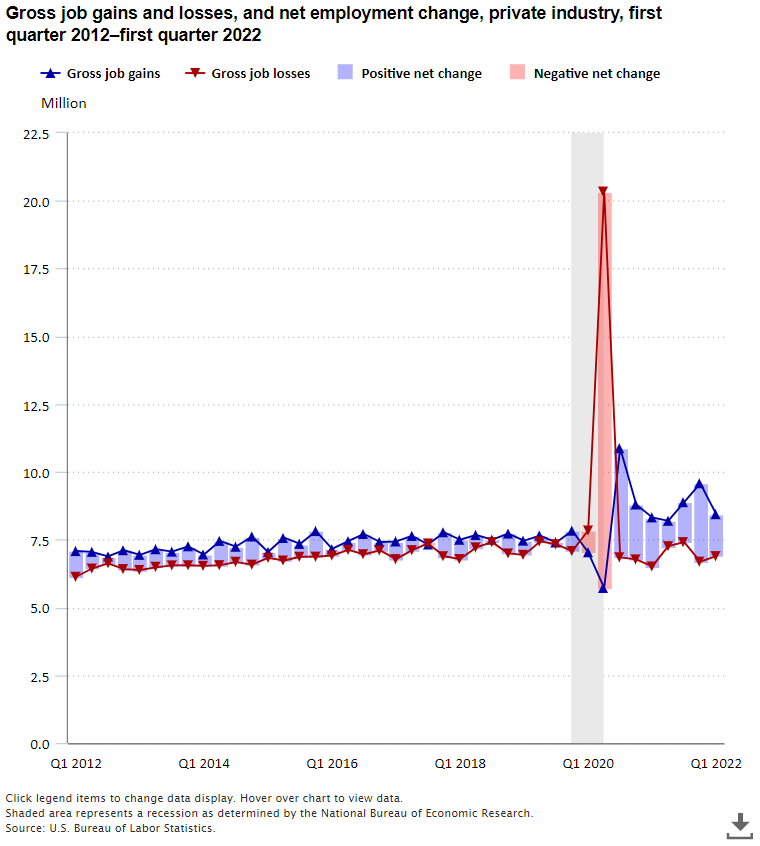
From December 2021 to March 2022, gross job gains at opening and expanding private-sector establishments were 8.4 million. Gross job losses at closing and contracting private-sector establishments were 6.9 million. The difference between the job gains and the job losses yielded a net employment gain of 1.5 million jobs during the first quarter of 2022. read more »
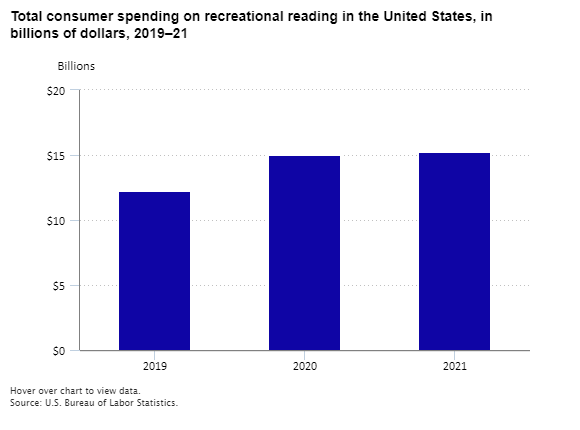
U.S. consumers spent more on recreational reading during the COVID-19 pandemic than ever before. Consumer spending on recreational reading rose 22.9 percent in 2020 and another 1.8 percent in 2021, reaching $15.2 billion. read more »
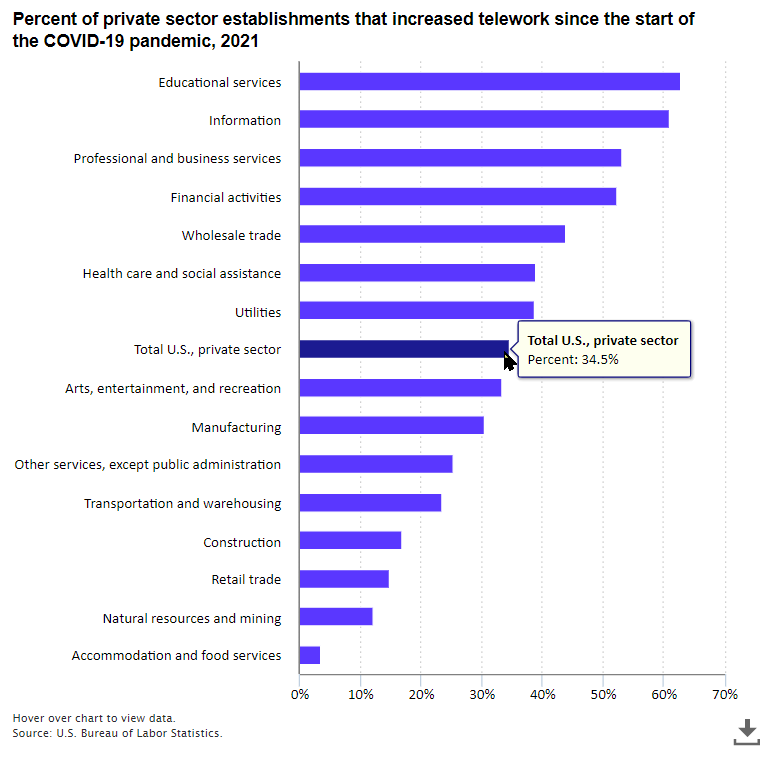
After the start of the COVID-19 pandemic, 34.5 percent of private-sector establishments in the United States increased telework for some or all employees in 2021. Among establishments that increased telework, 60.2 percent expected the increase in telework to continue after the pandemic ends. read more »
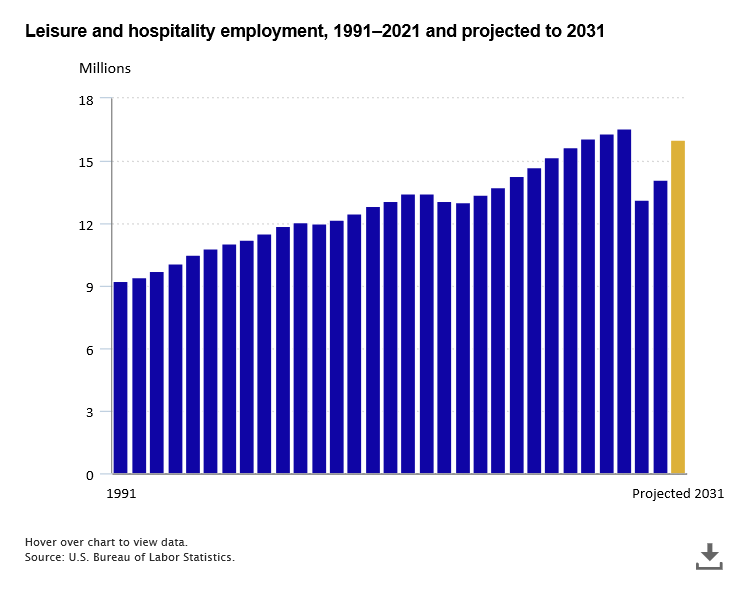
The Bureau of Labor Statistics projects the U.S. economy to add 8.3 million jobs from 2021 to 2031. Of those, 1.9 million jobs—23.1 percent of all new jobs projected—are expected to be in leisure and hospitality. That is a large projected increase for a sector that made up 8.9 percent of total employment in 2021. This rapid projected growth—the fastest of any sector, at an annual rate of 1.3 percent—results from the recovery following the COVID-19 pandemic. read more »
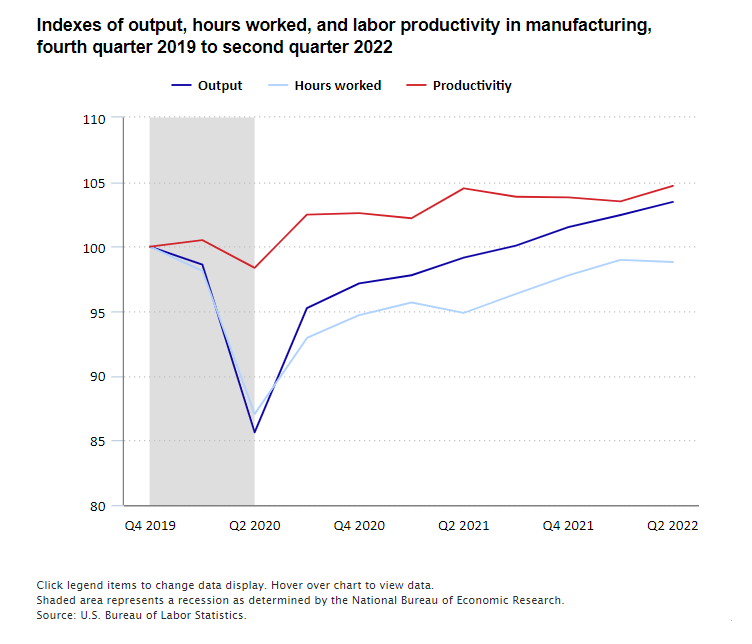
Manufacturing output has continued to grow steadily through the second quarter of 2022 and was 3.5 percent above the level in the fourth quarter of 2019, the last quarter not affected by the COVID-19 pandemic. Hours worked in manufacturing have recovered to within 1.2 percent of the level in the fourth quarter of 2019. Labor productivity in manufacturing was 4.7 percent higher in the second quarter of 2022 than in the fourth quarter of 2019. read more »
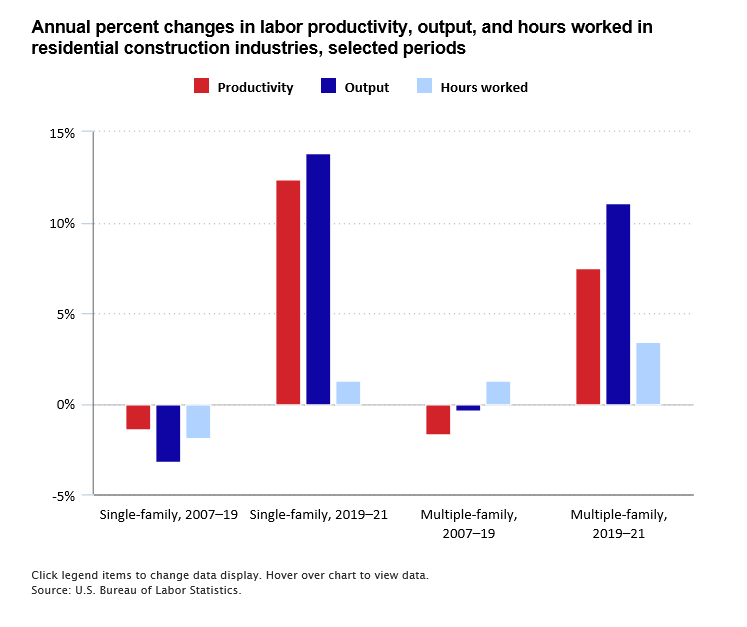
Labor productivity rose in both residential construction industries over the 2019–21 period. In single-family residential construction, productivity increased by an annual average of 12.4 percent, as output growth (+13.8 percent) outpaced growth in hours worked (+1.3 percent). In multiple-family residential construction, productivity rose by an average of 7.5 percent, as output grew faster (+11.1 percent) than hours worked (+3.4 percent). read more »
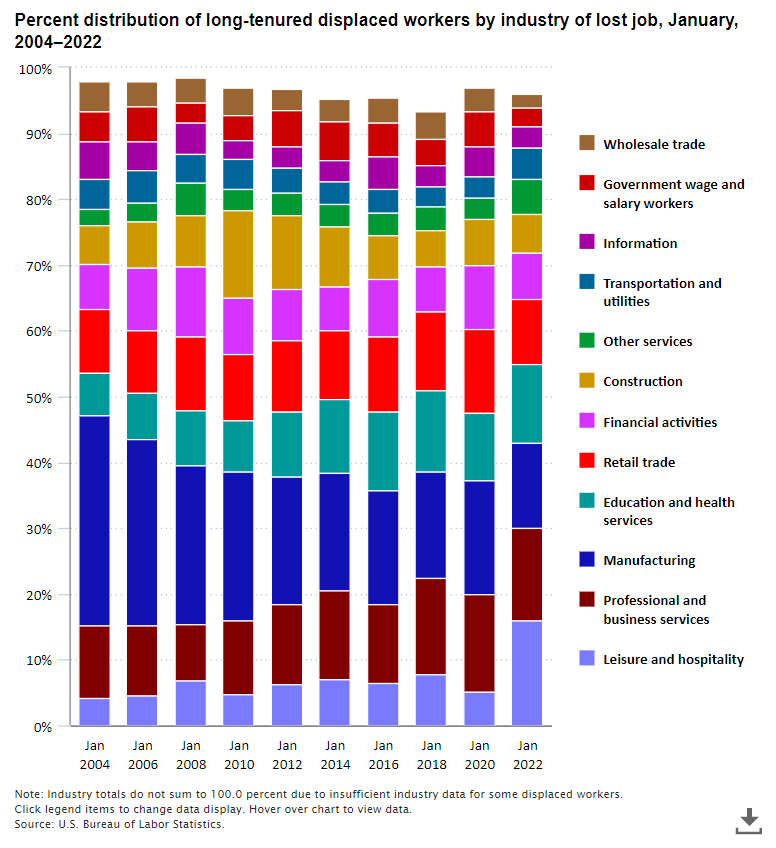
From January 2019 through December 2021, 3.6 million workers were displaced from jobs they had held for at least 3 years. This was up by 924,000 workers from the prior survey covering January 2017 to December 2019. In January 2022, 65 percent of workers displaced from 2019 to 2021 were reemployed, down from 70 percent in January 2020. From 2019 to 2021, 574,000 long-tenured workers in leisure and hospitality were displaced from their jobs, up 434,000 from the 2017–19 period. read more »
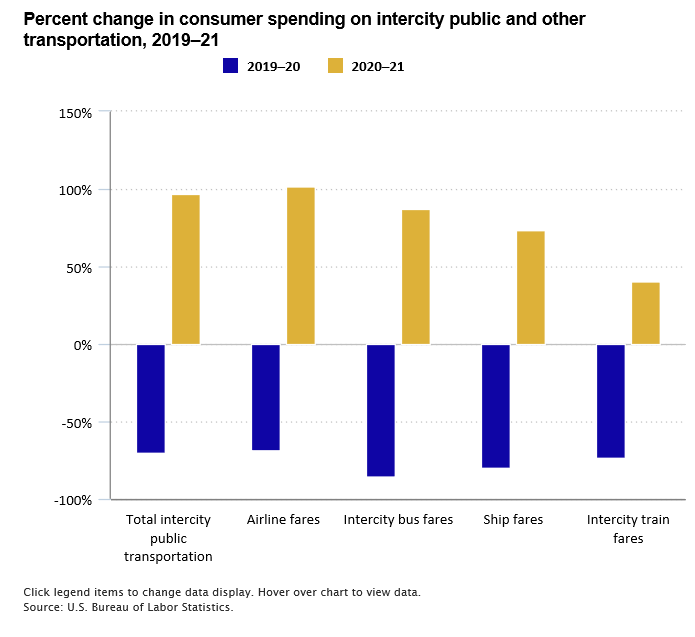
Consumer spending on public and other transportation rose 72 percent in 2021, after declining 66 percent in 2020. Despite the increase in 2021, consumer spending on intercity public transportation remained below the levels of 2019, the last year before the COVID-19 pandemic. Consumer spending for airline fares rose 101.4 percent in 2021, after falling 68.8 percent in 2020. read more »
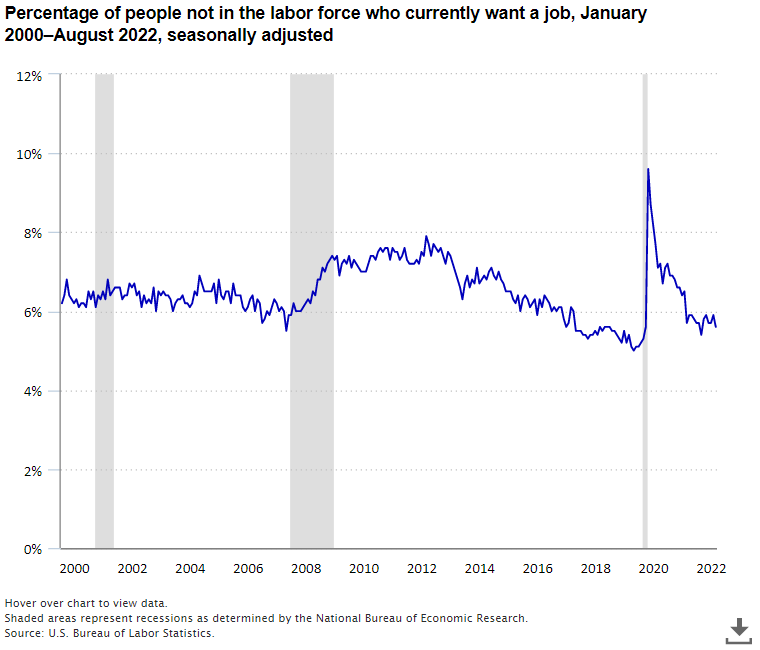
In August 2022, 99.4 million people in the United States were counted as not in the labor force, meaning they were neither employed nor unemployed. Of this number, 5.5 million, or 5.6 percent, wanted a job. These people were not counted as unemployed because they were not actively looking for work during the 4 weeks preceding the survey or were unavailable to take a job. This measure remained above its February 2020 level of 5.0 million, or 5.3 percent, before the COVID-19 pandemic. read more »
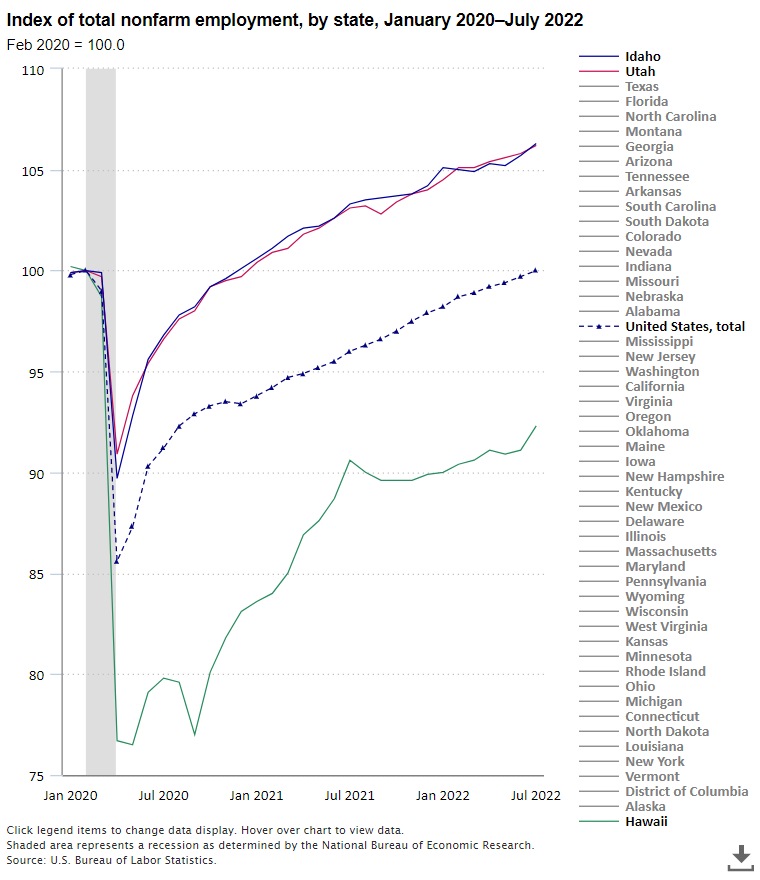
In July 2022, there were 18 states that were at or above 100 percent of their employment levels of February 2020, the month before the start of the COVID-19 pandemic and the recession that resulted from it. The remaining 32 states and the District of Columbia had nonfarm employment levels lower than their pre-recession levels. read more »
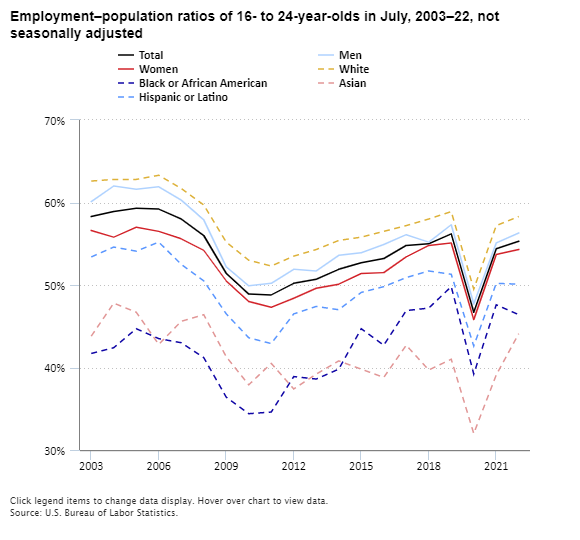
In July 2022, there were 21.0 million employed 16- to 24-year-olds. Between April and July, the number of employed youths rose by 2.1 million, or 11.4 percent. The employment–population ratio for youth—the proportion of the 16- to 24-year-old population with a job—was 55.3 percent in July 2022, an increase of 0.9 percentage point from the prior year. read more »
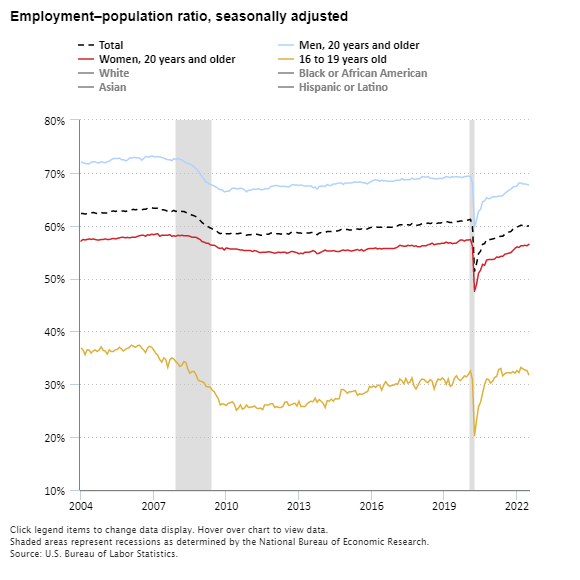
The employment–population ratio—the proportion of the population that is employed—was 60.0 percent in July 2022 for people age 16 and older. The July 2022 ratio remains below its value just before the pandemic in February 2020 (61.2 percent). read more »
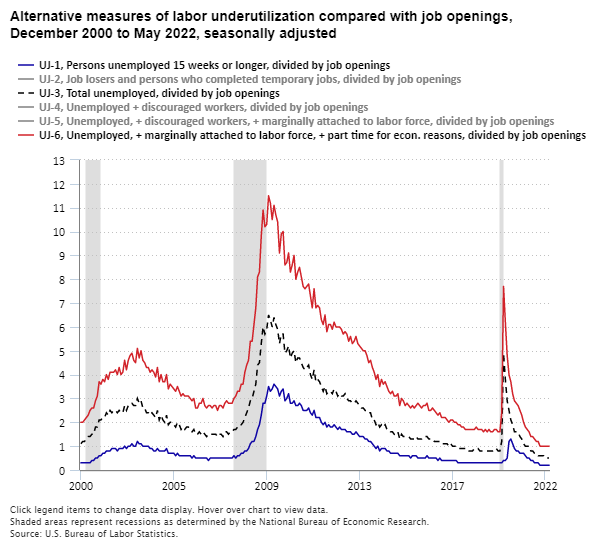
For a broader perspective on the supply of and demand for labor, we can compare alternative measures of labor underutilization to the number of job openings. The unemployed-to-job-openings ratio was 0.5 in May 2022. The narrowest ratio was 0.2 in May 2022, while the broadest ratio was 1.0. read more »
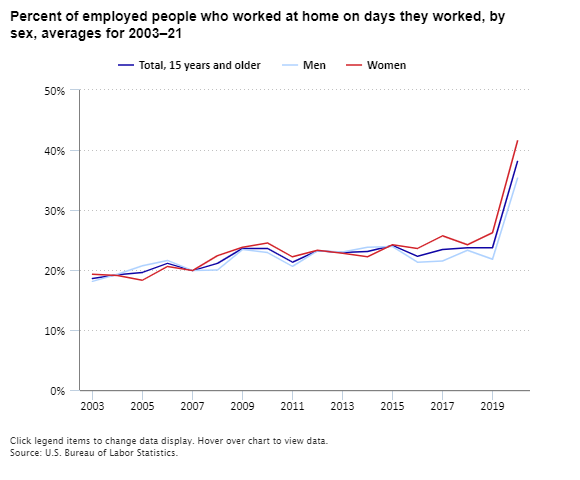
Employed women were more likely than employed men to work at home on days they worked in 2021. Both groups were more likely to work at home in 2021 than they were in 2019, before the COVID-19 pandemic began. Employed women and men were equally likely to work at home in 2003. read more »
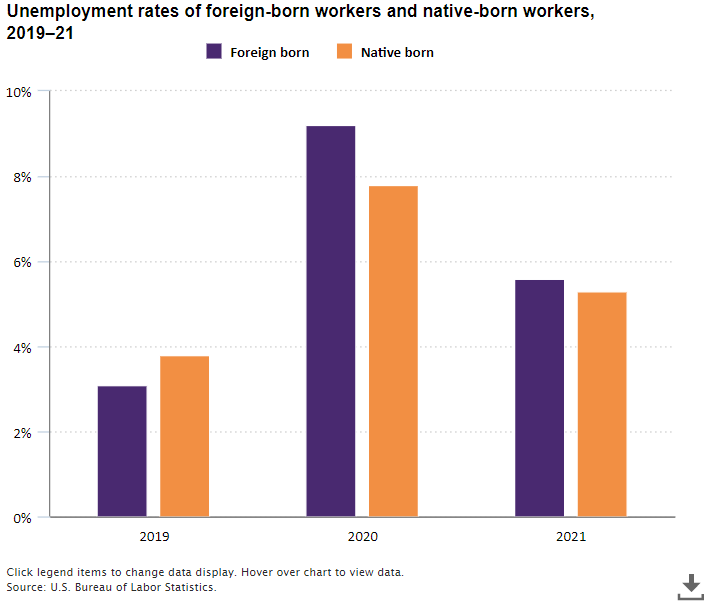
The unemployment rate for foreign-born workers decreased from 9.2 percent in 2020 to 5.6 percent in 2021. The unemployment rate for native-born workers followed a similar pattern, declining from 7.8 percent in 2020 to 5.3 percent in 2021. In 2021, both unemployment rates remained above their pre-pandemic rates in 2019. read more »
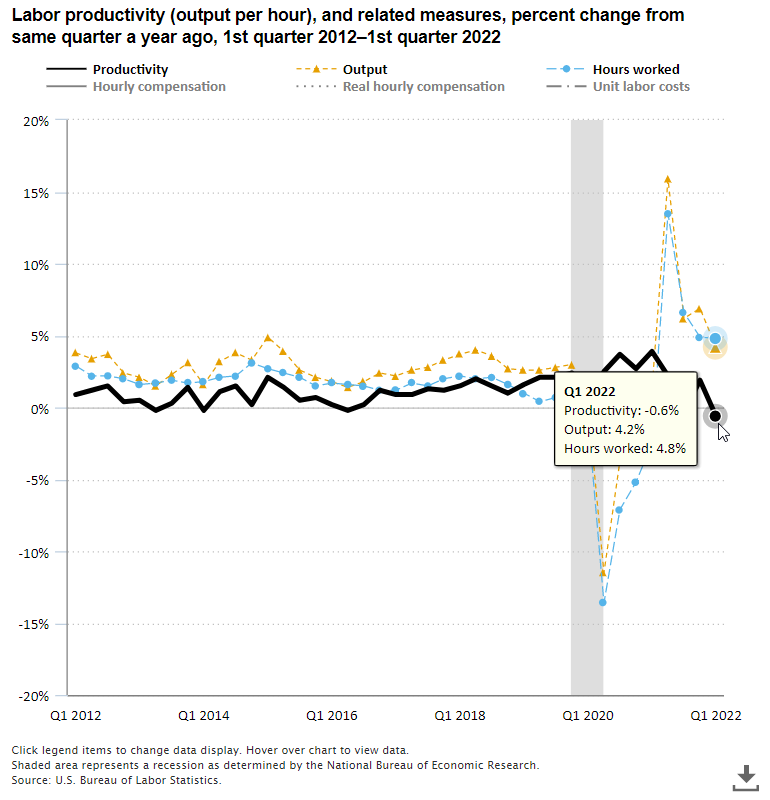
From the first quarter 2021 to the first quarter 2022, nonfarm business sector labor productivity decreased 0.6 percent, reflecting a 4.2-percent increase in output that was outpaced by a 4.8-percent increase in hours worked. This is the largest over-the-year decline since the fourth quarter of 1993, when the measure also declined 0.6 percent. read more »
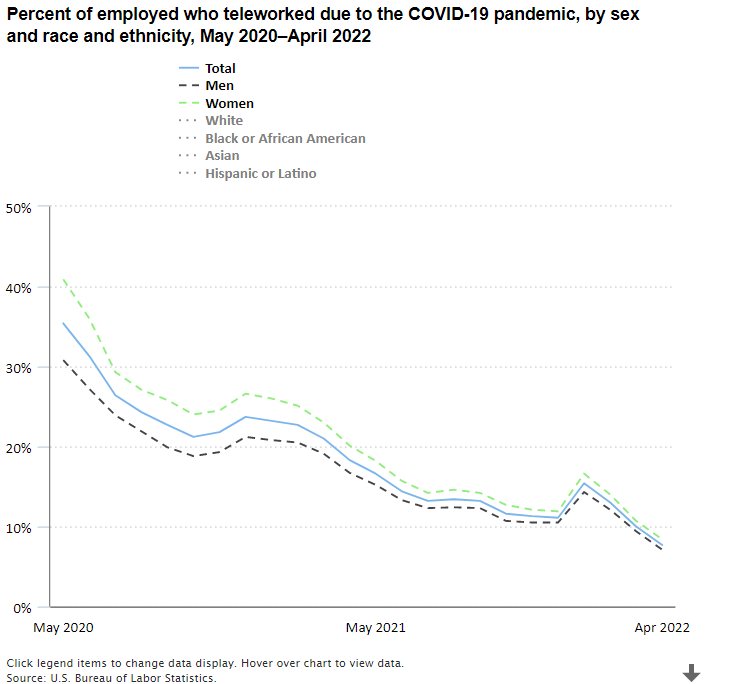
In April 2022, 7.7 percent of employed people teleworked or worked at home for pay because of the COVID-19 pandemic, down 2.3 percentage points from March 2022. In May 2020, when the data were first collected, 35.4 percent of employed people teleworked because of the pandemic and has since trended down. read more »
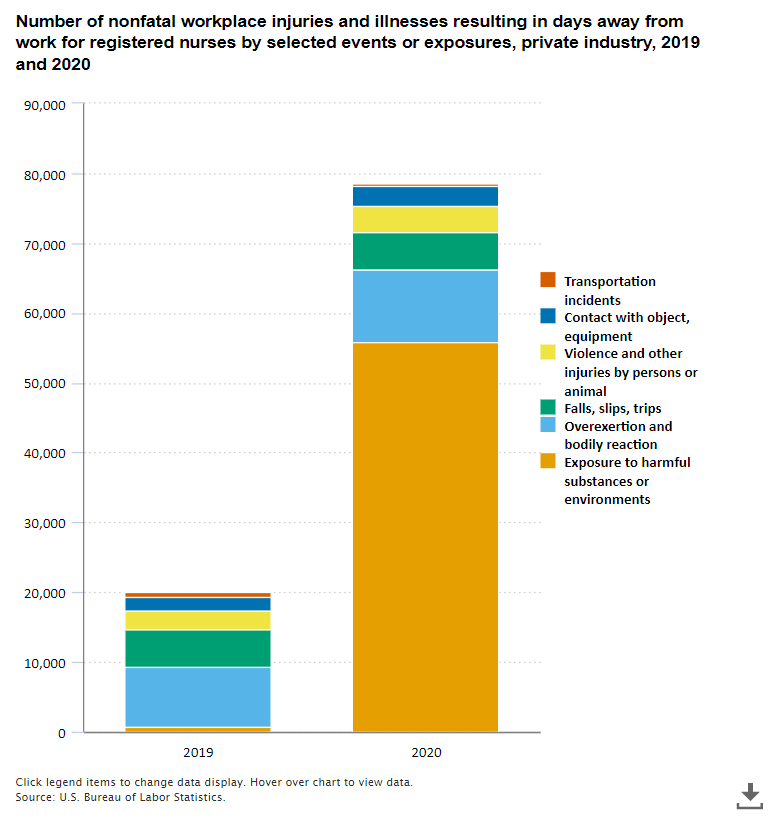
In 2020, there were 78,740 cases of nonfatal workplace injuries and illnesses that resulted in at least one day away from work among registered nurses in private industry. This was a 290.8 percent increase, about four times as many cases, compared with 2019, when there were 20,150 such cases. read more »
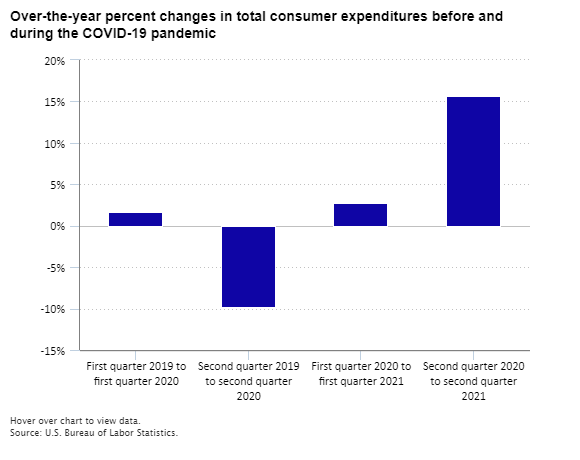
After the COVID-19 pandemic began, consumer spending in the second quarter of 2020 was down 9.8 percent from the same period in 2019. One year later, in the second quarter of 2021, the pandemic was still affecting the economy, but businesses and consumers had begun to adapt. That resulted in consumer expenditures that were 15.7 percent higher in the second quarter of 2021 than a year earlier. read more »
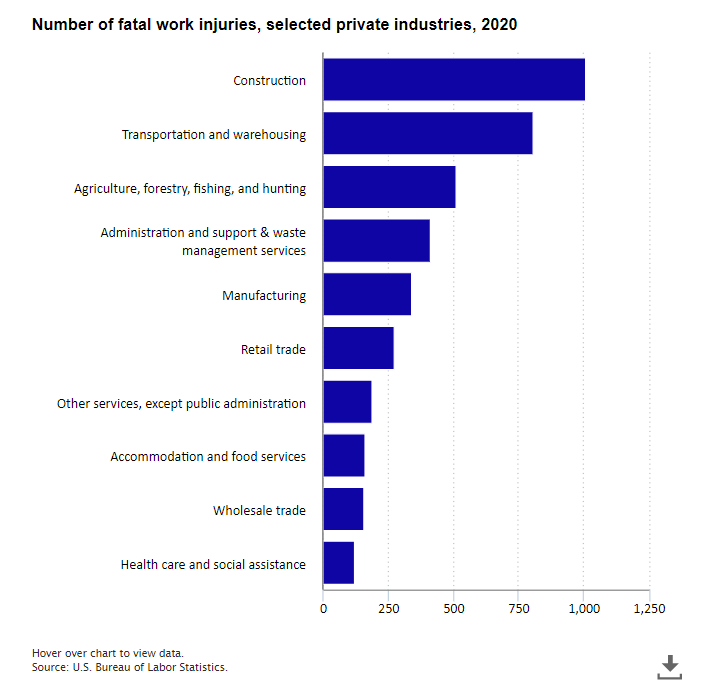
Workers’ Memorial Day, a day of remembrance for workers killed, disabled, or injured on the job, is observed annually on April 28. In 2020, 4,764 workers in the United States suffered fatal work injuries. Over that period, the private construction industry accounted for 1,008 deaths, or 21.2 percent of total deaths. This was followed by transportation and warehousing with 805 deaths, or 16.9 percent of total deaths. read more »
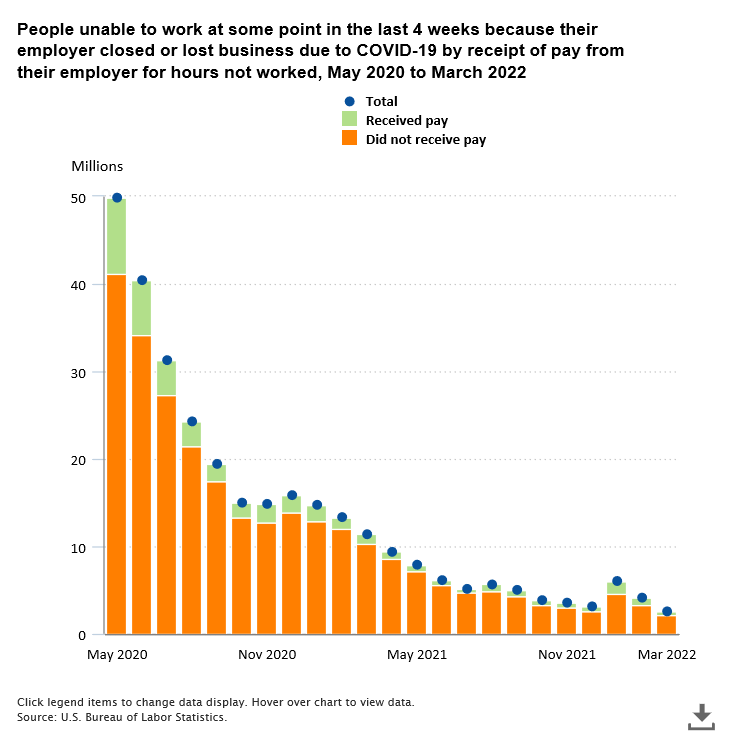
In March 2022, 2,514,000 people did not work at all or worked fewer hours at some point in the 4 weeks preceding the survey because their employer closed or lost business due to COVID-19. This number is down from 4,201,000 people in February 2022. read more »
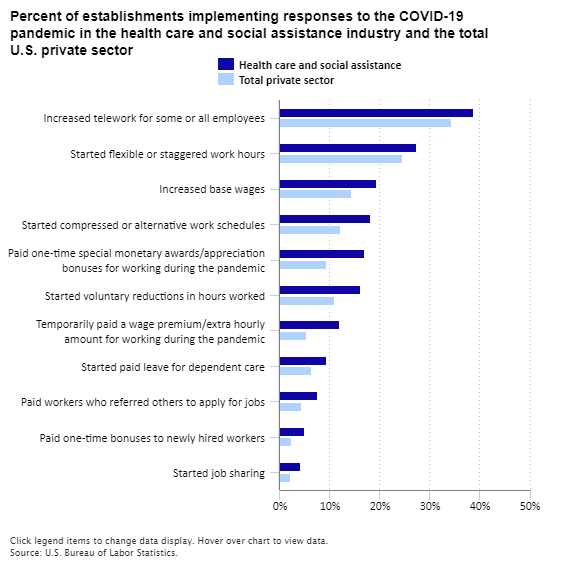
Health care and social assistance employed 20 million private-sector workers in 2021. Employees in this industry have been on the front lines of the COVID-19 pandemic for more than 2 years. In response to the pandemic, establishments in health care and social assistance increased pay and added workplace flexibilities more frequently than establishments in the private sector overall. read more »
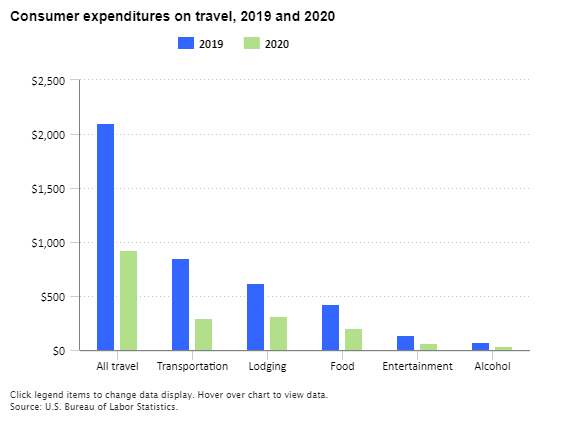
The average household spent about $2,100 on travel in 2019. With the start of the COVID-19 pandemic in 2020, this average dropped to $926 for the year, a decrease of 56 percent. Within the travel budget, the sharpest decline—in both dollars and percent terms—was in transportation. read more »
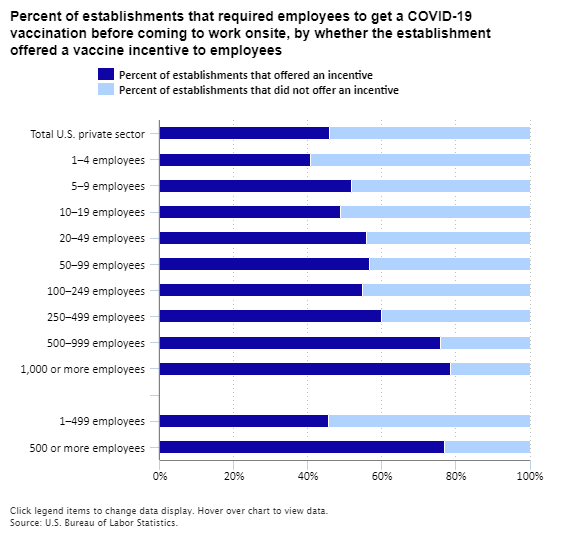
COVID-19 vaccinations were required for some or all employees before coming to work onsite at 17.5 percent of U.S. establishments. Among these establishments, 45.9 percent offered vaccination incentives to their employees. Incentives included financial incentives, paid time off, or permitting employees to remain on the clock to get a COVID-19 vaccination. read more »
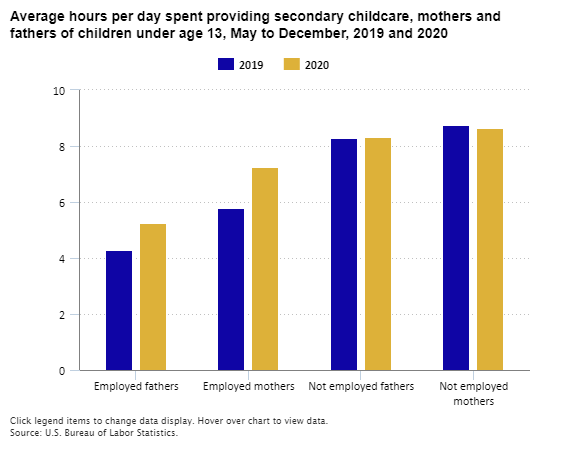
Mothers who were employed spent 7.3 hours per day during the pandemic in 2020 providing secondary childcare. Secondary childcare is when parents had at least one child under age 13 in their care while doing activities other than primary childcare. This was up by 1.5 hours per day from 2019. read more »
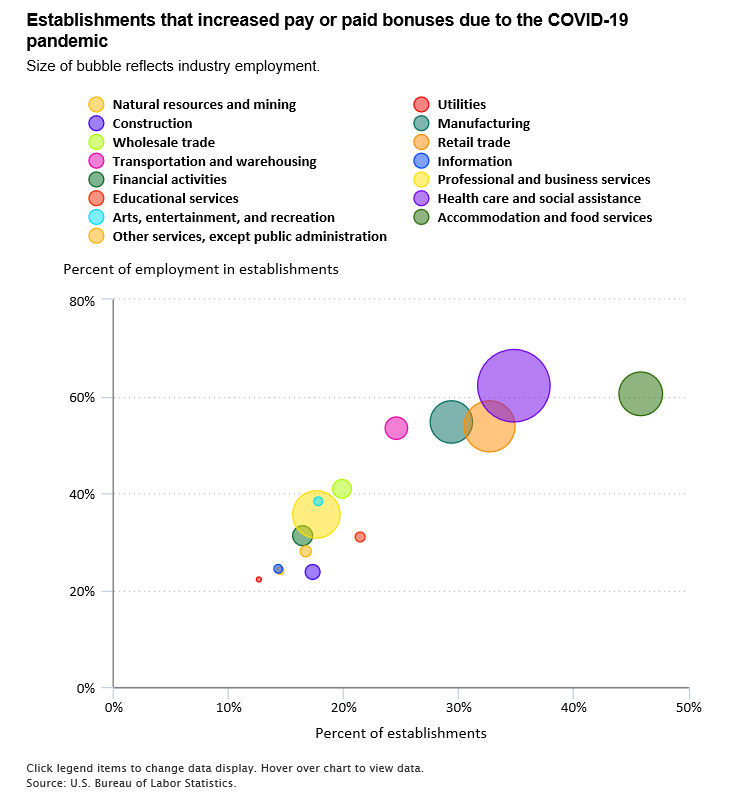
Nearly one quarter of U.S. private-sector businesses, employing 54 million workers, increased wages and salaries, paid wage premiums, or paid bonuses because of the COVID-19 pandemic. read more »
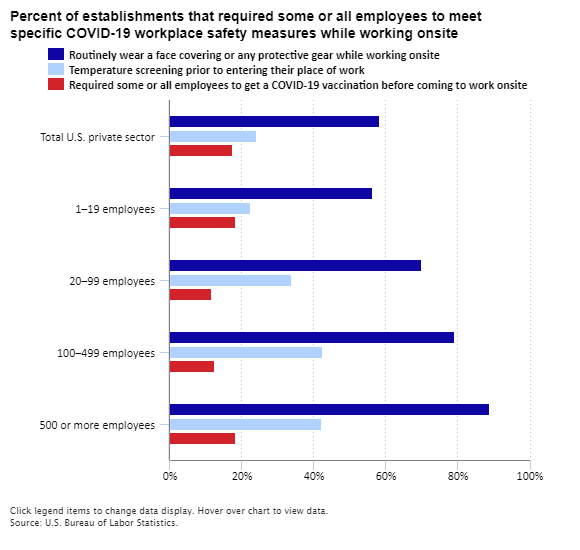
Fifty-eight percent of U.S. private-sector establishments required face coverings or protective gear for employees while working onsite during the COVID-19 pandemic. Twenty-four percent of establishments required temperature screenings before employees could enter their workplace, and 17.5 percent required a COVID-19 vaccination before coming to work onsite. read more »
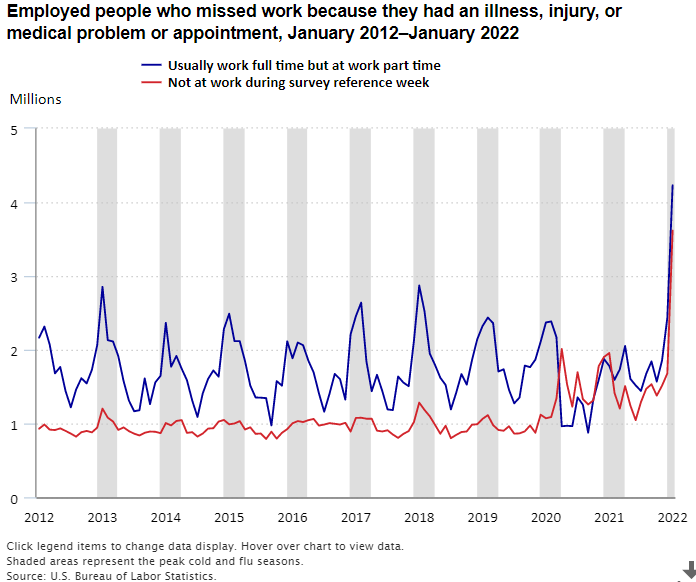
About 7.8 million workers missed work in January 2022 because they had an illness, injury, or medical problem or appointment, up from 3.7 million in January 2021. About 4.2 million who usually work full time worked part time because of an illness, injury, or medical problem or appointment, up from 1.8 million in January 2021. read more »
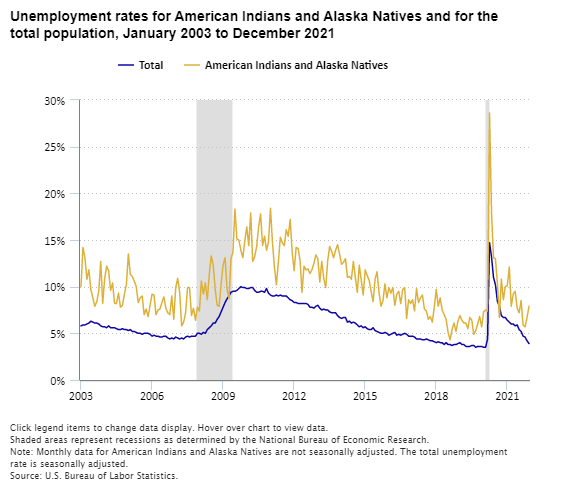
The unemployment rate for American Indians and Alaska Natives has declined since April 2020 and was 7.9 percent in December 2021. That rate was still much higher than the rate of 3.9 percent for the overall population. read more »
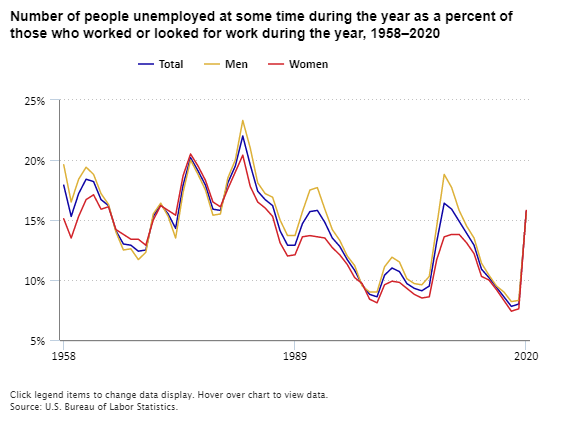
The work-experience unemployment rate (those looking for work during the year as a percent of those who worked or looked for work during the year) nearly doubled, increasing from 8.0 percent in 2019 to 15.7 percent in 2020. This is the highest rate since 2010, when it was 15.9 percent. read more »
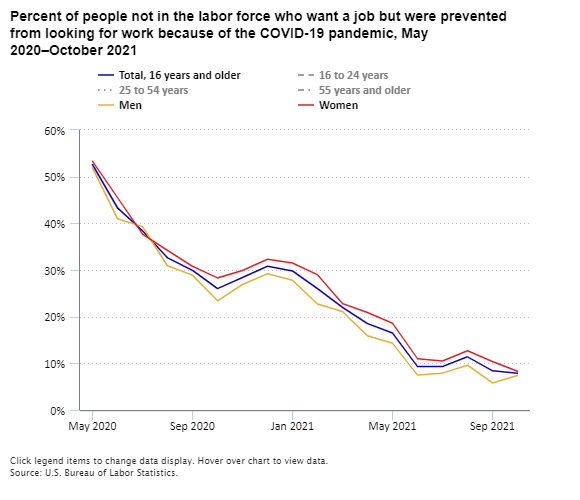
In October 2021, 7.9 percent of people who were not in the labor force but wanted to work were prevented from looking for a job because of the COVID-19 pandemic. This was down from 52.6 percent in May 2020. read more »
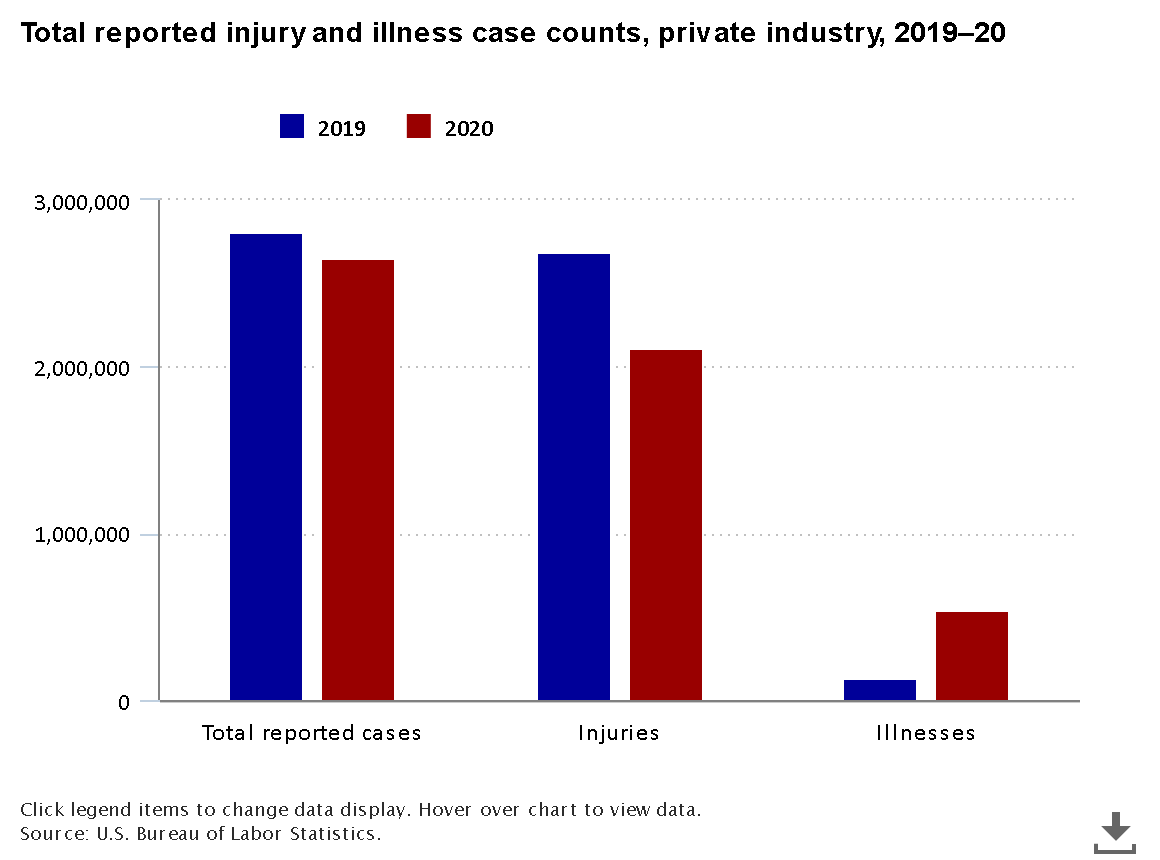
There were 2.7 million nonfatal workplace injuries and illnesses reported by private industry employers in 2020, down from 2.8 million in 2019, a decrease of 5.7 percent. read more »
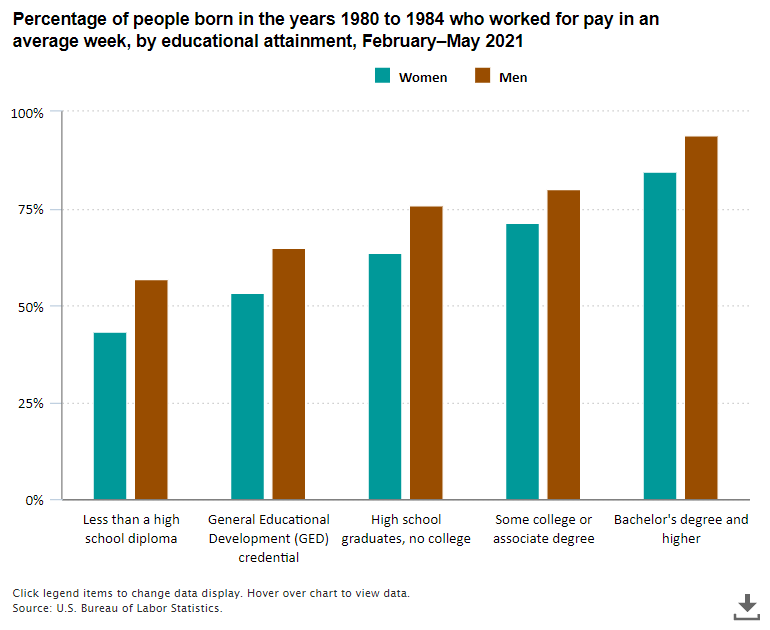
The higher their education level, the more likely people born in the years 1980 to 1984 were to work for pay or profit in an average week from February to May 2021. At each level of education, men were more likely to work than women. Both men and women with higher levels of education were more likely to work from home at least some of the time than those with lower levels of education. read more »
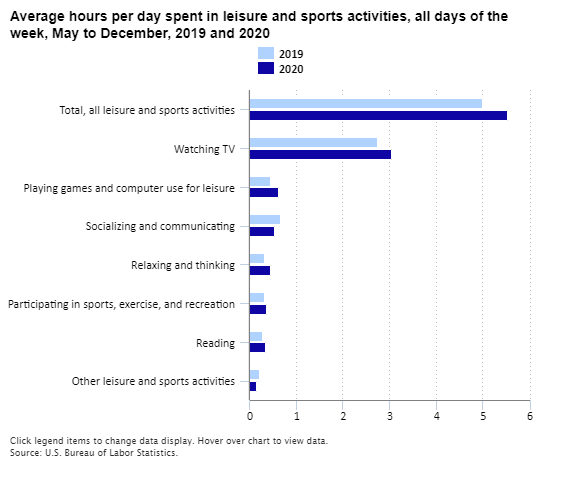
During the COVID-19 pandemic in 2020, people age 15 and older spent 32 minutes more per day in leisure and sports activities than they did in 2019—5.5 hours compared with 5.0 hours. read more »
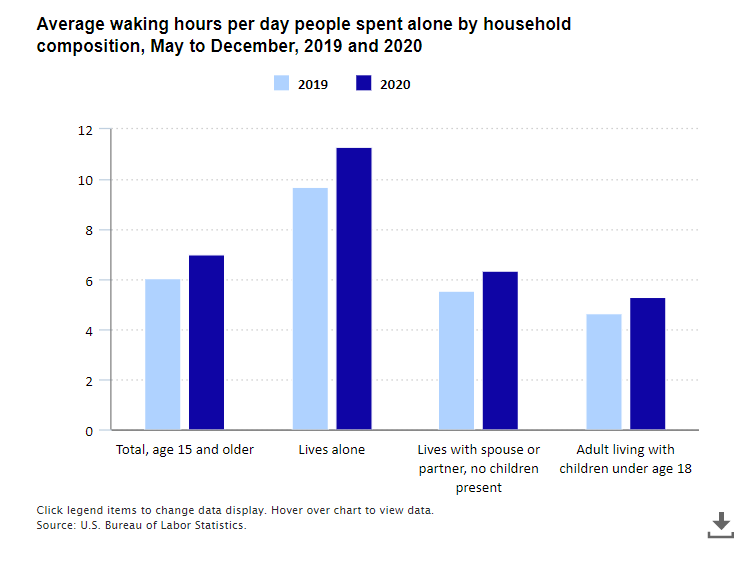
In 2020, during the COVID-19 pandemic, people were encouraged to stay at home and practice social distancing. During their waking hours, people age 15 and older spent an average of about 1 hour more per day alone in 2020 (7.0 hours) than they did 2019 (6.1 hours). read more »
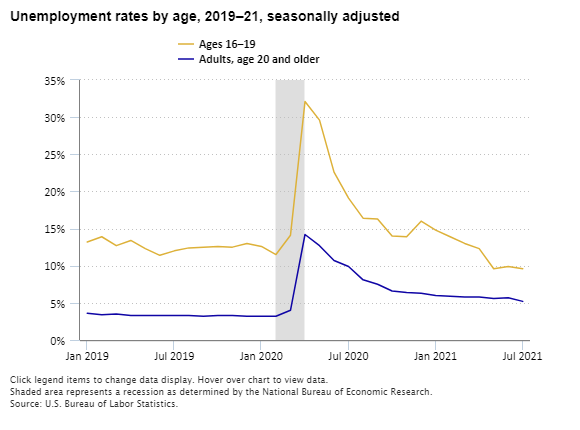
The unemployment rate for teenagers (ages 16 to 19) was 9.6 percent in July 2021, following rates of 9.9 percent in June and 9.6 percent in May. The last time the unemployment rate for teenagers was lower than 9.6 percent was in November 1953, when it was 8.6 percent. read more »
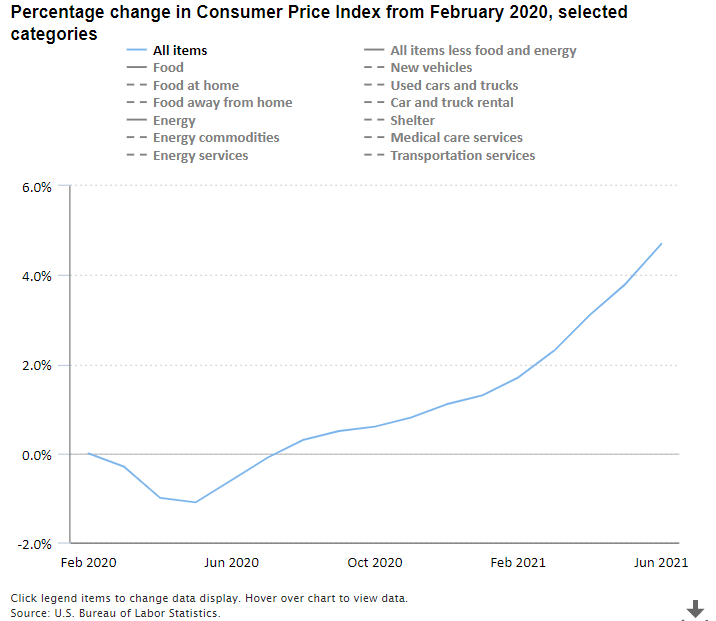
The Consumer Price Index for All Urban Consumers increased 5.4 percent, not seasonally adjusted, from June 2020 to June 2021, the largest 12-month advance since the year ended August 2008. Consumer prices increased 4.7 percent from February 2020 to June 2021. February 2020 was the last month before the COVID-19 pandemic began. read more »
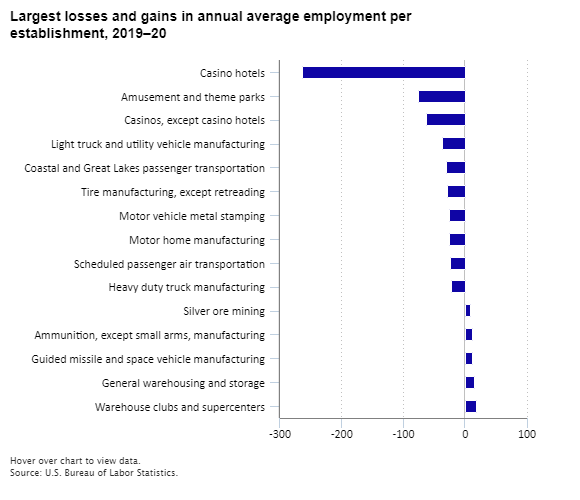
With the start of the COVID-19 pandemic in 2020, annual average employment fell by about 1 worker per establishment over the year across all private industries in the United States. Casino hotels had the largest decrease among all private industries, losing an average of 263 jobs per establishment. read more »
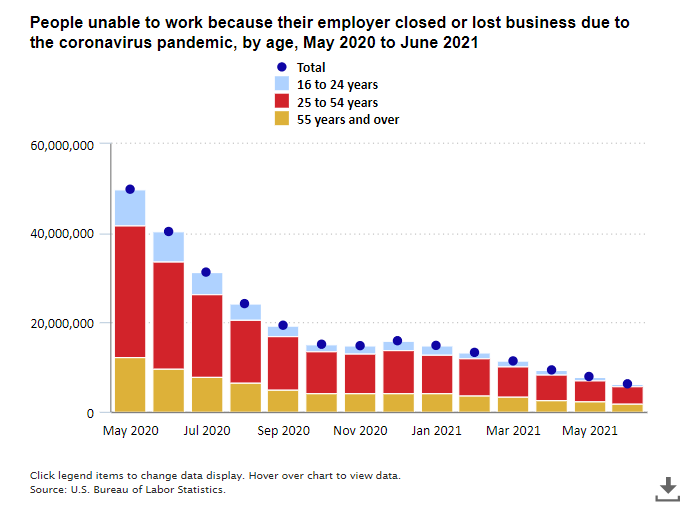
In June 2021, 6.2 million people did not work at all or worked fewer hours at some point in the last 4 weeks because their employer closed or lost business due to the coronavirus pandemic. This is down from 7.9 million in May 2021 and from 49.8 million in May 2020. read more »
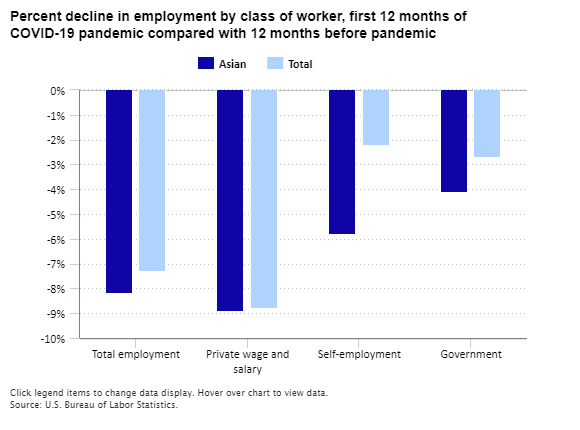
Employment fell more sharply for Asians during the COVID-19 pandemic than for other population groups. Comparing average employment levels for the 12 months before the pandemic to the average for the 12 months following the onset of the pandemic (the year ending February 2021), Asian employment declined by 8.2 percent. This was larger than the 7.3-percent decline for the overall population. read more »
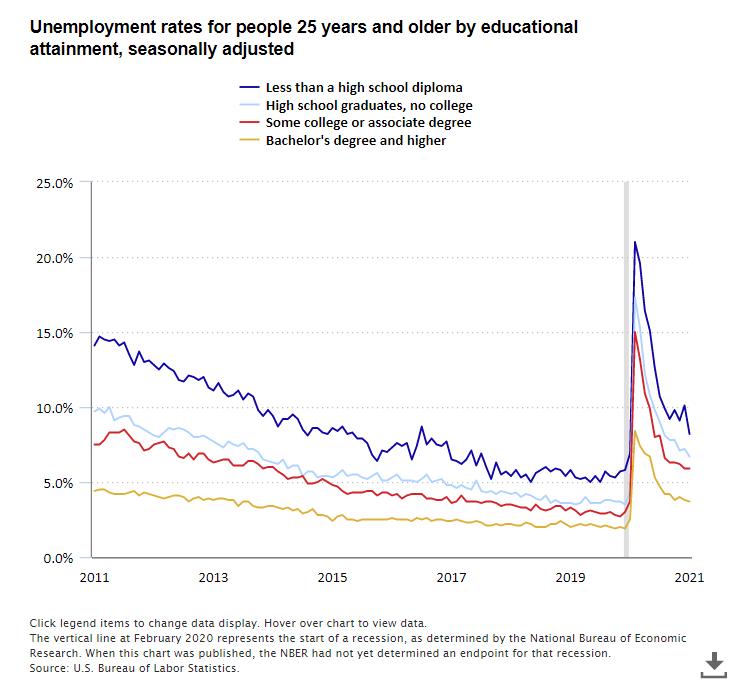
The unemployment rate edged down to 6.0 percent in March 2021. The rate is down considerably from its recent high in April 2020 but is 2.5 percentage points higher than before the pandemic in February 2020. For those with a bachelor’s degree and higher, the unemployment rate was 3.7 percent in March, down from a high of 8.4 percent in April 2020. read more »
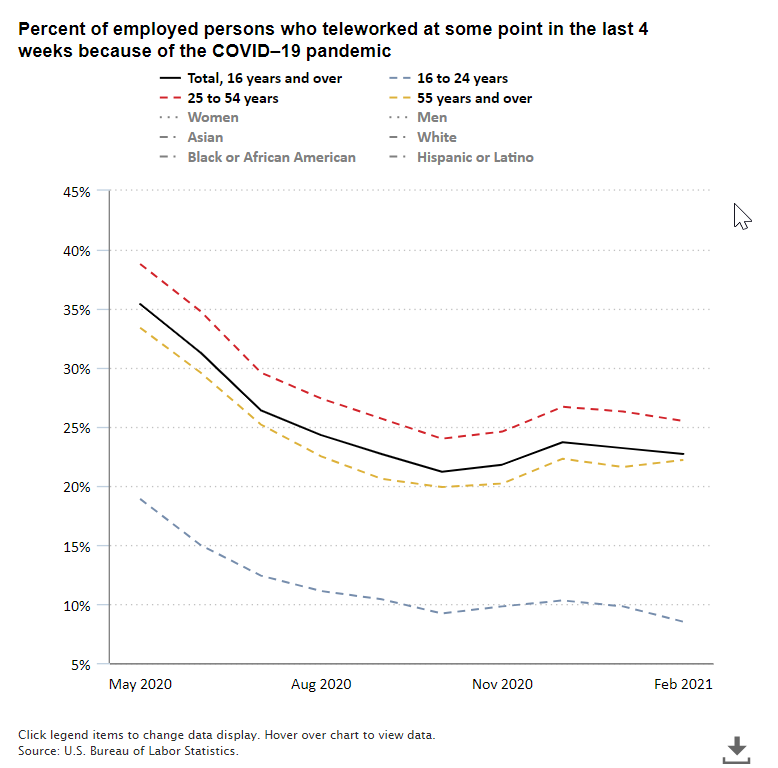
Nearly 1 in 4 people (22.7 percent) employed in February 2021 teleworked or worked at home for pay because of the COVID-19 pandemic. This is down from 35.4 percent in May 2020, the first month these data were collected. read more »
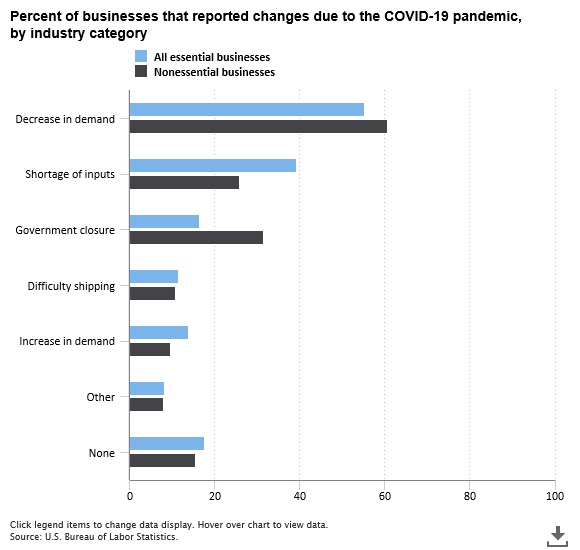
We use a list of pandemic-essential industries from the Centers for Disease Control and Prevention to classify essential businesses during the COVID-19 pandemic. Among essential businesses, 16.5 percent were subject to government-mandated closures from July through September 2020. That compares with 31.5 percent of nonessential businesses. read more »
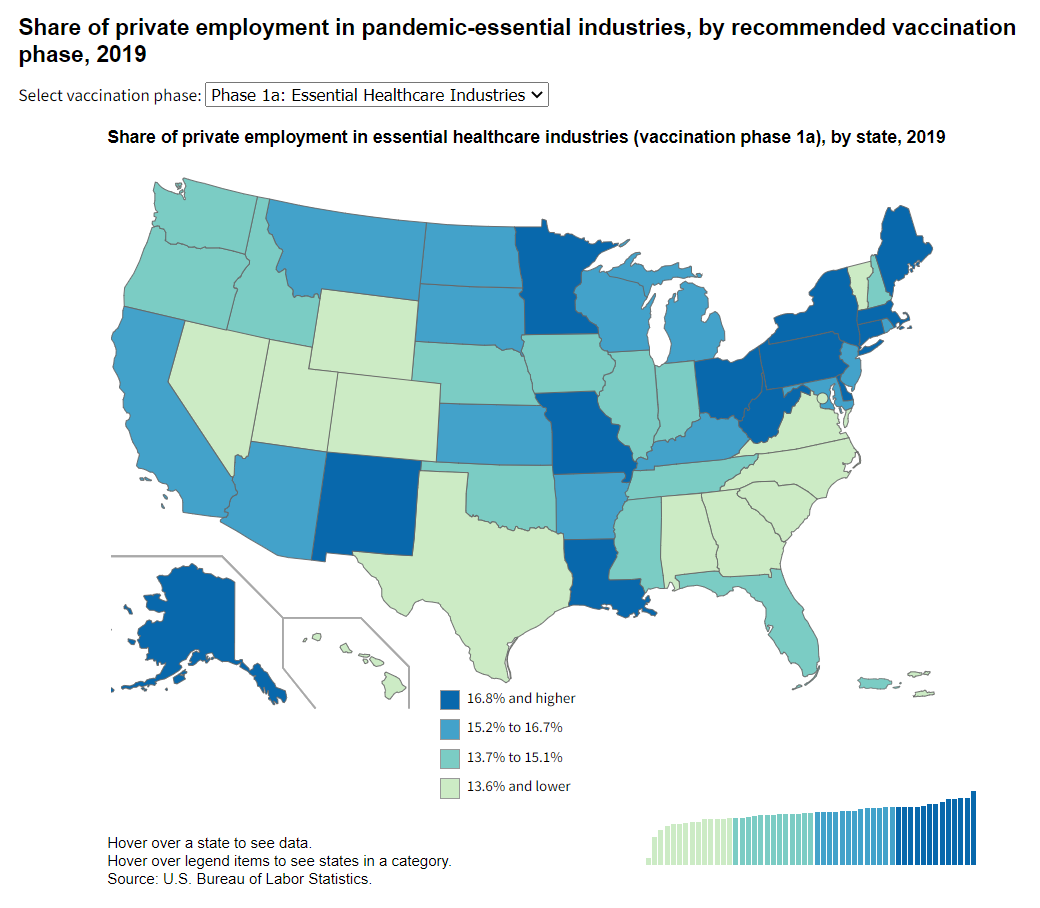
We have used a list of pandemic-essential industries from the Centers for Disease Control and Prevention to count the number of workers in “essential industries” in all 50 states, the District of Columbia, Puerto Rico, and the U.S. Virgin Islands. Just before the Covid-19 pandemic, in 2019 the United States had an average annual private employment of 107.5 million in essential industries. read more »
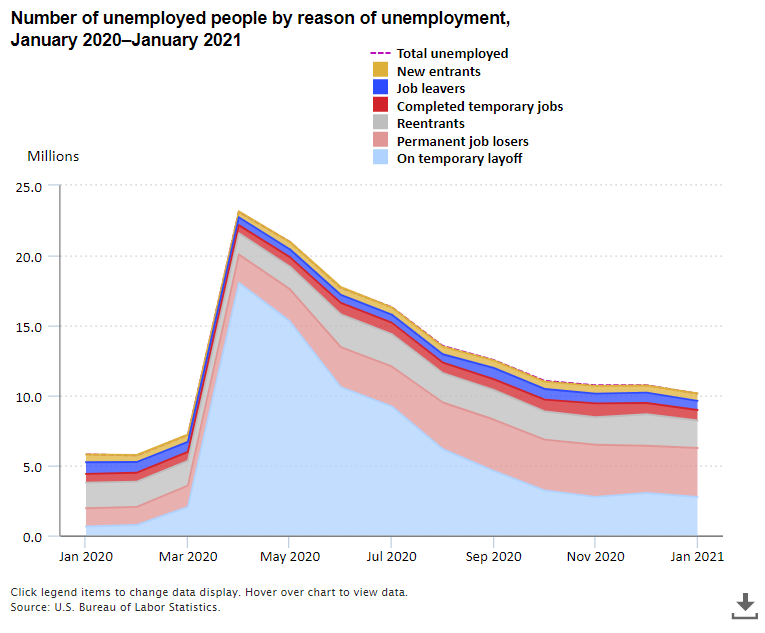
With the onset of the COVID-19 pandemic, the United States declared a national emergency in March 2020. Unemployment rose by 1.5 million in March, with a large increase in the number of job losers on temporary layoff—that is, those who were given a date to return to work or expected to return to work within 6 months. Before the pandemic, this group accounted for just over one-tenth of the total unemployed but expanded to more than one-fourth in March. read more »
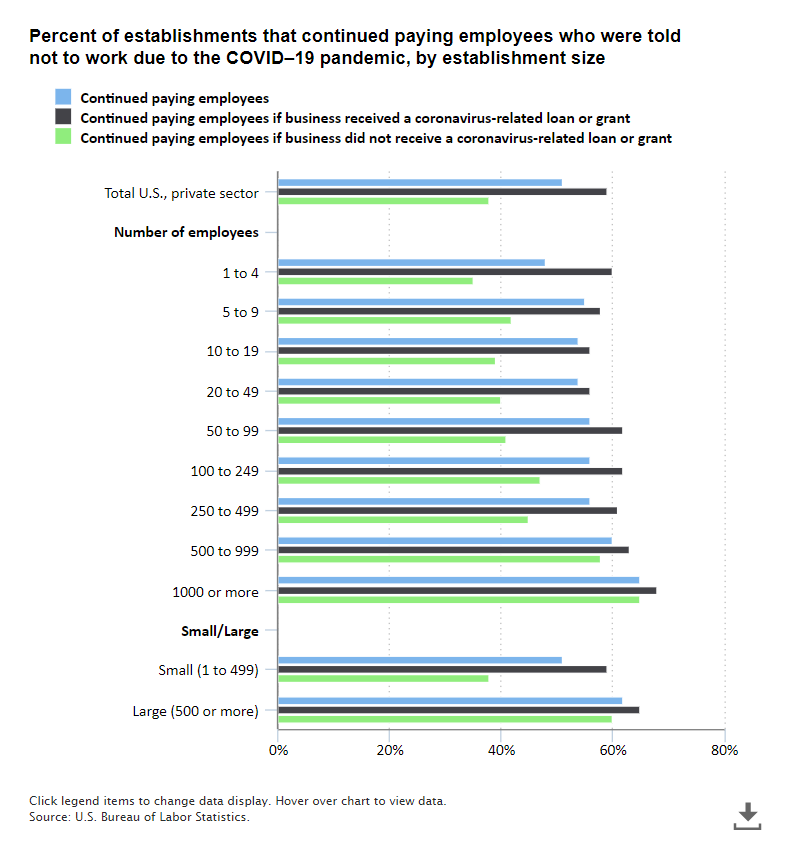
Since January 1, 2020, about half of U.S. business establishments continued to pay at least some of their employees told not to work due to the COVID–19 pandemic. Larger businesses, those with 500 or more employees, continued to pay at least some of their employees told not to work at a higher rate (62 percent) than smaller businesses (51 percent). read more »
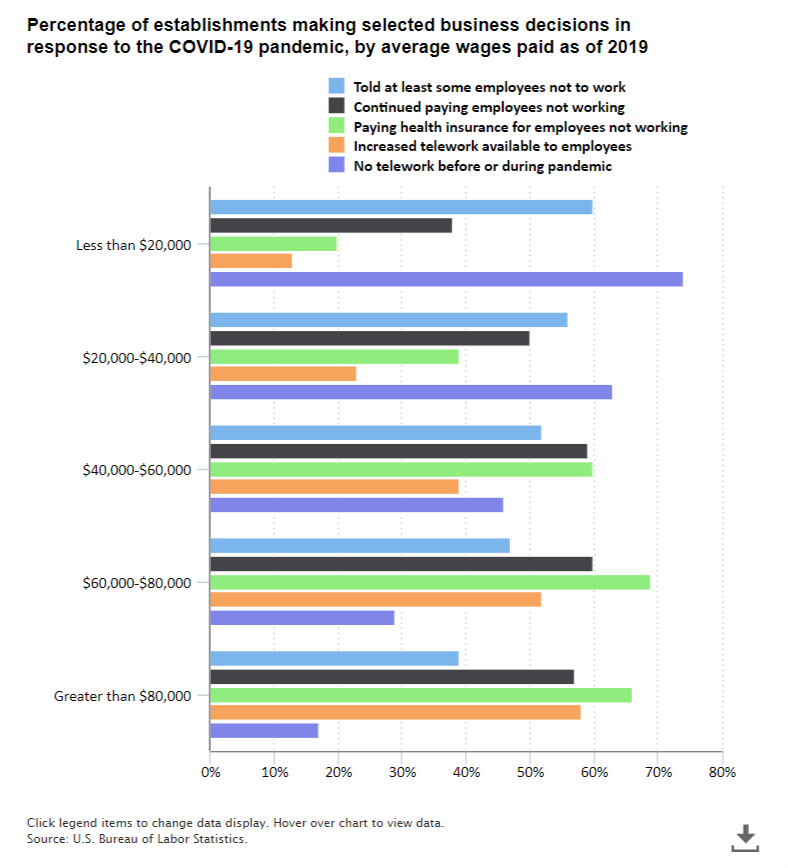
Many U.S. businesses have changed their operations and employment because of the COVID-19 pandemic. Since January 1, 2020, 60 percent of establishments in which workers were paid an average annual wage of less than $20,000 in 2019 told at least some employees not to work. This compared with 39 percent of establishments paying an average wage greater than $80,000. read more »
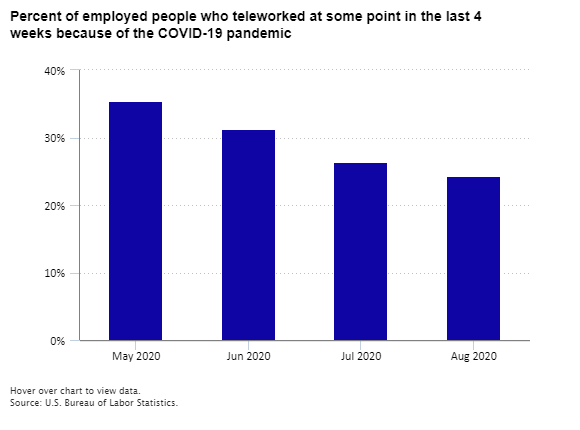
About 1 in 4 people employed in August 2020 teleworked or worked from home for pay because of the COVID-19 pandemic. The 24 percent of workers who teleworked in August was down from 35 percent in May, the first month these data were collected. read more »

This Beyond the Numbers article analyzes recent trends in telework data. It presents telework rates for many demographic and worker groups, including sex, age, race, disability status, educational attainment, occupation, and other characteristics. Additionally, it presents data on the number of hours workers teleworked. read more »

The COVID-19 pandemic brought about dramatic changes in the work environment. Although 6.5 percent of workers in the private business sector worked primarily from home in 2019, the pandemic was the start of a massive experiment in full-time remote work for most workers and firms. People often ask: are workers more productive or less productive when working from home? read more »
Have recent tax benefits meant more money in your bank account? In 2017, Congress passed the Tax Cuts and Jobs Act (TCJA), and, in 2020, Congress passed the COVID-19 pandemic relief acts, directly affecting the personal tax liabilities of many Americans. read more »
This Beyond the Numbers article discusses trends in grain prices and their ripple effects on food inflation from December 2019 to August 2022. It examines changes in food prices in the PPI, the CPI, and in the FD-ID system. read more »

This Beyond the Numbers article will describe the unemployed people per job openings ratio and examine unemployment and job openings trends by looking at estimates at the national level from December 2000 to December 2021, and at the state and regional level from December 2017 to December 2021. National data allows users to see the relationship more clearly between labor supply and demand nationwide, while state and regional data allows for comparative analysis across state labor markets. read more »

This Beyond the Numbers article examines the main long-run factors expected to contribute to demand for personal care services employment: increasing demand for personal care and appearance services, a growing customer base, and new and expanded service offerings. read more »

Before the COVID-19 pandemic in 2020, many IT jobs were already projected to be in high demand over the next decade. The pandemic has made IT workers even more important to the future economy, and the jobs projections for these occupations have increased. read more »
In an effort to understand how the COVID-19 pandemic affected labor market experience, the U.S. Bureau of Labor Statistics (BLS) National Longitudinal Survey of Youth 1997 (NLSY97) fielded a short supplemental survey to gather information from its sample members on work and working conditions, among other topics. read more »

During economic downturns, how do these measures help in analyzing price change, and what can we assume about consumption? This Beyond the Numbers article explores the final C-CPI-U during the Great Recession and the recession that occurred as a result of the COVID-19 pandemic. Additionally, the article evaluates consumer spending assumptions of the CPI-U and preliminary C-CPI-U during these recessionary periods to highlight challenges of lagged consumer spending data. read more »

This Beyond the Numbers article examines the impact of COVID-19 on firms in the air travel and accommodation (e.g., hotels) industries using the new input to industry indexes as well as the Producer Price Index (PPI) output price indexes for these industries. read more »

This is a first look at results from the stimulus payments questions, including information on changes in spending patterns due to the stimulus payments as well as shelter-in-place and lockdown orders. read more »

This Spotlight compares the labor force characteristics and experiences of workers in the for-profit, nonprofit, government, and self-employed sectors. In 2022, 69.6 percent of the employed worked in for-profit businesses, 6.5 percent worked in nonprofit organizations, 13.4 percent worked for the government, and 10.4 were self-employed. Have you wondered about how much people who work for nonprofits earn, or which groups of people are most likely to work for themselves? read more »

In 2020, the COVID-19 pandemic affected the United States profoundly. In addition to the heavy toll on health and life, the pandemic also brought significant economic challenges, such as a drastic shift in workplace culture and the highest unemployment rate since data began in 1948. This Spotlight on Statistics explores how the COVID-19 pandemic influenced the spending behaviors of urban and rural consumers. read more »

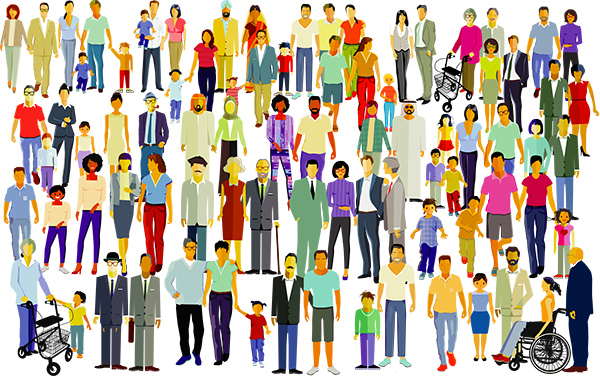
This Spotlight on Statistics compares employment before and during the COVID-19 pandemic for men and women and for different racial and ethnic groups, age groups, and other worker characteristics. read more »

October is National Disability Employment Awareness Month, and the theme in 2021 is America’s Recovery: Powered by Inclusion. COVID-19 had a large impact on the labor market for people with and without disabilities. Historical differences between these groups remain largely unchanged during the pandemic and economic recovery. This Spotlight examines changes in labor force characteristics of people with a disability during COVID-19 and the recovery through September 2021. read more »

The coronavirus pandemic impacted all sectors of the economy in 2020. Businesses across the country saw their supply chains interrupted, demand for their products and services decline, and government-mandated closures. This Spotlight on Statistics explores the pandemic’s impact across the economy with emphasis placed on varying experiences by industry and employment in those industries. The Business Response Survey to the Coronavirus Pandemic was conducted from July to September 2020 read more »