
An official website of the United States government
An official website of the United States government
The .gov means it's official.
Federal government websites often end in .gov or .mil. Before sharing sensitive information,
make sure you're on a federal government site.
The site is secure.
The
https:// ensures that you are connecting to the official website and that any
information you provide is encrypted and transmitted securely.
Crossref 0
How vulnerable employment and public health quality shape labour productivity: A comparative study of European economies, JOURNAL OF INTERNATIONAL STUDIES, 2025.
Longitudinal associations of effort and reward at work with changes in cognitive function: evidence from a national study of U.S. workers, International Archives of Occupational and Environmental Health, 2024.
Non-parametric projections of the net-income distribution for all U.S. states for the Shared Socioeconomic Pathways, Environmental Research Letters, 2023.
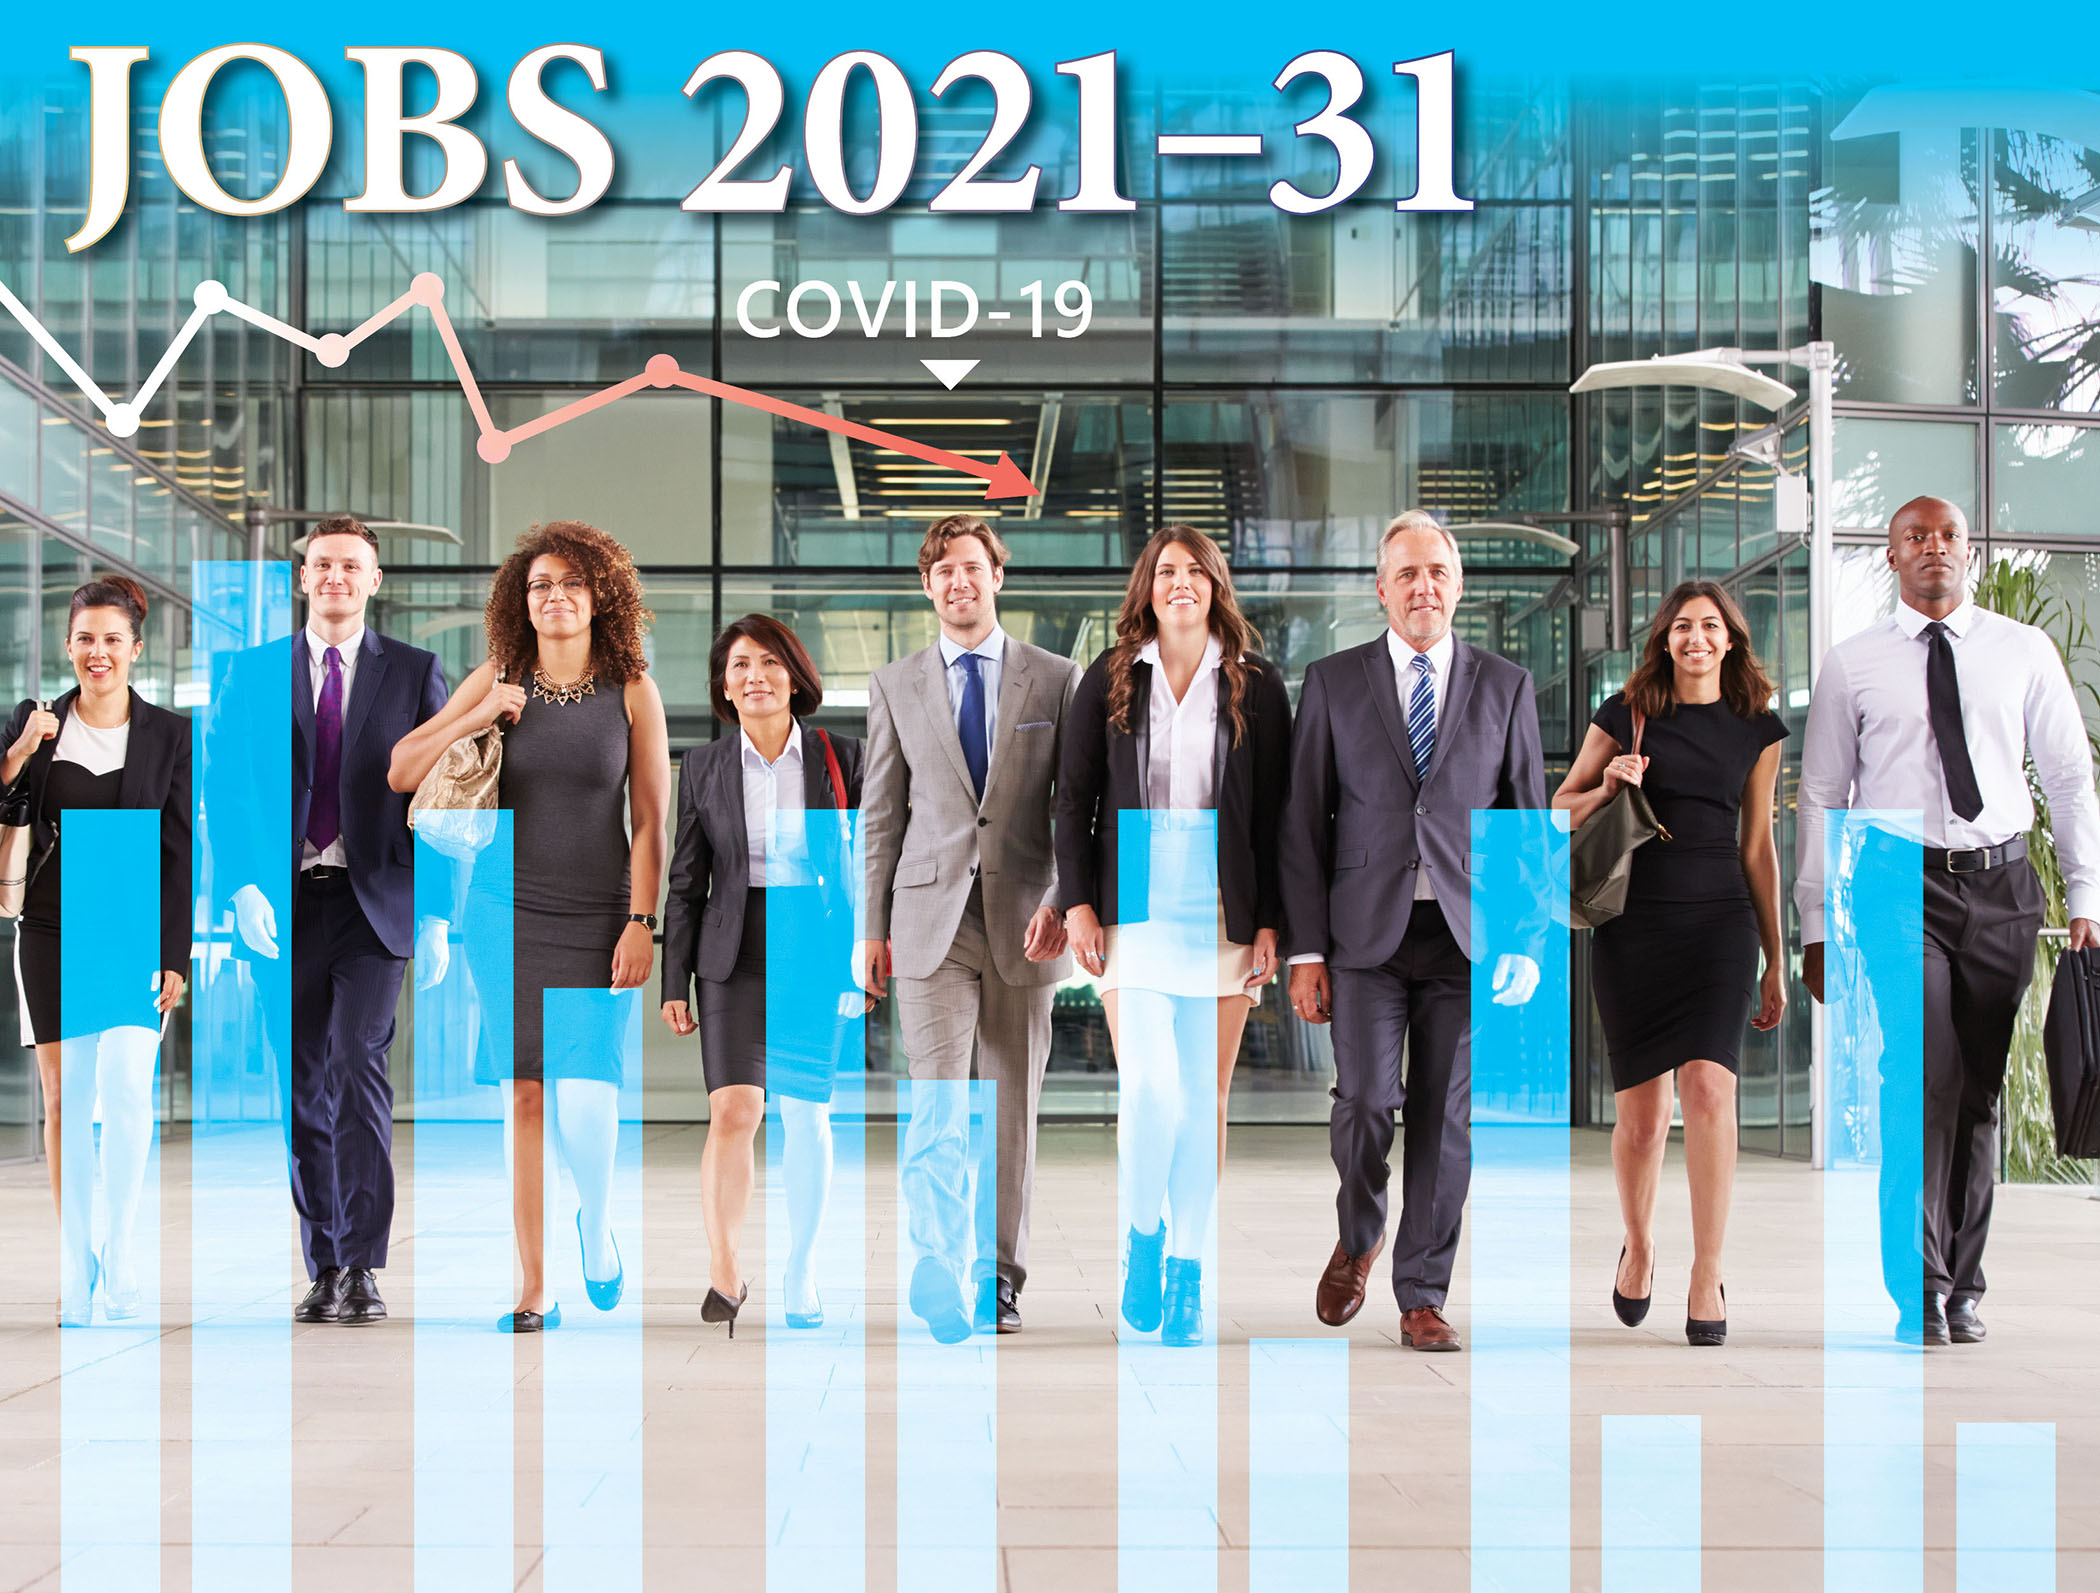
Employment and real output are projected to grow during the 2021–31 decade, reflecting both cyclical recovery from the 2020 coronavirus disease 2019 (COVID-19) pandemic-induced recession, and structural growth. About one-fourth of the population will be age 65 or older in 2031, contributing to slow projected growth in the labor force and a continued decline in the labor force participation rate. The aging population is also expected to continue to drive strong demand for a variety of healthcare services, with 2.6 million jobs projected to be added in the healthcare and social assistance sector through 2031.
The U.S. Bureau of Labor Statistics (BLS) projects 0.5-percent annual growth in employment over the 2021–31 decade, slower than the 1.0 percent growth that occurred over the 2011–21 decade.1 This growth reflects recovery from the recession associated with the coronavirus disease 2019 (COVID-19) pandemic and low base-year employment for 2021. This cyclical growth, which occurs as the economy returns to full employment, comes in addition to long-term structural growth.2 Between 2021 and 2031, the total U.S. economy is projected to add about 8.3 million jobs, with employment reaching a level of 166.5 million in 2031. Various demographic trends, including an aging population and slower growth in the civilian noninstitutional population, are expected to impact labor force growth and the labor force participation rate over the projections period. These demographic trends, combined with the pandemic recovery, in turn affect aggregate demand, industry output and employment, and occupational employment projections.
This article presents an overview of the 2021–31 projections. Highlights include the following:
Compared with the prior decade, the 2021–31 period is expected to see slower population growth.3 The median age of the population will trend upward, with all baby boomers reaching ages 67 and older by 2031.4 (See publication tables 3.2 and 3.4 under source data.) This increase in the share of people of traditional retirement age is expected to contribute to a decline in the labor force participation rate through 2031.
Real output is projected to increase by $7.8 trillion from 2021 to 2031, and most of this growth is expected to occur in the service-providing sectors. The 2.0-percent annual output growth projected for the total economy is slower than the 2.1-percent annual growth from 2011 to 2021.
Total employment is projected to grow 0.5 percent annually from 2021 to 2031,5 which is slower than the 1.0-percent annual growth recorded over the 2011−21 decade. Service-providing sectors are expected to account for most of the jobs added from 2021 to 2031.
Of the 8.3 million jobs projected to be added to the economy, nearly one-third (2.6 million) will be in the healthcare and social assistance sector. Employment increases in this sector are expected to stem from greater demand for a variety of healthcare services—demand driven by continued population aging and increasing rates of chronic disease.
Among all sectors, the leisure and hospitality sector is projected to see the fastest annual employment growth—1.3 percent. This rapid growth is driven primarily by recovery from the pandemic, as nearly three quarters of the jobs lost in this sector in 2020 had yet to be recovered in 2021. Professional and business services are projected to add 1.5 million jobs over the projections period, an increase including strong growth in computer systems design and related services and management, scientific, and technical consulting services.
Compared with service-providing sectors, slower employment growth is projected in the goods-producing sectors—and among these, the manufacturing sector is projected to decline. Increasing automation, combined with international competition, is expected to reduce employment demand in manufacturing and in many of the production occupations concentrated in this sector. Changing consumer preferences and increases in the use of technology are expected to lead to declines in employment in the postal service and retail trade industries, as well as in several information-related industries.
The COVID-19 pandemic prompted an economic recession from February 2020 to April 2020, leading to substantial declines in output and employment.6 Although the recession only lasted a few months, the pandemic persisted through 2021 and continued to disrupt economic activity, prevent or discourage people from reentering the labor force, and impact other economic conditions that affect employment.7 The economy rebounded in 2021, regaining approximately 4.6 million jobs; however, this equates to only about half of the jobs that were lost from 2019 to 2020. As a result, the 2021 annual average employment level, which forms the baseline for the 2021–31 projections, remained well below the prepandemic level. Employment in a majority of sectors continued to recover through the first half of 2022, and the 2021–31 projections do not reflect the employment recovery and reallocation that occurred during that time.8
Some industries that were disproportionately affected by the COVID-19 pandemic have lower base-year values and are expected to experience cyclical recoveries in the early part of the 2021–31 decade as industry output and employment normalize and return to their long-term trends, leading to higher projected employment growth. Projected rapid growth for industries in which employment fell in 2020 and remained low in 2021 is expected to result in strong growth for the occupations employed by those industries. For instance, many movie theaters were not operating at full capacity in 2021, resulting in a lower employment level in the motion picture and video exhibition industry in 2021 than in prepandemic recent history.9 This industry is projected to grow 70.5 percent over the 2021–31 decade, on account of a cyclical recovery in employment rather than a long-term structural increase in demand for motion picture and video exhibition. In turn, motion picture projectionists as well as ushers, lobby attendants, and ticket takers—occupations highly concentrated in the industry—are also expected to experience strong cyclical growth.
In addition, some industries and occupations are projected to have altered long-term structural demand arising from economic changes spurred by the pandemic. For example, many computer occupations are expected to have elevated long-term demand, in part because of increased business demand for telework computing infrastructure and information technology (IT) security.10
Data users should therefore note that fast growth rates in this projections set can be cyclically driven, structurally driven (in the long term), or driven by a combination of cyclical and structural factors.
BLS prepares projections in four areas: labor force, aggregate demand, industry output and employment, and occupational employment. Each step in the projections process affects subsequent steps. The projections for the labor force affect those for GDP growth. These projections further affect industry output and employment, which then feed into the occupational employment projections.
In the BLS labor force model, population and participation rates determine the outlook for labor force growth. Population projections, estimated by the U.S. Census Bureau and benchmarked to 2021 BLS Current Population Survey data, are heavily impacted by the Census Bureau’s outlook for mortality rates and immigration. Immigration, in particular, is an important but uncertain factor affecting the size of the future labor force.
Because labor force growth is one of the major determinants of long-term economic growth, the labor force projections describe the future path of the economy and its capacity to create goods and services. The long-term gradual slowdown in labor force growth continues to be key in determining the growth of the economy and of employment.
BLS develops macroeconomic projections with a model licensed from Macroeconomic Advisers (MA) by IHS Markit.11 The MA model assumes full employment in the target year. Data for energy prices come from the U.S. Energy Information Administration, and BLS determines other critical variables and supplies them to the MA model exogenously.12 The MA model then projects economic aggregates, including total employment, output, productivity, prices, interest rates, and many other variables for the U.S. economy. These variables—most importantly nonfarm payroll employment, labor productivity, and GDP—serve as constraints for the industry output and employment projections.
BLS produces model-based projections for hundreds of detailed industries, and these projections are then summed to arrive at aggregate values for subsectors and sectors. Macroeconomic factors, such as the labor force, GDP and its components, and labor productivity, affect the growth in total employment. These factors, along with the projection models for individual industries, determine the final projections of industry employment and output.
BLS produces occupational employment projections by analyzing current and projected future staffing patterns (the distribution of occupations within an industry) in an industry–occupation matrix. Changes in the staffing pattern for each industry are projected and applied to the final industry projections, yielding detailed occupational projections by industry. This projected employment matrix includes estimates for 832 occupations across 295 industries.13
The labor force went into a steep decline because of the COVID-19 pandemic and as of 2021 it had not yet fully recovered. Some portion of the labor force decline was voluntary, as individuals reevaluated their work–life balance, while another segment was involuntary, as COVID-19 and long COVID prevented individuals from working. Although the labor force grew by 462,000 in 2021, this is still 2.3 million less than in 2019. This decrease is a historically large reduction in the labor force relative to 2019.
A year-over-year labor force decline is an anomaly. In fact, including the current one, there were only three spans in which the labor force decreased since BLS began tracking this statistic in 1947.14 These three spans are compared in chart 1. The magnitude of the 2020 through 2021 labor force decline is significantly larger than any other. Moreover, the labor force is not projected to fully recover until 2024. (See chart 1.) The ensuing discussion will describe the trends that account for this historical reduction as well as which trends are expected to continue in the future.
| Years after base year | Percent change, base year 1950 | Percent change, base year 2008 | Percent change, base year 2019 |
|---|---|---|---|
|
1 |
-0.3 | -0.1 | -1.7 |
|
2 |
-0.1 | -0.3 | -1.4 |
|
3 |
1.3 | -0.4 | -0.5 (projected) |
|
4 |
2.3 | 0.4 | -0.1 (projected) |
|
5 |
4.5 | 0.7 | 0.3 (projected) |
|
Source: U.S. Bureau of Labor Statistics. |
|||
Changes to the overall labor force stem from fluctuations to both the size of the population (from which the labor force is drawn) and the labor force participation rate (the percentage of the population working or actively looking for work). Although the participation rate trends up or down, population growth has virtually always been positive.15 Population growth serves as a buffer for labor force growth—a steep participation rate drop is necessary for the overall labor force level to decline.
Population growth has slowed recently, weakening the buffer against a shrinking labor force growth. (See chart 2.) In the late 1970s growth rates exceeded 2.0 percent, but growth rates slowed dramatically in the 1980s. More recently in the mid-2000s, the growth rate was 1.3 percent. It has slowed further to 0.9 percent and is projected to grow even slower, at 0.7 percent annually over the 2021–31 decade. (See publication table 3.2 under source data.)
Population growth is slowing primarily because of low fertility rates and because of an aging population, namely the baby boomers, who typically have higher mortality rates. The fertility rate fell significantly during the 1960s. The birth rate was 3.7 births per woman in 1960 as the baby-boom years peaked, followed by a decline through the mid-1970s. From 1972 to 2019, the birth rate hovered in a relatively narrow range between 1.7 and 2.1.16
Other trends contributing to slower population growth include reduced immigration and lower life expectancies. Net international migration to the United States has averaged around 1 million annually from 2000 through 2017, slightly over half of the 1.8 million it averaged annually in the mid-1990s.17 That translates to 0.9 percent of the population in the mid-1990s compared to 0.4 percent in the mid-2010s. Since 2017, immigration declined dramatically, mostly because of the COVID-19 disruptions. Net migration between 2020 and 2021 added only 247,000, or 0.1 percent, to the nation’s population.18 Although immigration seems set to rebound, the extent is unknown. Immigration projections are highly uncertain as legislation can impact migration flows abruptly. Additionally, further developments in the ongoing COVID-19 pandemic could continue to affect immigration.
| Year | Growth rate |
|---|---|
|
1970 |
1.6 |
|
1971 |
1.7 |
|
1972 |
1.8 |
|
1973 |
1.9 |
|
1974 |
1.9 |
|
1975 |
1.9 |
|
1976 |
2.0 |
|
1977 |
2.0 |
|
1978 |
2.1 |
|
1979 |
2.1 |
|
1980 |
2.0 |
|
1981 |
2.0 |
|
1982 |
1.8 |
|
1983 |
1.7 |
|
1984 |
1.6 |
|
1985 |
1.5 |
|
1986 |
1.5 |
|
1987 |
1.4 |
|
1988 |
1.3 |
|
1989 |
1.2 |
|
1990 |
1.2 |
|
1991 |
1.2 |
|
1992 |
1.1 |
|
1993 |
1.1 |
|
1994 |
1.1 |
|
1995 |
1.1 |
|
1996 |
1.1 |
|
1997 |
1.1 |
|
1998 |
1.1 |
|
1999 |
1.1 |
|
2000 |
1.2 |
|
2001 |
1.2 |
|
2002 |
1.2 |
|
2003 |
1.3 |
|
2004 |
1.3 |
|
2005 |
1.3 |
|
2006 |
1.3 |
|
2007 |
1.3 |
|
2008 |
1.3 |
|
2009 |
1.3 |
|
2010 |
1.1 |
|
2011 |
1.1 |
|
2012 |
1.1 |
|
2013 |
1.1 |
|
2014 |
1.0 |
|
2015 |
1.0 |
|
2016 |
1.0 |
|
2017 |
1.0 |
|
2018 |
1.0 |
|
2019 |
0.9 |
|
2020 |
0.9 |
|
2021 |
0.9 |
|
2022 projected |
0.8 |
|
2023 projected |
0.8 |
|
2024 projected |
0.8 |
|
2025 projected |
0.7 |
|
2026 projected |
0.7 |
|
2027 projected |
0.7 |
|
2028 projected |
0.7 |
|
2029 projected |
0.7 |
|
2030 projected |
0.7 |
|
2031 projected |
0.7 |
|
Source: U.S. Bureau of Labor Statistics. |
|
Changes in life expectancy are generally too slow to affect population growth. However, the effects of COVID-19 are more visible than most trends as it has quickly become the third leading cause of death as of 2021.19 In May 2022, less than two and a half years since the first COVID-19 cases, the United States surpassed 1 million COVID-19 deaths, 0.4 percent of the population.20 Consequently, life expectancy decreased from 78.86 years in 2019 to 76.60 years in 2021, a net loss of 2.26 years.21
As previously noted, the birth rate fell significantly during the 1960s. That drop is reflected now by the fact that the segment of the population growing the most is those born before 1960: the 65-and-older group. (See chart 3.) The 65 and older demographic grew by 16.5 million from 2011 to 2021 and is projected to grow by another 15.8 million over the projections decade. For comparison, the 25–64 age group grew by 6.3 million over the past 10 years and is projected to grow by an additional 3.7 million. The youngest age group, 16–24, negatively factored into population change over the past 10 years, declining by 0.9 million. That group is projected to grow by 0.1 million over the next 10 years. This low growth is due to the same dynamic as the overall population change: the distribution of the 16 to 24 subset of the population is changing. The 20–24-year-old age group is projected to grow slightly, while growth of the 16–19-year-old population is projected to remain flat. (See publication table 3.2 under source data.)
Those 65 and older are more likely to be retired and have a lower propensity to work than the rest of the population. (See the participation rate section for a more thorough discussion). This difference in propensity to work is the other reason the population growth buffer against a declining labor force has diminished.
| Timespan | Population change (thousands), 16–24 | Population change (thousands), 25–64 | Population change (thousands), 65 and older |
|---|---|---|---|
|
1971–1981 |
5,668 | 18,810 | 5,444 |
|
1981–1991 |
-3,997 | 19,942 | 4,850 |
|
1991–2001 |
1,769 | 18,427 | 3,972 |
|
2001–2011 |
3,392 | 15,076 | 6,057 |
|
2011–2021 |
-936 | 6,302 | 16,461 |
|
2021–31 projected |
101 | 3,693 | 15,797 |
|
Source: U.S. Bureau of Labor Statistics. |
|||
The labor force participation rate fell substantially from 63.1 percent in 2019 to 61.7 percent in 2021. Based on current trends, the participation rate is projected to be 60.1 percent in 2031. (See publication table 3.3 under source data.) Some of the 2019 to 2021 decline is due to COVID-19, though much of it is due to the aging of the population. It remains to be seen to what extent COVID-19 effects will be short-term cyclical versus long-term structural.
Although COVID-19 impacts were sudden and steep, the effect of the aging population on the overall participation rate has been going on for over a decade. Since older individuals have a lower propensity to work, the more a population is comprised of older individuals the lower the overall labor force participation rate.
| Year | Labor force participation rate, 16–24 | Labor force participation rate, 25–54 | Labor force participation rate, 55–64 | Labor force participation rate, 65 and older | Labor force participation rate, all |
|---|---|---|---|---|---|
|
1991 |
66.0 | 83.4 | 55.5 | 11.5 | 66.2 |
|
1992 |
66.1 | 83.6 | 56.2 | 11.5 | 66.4 |
|
1993 |
66.1 | 83.4 | 56.4 | 11.2 | 66.3 |
|
1994 |
66.4 | 83.4 | 56.8 | 12.4 | 66.6 |
|
1995 |
66.3 | 83.5 | 57.2 | 12.1 | 66.6 |
|
1996 |
65.5 | 83.8 | 57.9 | 12.1 | 66.8 |
|
1997 |
65.4 | 84.1 | 58.9 | 12.2 | 67.1 |
|
1998 |
65.9 | 84.1 | 59.3 | 11.9 | 67.1 |
|
1999 |
65.5 | 84.1 | 59.3 | 12.3 | 67.1 |
|
2000 |
65.8 | 84.0 | 59.2 | 12.9 | 67.1 |
|
2001 |
64.5 | 83.7 | 60.4 | 13.0 | 66.8 |
|
2002 |
63.3 | 83.3 | 61.9 | 13.2 | 66.6 |
|
2003 |
61.6 | 83.0 | 62.4 | 14.0 | 66.2 |
|
2004 |
61.1 | 82.8 | 62.3 | 14.4 | 66 |
|
2005 |
60.8 | 82.8 | 62.9 | 15.1 | 66 |
|
2006 |
60.6 | 82.9 | 63.7 | 15.4 | 66.2 |
|
2007 |
59.4 | 83.0 | 63.8 | 16.0 | 66 |
|
2008 |
58.8 | 83.1 | 64.5 | 16.8 | 66 |
|
2009 |
56.9 | 82.6 | 64.9 | 17.2 | 65.4 |
|
2010 |
55.2 | 82.2 | 64.9 | 17.4 | 64.7 |
|
2011 |
55.0 | 81.6 | 64.2 | 17.9 | 64.1 |
|
2012 |
54.9 | 81.4 | 64.5 | 18.5 | 63.7 |
|
2013 |
55.1 | 81.0 | 64.4 | 18.7 | 63.2 |
|
2014 |
55.0 | 80.9 | 64.1 | 18.6 | 62.9 |
|
2015 |
55.0 | 80.9 | 63.9 | 18.9 | 62.7 |
|
2016 |
55.2 | 81.3 | 64.1 | 19.3 | 62.8 |
|
2017 |
55.5 | 81.7 | 64.5 | 19.3 | 62.9 |
|
2018 |
55.2 | 82.1 | 65.0 | 19.6 | 62.9 |
|
2019 |
55.9 | 82.5 | 65.3 | 20.2 | 63.1 |
|
2020 |
53.9 | 81.4 | 64.7 | 19.4 | 61.7 |
|
2021 |
55.5 | 81.6 | 64.6 | 18.9 | 61.7 |
|
2022 projected |
55.3 | 81.9 | 65.2 | 19.2 | 61.7 |
|
2023 projected |
54.7 | 81.8 | 65.4 | 19.5 | 61.5 |
|
2024 projected |
54.2 | 81.8 | 65.7 | 19.8 | 61.2 |
|
2025 projected |
53.8 | 81.7 | 66.1 | 20.1 | 61.0 |
|
2026 projected |
53.4 | 81.6 | 66.5 | 20.4 | 60.8 |
|
2027 projected |
53.0 | 81.5 | 66.9 | 20.6 | 60.7 |
|
2028 projected |
52.6 | 81.4 | 67.3 | 20.9 | 60.5 |
|
2029 projected |
52.1 | 81.3 | 67.7 | 21.1 | 60.4 |
|
2030 projected |
51.6 | 81.2 | 68.0 | 21.3 | 60.2 |
|
2031 projected |
51.1 | 81.1 | 68.2 | 21.5 | 60.1 |
|
Source: U.S. Bureau of Labor Statistics. |
|||||
The aging of the population is projected to continue, resulting in a continued decline in the overall labor force participation rate to 60.1 percent in 2031. This is a slower rate of decline than that of 2019 to 2021. Partially offsetting the aging population effect is an increase in the participation rates for older workers. (See chart 4.) Although still low relative to the prime-working-age group (ages 25 to 54), the 65-and-older participation rate has been increasing and is projected to increase further from 18.9 percent in 2021 to 21.5 percent in 2031. Similarly, the participation rate for the 55-to-64 age group is projected to increase from 64.6 to 68.2 percent in 2031. The result of these trends is over half of the labor force growth from 2021 to 2031 is projected to come from the 65-and-older age group. (See chart 5.)
| Timespan | Labor force change (thousands), 16–24 | Labor force change (thousands), 25–64 | Labor force change (thousands), 65 and older |
|---|---|---|---|
|
1971–1981 |
6,287 | 18,108 | -107 |
|
1981–1991 |
-3,274 | 20,579 | 371 |
|
1991–2001 |
646 | 15,773 | 969 |
|
2001–2011 |
-1,462 | 8,616 | 2,730 |
|
2011–2021 |
-310 | 4,407 | 3,488 |
|
2021–2031 projected |
-1,592 | 4,416 | 4,853 |
|
Source: U.S. Bureau of Labor Statistics. |
|||
Performing evaluations on these demographic data allows us to estimate how much of the decrease in the labor force participation rate from 2019 to 2021 is due to aging. This calculation yields an estimate that aging accounted for approximately 0.8 percentage point, over half of the 63.1- to 61.7-percent decrease.22 This estimated aging effect of 0.8 percentage point decline of the overall participation rate leaves an additional 0.6 percentage point of decline. It is likely that much of this 0.6 percentage point is due to the widespread effects of COVID-19 on the economy and healthcare system.
Aside from the very youngest, every age group behaved similarly in the labor market over the COVID-19 pandemic, with participation rates declining between 0.5 and 1.9 percentage points from 2019 to 2021. COVID-19 caused many people to make different choices about whether to work. Some have decided to retire early while others report being out of the labor force because of home care and family care.23 Additionally, long COVID appears to be keeping some of the population out of the workforce.24
The extent to which the pandemic effects are long-term structural or short-term cyclical in nature is still unknown. Workers who voluntarily left the workforce during the pandemic may be enticed back with increased wages and benefits. Record high profits in 2021,25 with the widest margins since 1950,26 suggests there is room to raise wages. COVID-19 and long COVID are likely to continue being a drag on the labor force, although investment in public health arenas and scientific breakthroughs could mitigate this drag to some degree.27
| Timespan | Population growth | Labor force growth |
|---|---|---|
|
1971–81 |
2.0 | 2.6 |
|
1981–91 |
1.2 | 1.5 |
|
1991–2001 |
1.2 | 1.3 |
|
2001–11 |
1.1 | 0.7 |
|
2011–21 |
0.9 | 0.5 |
|
2021–31 projected |
0.7 | 0.5 |
|
Source: U.S. Bureau of Labor Statistics. |
||
Although as of 2021 the labor force was still down relative to 2019 levels, it is projected to continue recovering, growing 0.5 percent annually over the next decade (See table 3.1 and chart 6.) This rate is slower than projected population growth. Population growth is responsible for all labor force growth as the continued participation rate decline will act as a drag on the labor force.
Changes to the size and composition of the labor force impact economic output (here measured in gross domestic product). Reduced labor force growth over the next decade will be a drag on GDP growth. However, GDP may still increase as the labor market recovers to full employment.28 The 2021 GDP level was below potential as it had still not recovered from the 2020 recession. Other factors besides the labor force will also affect GDP.
Growth rates for GDP and its components will be expressed in real terms rather than nominal terms throughout this article. GDP is projected to grow 2.1 percent annually over the projections decade. This growth rate is higher than the prior two decades although significantly below growth in the decades prior to those. (See chart 7.) The difference in growth between this projection and the 1980s and 1990s is due to the slowing of labor force growth.
GDP growth can be disaggregated into its subcomponents: personal consumption expenditures (PCE), investment, government, and net exports. Historically, PCE accounts for the majority of GDP growth while investment also accounts for a smaller, though still significant, amount of growth. Net exports and government generally account for a minimal amount of growth. (See chart 8 for historical and projected GDP contributions).
| Timespan | Growth rate |
|---|---|
|
1981–91 |
3.05 |
|
1991–2001 |
3.55 |
|
2001–11 |
1.82 |
|
2011–21 |
2.03 |
|
2021–31 projected |
2.15 |
|
Source: Historic data are from the U.S. Bureau of Economic Analysis, and projected data are from the U.S. Bureau of Labor Statistics. |
|
PCE and investment growth plummeted—and were in fact negative—in 2020 because of the COVID-19 pandemic; they have since rebounded dramatically. PCE and investment accounted for 5.3 and 1.6 percentage points of GDP growth respectively in 2021. Growth and contributions are projected to return to more normal levels through 2031: PCE will account for 1.5 percentage points of projected GDP growth while investment will account for another 0.6 percentage point over the next decade. Government spending will account for an additional 0.1 percentage point. Net exports will account for a negligible amount, rounding 0.0 percentage point.
| Year | PCE | Investment | Government and net exports |
|---|---|---|---|
|
2001 |
1.6 | -1.1 | 0.4 |
|
2002 |
1.7 | -0.2 | 0.2 |
|
2003 |
2.1 | 0.8 | -0.1 |
|
2004 |
2.5 | 1.6 | -0.3 |
|
2005 |
2.4 | 1.3 | -0.2 |
|
2006 |
1.9 | 0.6 | 0.2 |
|
2007 |
1.6 | -0.5 | 0.9 |
|
2008 |
0.1 | -1.5 | 1.5 |
|
2009 |
-0.9 | -3.5 | 1.8 |
|
2010 |
1.3 | 1.9 | -0.5 |
|
2011 |
1.2 | 0.9 | -0.6 |
|
2012 |
0.9 | 1.6 | -0.3 |
|
2013 |
1.0 | 1.1 | -0.3 |
|
2014 |
1.8 | 0.9 | -0.5 |
|
2015 |
2.2 | 1.0 | -0.5 |
|
2016 |
1.7 | -0.2 | 0.2 |
|
2017 |
1.6 | 0.7 | -0.1 |
|
2018 |
2.0 | 1.0 | 0.0 |
|
2019 |
1.5 | 0.6 | 0.2 |
|
2020 |
-2.6 | -1.0 | 0.1 |
|
2021 |
5.3 | 1.6 | -1.3 |
|
2021-31 projected |
1.5 | 0.6 | 0.1 |
|
Note: PCE = personal consumption expenditures. Source: Historic data are from the U.S. Bureau of Economic Analysis, and projected data are from the U.S. Bureau of Labor Statistics. |
|||
Employment consists of those who are working, while the labor force includes those who are working and actively searching for work. Therefore, while growth in the labor force influences GDP, it is employment that directly affects GDP. Those who are actively searching for work, but not working, are considered unemployed. Unemployment tends to be high during recessionary periods, although there is always some level of frictional unemployment as workers change jobs and are not working.
| Year | Unemployment rate | Nonaccelerating inflation rate of unemployment |
|---|---|---|
|
1972 |
5.60 | 6.03 |
|
1973 |
4.88 | 6.09 |
|
1974 |
5.62 | 6.14 |
|
1975 |
8.47 | 6.18 |
|
1976 |
7.69 | 6.21 |
|
1977 |
7.04 | 6.23 |
|
1978 |
6.05 | 6.24 |
|
1979 |
5.84 | 6.23 |
|
1980 |
7.17 | 6.21 |
|
1981 |
7.61 | 6.17 |
|
1982 |
9.72 | 6.14 |
|
1983 |
9.59 | 6.10 |
|
1984 |
7.51 | 6.06 |
|
1985 |
7.20 | 6.02 |
|
1986 |
7.00 | 5.98 |
|
1987 |
6.19 | 5.93 |
|
1988 |
5.50 | 5.86 |
|
1989 |
5.27 | 5.78 |
|
1990 |
5.61 | 5.70 |
|
1991 |
6.84 | 5.63 |
|
1992 |
7.50 | 5.56 |
|
1993 |
6.91 | 5.50 |
|
1994 |
6.09 | 5.45 |
|
1995 |
5.60 | 5.40 |
|
1996 |
5.40 | 5.37 |
|
1997 |
4.94 | 5.33 |
|
1998 |
4.51 | 5.29 |
|
1999 |
4.22 | 5.25 |
|
2000 |
3.99 | 5.21 |
|
2001 |
4.75 | 5.17 |
|
2002 |
5.78 | 5.12 |
|
2003 |
5.99 | 5.08 |
|
2004 |
5.52 | 5.04 |
|
2005 |
5.08 | 5.01 |
|
2006 |
4.62 | 4.97 |
|
2007 |
4.62 | 4.93 |
|
2008 |
5.80 | 4.89 |
|
2009 |
9.27 | 4.87 |
|
2010 |
9.62 | 4.84 |
|
2011 |
8.94 | 4.81 |
|
2012 |
8.07 | 4.77 |
|
2013 |
7.37 | 4.73 |
|
2014 |
6.16 | 4.70 |
|
2015 |
5.28 | 4.67 |
|
2016 |
4.87 | 4.65 |
|
2017 |
4.36 | 4.62 |
|
2018 |
3.90 | 4.58 |
|
2019 |
3.67 | 4.54 |
|
2020 |
8.10 | 4.50 |
|
2021 |
5.35 | 4.46 |
|
2022 projected |
1 | 4.44 |
|
2023 projected |
1 | 4.42 |
|
2024 projected |
1 | 4.41 |
|
2025 projected |
1 | 4.40 |
|
2026 projected |
1 | 4.39 |
|
2027 projected |
1 | 4.37 |
|
2028 projected |
1 | 4.35 |
|
2029 projected |
1 | 4.33 |
|
2030 projected |
1 | 4.30 |
|
2031 projected |
4.27 | 4.28 |
|
Note: 1 Not applicable. Unemployment rates calculated and used within the projection model are made with less precise values then those made and used by the Current Population Survey. Consequently, they may differ slightly from what is published by the Current Population Survey. Source: Unemployment data are from the U.S. Bureau of Labor Statistics. Nonaccelerating inflation rate data are from the Congressional Budget Office. |
||
The natural level of unemployment that is frictional can be referred to as the nonaccelerating inflation rate of unemployment (NAIRU). At this level of unemployment, inflation is consistent, not accelerating. As of this writing, the monthly unemployment rate fell below the estimated 4.4 percent NAIRU level. Moreover, in recent months, inflation levels are spiking to levels not seen since the early 1980s.29 However, in 2021 the annual unemployment level of 5.4 percent was above the 4.5 percent NAIRU, signaling the economy had not yet reached its potential.30 (See chart 9.) As the economy was still below potential, there is additional room for GDP to grow over the projected period.
The flipside of unemployment is employment. As unemployment decreases, employment tends to increase.31 Civilian household employment is projected to grow slightly faster than the labor force—0.6 percent annually compared to the 0.5 percent labor force growth. This difference in growth rates is due to the economy being below potential in 2021 as well as the estimated NAIRU declining slightly to 4.3 percent in 2031.
The level of employment combined with productivity generates output. Productivity is influenced by capital deepening and total factor productivity (TFP). Capital consists of those durable produced goods that are in turn used as productive inputs for further production.32 These inputs include computers, equipment, intellectual property, buildings, and the like. Capital deepening refers to an increase in the ratio of capital to labor. Greater investment increases this ratio, although capital naturally depreciates over time as well. TFP increases can be from technological improvements, increases in the education or quality of the workforce, improvements in management practices, and economies of scale.
Over the past 30 years, capital deepening has been responsible for approximately 60 percent of productivity growth while the remaining 40 percent can be attributed to TFP. This dynamic is projected to continue over the next 10 years. Productivity is projected to grow by 2.2 percent annually with capital deepening contributing 1.4 percentage points and TFP contributing 1.0 percentage point (capital deepening and TFP do not sum to total productivity growth due to some cyclicality). (See chart 10.)
| Timespan | Total factor productivity | Capital deepening | Cyclical/other |
|---|---|---|---|
|
1981–91 |
1.1 | 0.9 | -0.3 |
|
1991–2001 |
1.0 | 1.3 | 0.1 |
|
2001–11 |
1.0 | 1.5 | -0.1 |
|
2011–21 |
0.4 | 0.7 | 0.1 |
|
2021–31 projected |
1.0 | 1.4 | -0.2 |
|
Source: U.S. Bureau of Labor Statistics. |
|||
Although monetary policy is undergoing significant changes as of this writing to combat inflation, it was relatively steady throughout 2021. No changes were made to the federal funds rate throughout the year as it hovered around 0.1 percent.33 The Federal Reserve’s balance sheet grew at a substantially slower rate than in 2020, from 7.3 trillion in January 2021 to 8.8 trillion in December.34 From 2021 to 2031, the federal funds rate is projected to rise considerably to 2.6 percent—this rise is already underway, as the Federal Reserve announced a target range of 2.25 to 2.5 in their July 2022 meeting.35
As the economy recovered from its 2020 slump, fiscal stimulus packages ended. Over the course of 2021, Congress ended direct cash transfers to Americans in March,36 ended the extended unemployment insurance program in September (for those states that had not already ended it),37 and allowed the child tax credits to expire in December.38
Assumptions about fiscal policy, including tax policy and government spending, substantially affect expectations for government revenue, national debt, and economic growth. BLS generally assumes no major changes to current tax laws or other major legislation over the projections decade. Effective marginal tax rates also are held constant at their current levels.
Although GDP reflects final demand for goods and services, total output is comprised of intermediate goods in addition to GDP. Total industry output is used by BLS to develop industry employment projections because it better reflects the demand for labor, as workers are needed to produce intermediate as well as final goods and services. BLS projects that output will increase about the same in the 2021–31 decade as it did during the previous decade while employment growth will be slower. Industry output and employment projections were prepared using the North American Industry Classification System (NAICS). Major sectors—hereafter referred to as “sectors”—are aggregations of NAICS industries.
BLS projects real output will increase from $34.9 trillion in 2021 to $42.7 trillion in 2031.39 The $7.8 trillion increase from 2021 to 2031 is larger than the $6.4 trillion increase experienced during the previous decade. Most of the increase in real output (76.8 percent) is projected to come from service-providing sectors.
Real output in the service-providing sectors is projected to grow at an annual rate of 2.2 percent per year from 2021 to 2031, slightly slower than the 2.4-percent annual growth experienced from 2011 to 2021. Over the 2021–31 decade, however, the projected 2.2-percent annual growth in output for service-providing sectors is slightly faster than the 2.0-percent projected annual output growth for the entire U.S. economy. All service-providing sectors are projected to experience real output growth over the 2021–31 decade, except for the federal government sector, which is projected to decline from $1.17 trillion in 2021 to $1.16 trillion in 2031. Whereas both the healthcare and social assistance sector and the information sector are projected to experience the fastest growth in output among service-providing sectors from 2021 to 2031, the utilities sector is projected to experience the slowest real output growth of all of the growing service-providing sectors during the same period.
As for the goods-producing (excluding agriculture) sectors, real output is projected to grow at a rate of 1.7 percent per year from 2021 to 2031; this growth is slower than the projected 2.0-percent annual growth for the overall economy, but faster than the 1.1-percent increase experienced by the goods-producing sector in the previous decade. In line with the previous four sets of projections, the mining sector is projected to experience the fastest output growth among the goods-producing (excluding agriculture) sectors, growing at an annual rate of 2.2 percent from 2021 to 2031.
Real output in the agriculture, forestry, fishing, and hunting sector is projected to grow at a rate of 1.9 percent per year for the 2021–31 projections period; a much slower growth compared with the prior decade, when this sector grew by 2.5 percent annually. (See table 1).
| Industry Sector | Output (billions of chained 2012 dollars), 2011 | Output (billions of chained 2012 dollars), 2021 | Output (billions of chained 2012 dollars), 2031 | Compound annual rate of change (percent), 2011–21 | Compound annual rate of change (percent), 2021–31 | Output (billions of dollars), 2011 | Output (billions of dollars), 2021 | Output (billions of dollars), 2031 | Percent distribution, 2011 | Percent distribution, 2021 | Percent distribution, 2031 |
|---|---|---|---|---|---|---|---|---|---|---|---|
| Total | 28,475.0 | 34,893.3 | 42,696.0 | 2.1 | 2.0 | 28,045.9 | 40,232.4 | 50,455.6 | 100.0 | 100.0 | 100.0 |
| Goods-producing, excluding agriculture | 7,269.0 | 8,130.2 | 9,597.1 | 1.1 | 1.7 | 7,216.9 | 8,387.0 | 10,259.4 | 25.7 | 20.8 | 20.3 |
| Mining | 559.5 | 703.4 | 873.6 | 2.3 | 2.2 | 601.8 | 469.1 | 890.2 | 2.1 | 1.2 | 1.8 |
| Construction | 1,047.4 | 1,402.6 | 1,618.4 | 3.0 | 1.4 | 1,020.5 | 1,915.3 | 1,976.9 | 3.6 | 4.8 | 3.9 |
| Manufacturing | 5,663.8 | 5,986.4 | 7,062.4 | 0.6 | 1.7 | 5,594.6 | 6,002.6 | 7,392.2 | 19.9 | 14.9 | 14.7 |
| Service-providing, excluding special industries | 19,428.0 | 24,706.8 | 30,696.4 | 2.4 | 2.2 | 19,096.7 | 29,525.1 | 37,509.4 | 68.1 | 73.4 | 74.3 |
| Utilities | 465.2 | 512.1 | 541.5 | 1.0 | 0.6 | 484.9 | 586.2 | 600.2 | 1.7 | 1.5 | 1.2 |
| Wholesale trade | 1,567.3 | 2,020.1 | 2,544.3 | 2.6 | 2.3 | 1,530.8 | 2,380.3 | 3,046.7 | 5.5 | 5.9 | 6.0 |
| Retail trade | 1,368.7 | 1,996.9 | 2,593.6 | 3.8 | 2.6 | 1,335.9 | 2,385.4 | 3,230.0 | 4.8 | 5.9 | 6.4 |
| Transportation and warehousing | 985.2 | 1,229.1 | 1,561.6 | 2.2 | 2.4 | 958.8 | 1,366.2 | 1,732.5 | 3.4 | 3.4 | 3.4 |
| Information | 1,334.1 | 2,181.8 | 3,028.0 | 5.0 | 3.3 | 1,324.7 | 2,230.1 | 2,645.5 | 4.7 | 5.5 | 5.2 |
| Financial activities | 3,552.8 | 4,611.9 | 5,460.3 | 2.6 | 1.7 | 3,475.7 | 6,083.7 | 8,883.0 | 12.4 | 15.1 | 17.6 |
| Professional and business services | 2,902.3 | 4,120.6 | 5,366.6 | 3.6 | 2.7 | 2,868.6 | 4,737.9 | 6,037.1 | 10.2 | 11.8 | 12.0 |
| Educational services | 314.8 | 313.7 | 360.8 | 0.0 | 1.4 | 306.5 | 373.7 | 424.1 | 1.1 | 0.9 | 0.8 |
| Health care and social assistance | 1,897.5 | 2,323.8 | 3,218.6 | 2.0 | 3.3 | 1,867.8 | 2,753.0 | 3,614.9 | 6.7 | 6.8 | 7.2 |
| Leisure and hospitality | 1,059.8 | 1,232.0 | 1,529.1 | 1.5 | 2.2 | 1,030.0 | 1,469.2 | 1,771.0 | 3.7 | 3.7 | 3.5 |
| Other services | 561.4 | 598.2 | 733.4 | 0.6 | 2.1 | 548.9 | 761.7 | 910.0 | 2.0 | 1.9 | 1.8 |
| Federal government | 1,159.9 | 1,168.8 | 1,163.0 | 0.1 | 0.0 | 1,148.7 | 1,368.5 | 1,297.4 | 4.1 | 3.4 | 2.6 |
| State and local government | 2,258.2 | 2,480.9 | 2,817.8 | 0.9 | 1.3 | 2,215.2 | 3,029.3 | 3,317.0 | 7.9 | 7.5 | 6.6 |
| Agriculture, forestry, fishing, and hunting | 448.9 | 572.1 | 691.8 | 2.5 | 1.9 | 429.5 | 498.3 | 654.8 | 1.5 | 1.2 | 1.3 |
| Special Industries1 | 1,329.3 | 1,405.8 | 1,585.9 | 0.6 | 1.2 | 1,302.9 | 1,822.0 | 2,032.0 | 4.6 | 4.5 | 4.0 |
| Residual2 | -0.2 | 78.5 | 124.8 | 3 | 3 | 3 | 3 | 3 | 3 | 3 | 3 |
| Note: 1 Consists of nonproducing accounting categories to reconcile the input-output system with National Income and Product Accounts. 2 Residual is shown for the first level only. Subcategories do not necessarily add to higher categories as a by-product of chain-weighting. 3 Not applicable. Source: U.S. Bureau of Labor Statistics | |||||||||||
Of the 20 fastest growing real output industries for the 2021–31 projection period, growth is projected to be the fastest among industries in the leisure and hospitality sector and in the information sector. (See publications table 2.7 under source data.) Output in the museums, historical sites, and similar institutions; performing arts companies; and other amusement and recreation industries is projected to grow by 7.0-percent, 6.8-percent, and 4.7-percent per year, respectively. This growth is due to the expected continued recovery from the COVID-19 pandemic since many leisure and hospitality industries were particularly affected.
The information sector, which has remained one of the fastest growing output sectors for the past four projection cycles, includes software publishers; other information services; and data processing, hosting, and related services. Output in these industries is projected to grow between 4.3 percent and 5.3 percent annually for the 2021–31 decade, as demand for technological advancements to accommodate lifestyle needs (for example, increased remote work, online shopping, contactless finance, and overall internet and data usage) has been on an upward trend and is expected to remain robust.40
The healthcare and social assistance sector, which includes 5 of the 20 industries with the fastest growing real output for the 2021–31 projections period, includes home healthcare services, medical and diagnostic laboratories, offices of physicians, hospitals, and offices of dentists. These industries are projected to grow between 3.4 percent and 4.0 percent annually from 2021 to 2031, as the aging of the population and the continued expected rise in chronic health conditions, such as diabetes, is expected to drive demand for overall healthcare services.41
Real output declines from 2021 to 2031 are mostly concentrated in the manufacturing sector. (See publication table 2.8 under source data.) Manufacturing industries with the fastest projected output declines over the projections decade include tobacco manufacturing; manufacturing and reproducing magnetic and optical media; apparel, leather, and allied product manufacturing; and other chemical product and preparation manufacturing. Among these most rapidly declining output industries, the tobacco manufacturing industry continues to lead in having the fastest output decline (4.0 percent annually). The rate of cigarette smoking has been on a steady decline over the last few decades for both adults and youths, and this trend is expected to continue from 2021 to 2031.42 Moreover, rather than traditional rolled tobacco cigarettes, the prevalence and increased popularity in the use of electronic vapor cigarettes further contributes to the overall decline expected in the tobacco manufacturing industry.43
Coal mining, the third most rapidly declining output industry over 2021–31 decade, is projected to decline by 3.4 percent annually from 2021 to 2031. Declining demand for coal, coupled with a rise in the production of both low priced natural gas and alternative renewal energy such as wind and solar power are trends that are expected to continue from 2021 to 2031.44
Other sectors with the most rapidly declining output for the 2021–31 decade include industries from other services and the federal government sector, where industries are projected to decline by between 0.2 percent and 0.4 percent annually to 2031.
BLS projects total employment in 2031 to reach 166.5 million, an increase of about 8.3 million from 2021.45 This growth represents a 0.5-percent annual growth rate. During the previous decade, total employment grew at 1.0 percent annually. Most of the increase in employment, 98.0 percent, stems from nonagricultural wage and salary jobs. Employment in nonagricultural wage and salary is projected to rise from 146.7 million in 2021 to 154.9 million in 2031, an increase of about 8.2 million jobs.46 (See chart 11.) This increase is much less than the 14.1 million jobs that were added from 2011 to 2021. The projected slowdown in employment growth stems from both an aging population as well as lower population growth, as discussed earlier.
| Year | Total nonfarm wage and salary employment |
|---|---|
|
2000 |
132.7 |
|
2001 |
132.7 |
|
2002 |
131.3 |
|
2003 |
131.0 |
|
2004 |
132.5 |
|
2005 |
134.8 |
|
2006 |
137.2 |
|
2007 |
138.7 |
|
2008 |
138.0 |
|
2009 |
132.0 |
|
2010 |
131.0 |
|
2011 |
132.6 |
|
2012 |
134.8 |
|
2013 |
137.0 |
|
2014 |
139.7 |
|
2015 |
142.6 |
|
2016 |
145.0 |
|
2017 |
147.2 |
|
2018 |
149.6 |
|
2019 |
151.7 |
|
2020 |
142.8 |
|
2021 |
146.7 |
|
2022 |
1 |
|
2023 |
1 |
|
2024 |
1 |
|
2025 |
1 |
|
2026 |
1 |
|
2027 |
1 |
|
2028 |
1 |
|
2029 |
1 |
|
2030 |
1 |
|
2031 projected |
154.9 |
|
Note: 1 Not applicable. Total nonagricultural wage and salary employment is the sum of private household employment data from the Current Population Survey and nonagricultural wage and salary employment data, excluding data for logging, from the Current Employment Statistics survey. Source: U.S. Bureau of Labor Statistics. |
|
Employment in the service-providing sectors is projected to increase by 8.0 million jobs to reach about 134.5 million by 2031. This increase represents just over 96 percent of all jobs added from 2021 to 2031. Employment in the service-providing sectors is expected to grow by 0.6 percent annually over the 2021–31 decade, which is slower than the than the 1.0-percent annual growth rate experienced from 2011 to 2021, but slightly faster than the 0.5-percent projected annual growth for the overall economy. (See table 2.)
| Industry Sector | Employment (thousands of jobs), 2011 | Employment (thousands of jobs), 2021 | Employment (thousands of jobs), 2031 | Employment change (thousands of jobs), 2011–21 | Employment change (thousands of jobs), 2021–31 | Percent distribution, 2011 | Percent distribution, 2021 | Percent distribution, 2031 | Compound annual rate of change (percent), 2011–21 | Compound annual rate of change (percent), 2021–31 |
|---|---|---|---|---|---|---|---|---|---|---|
| Total1 | 143,326.8 | 158,134.9 | 166,452.1 | 14,808.1 | 8,317.2 | 100.0 | 100.0 | 100.0 | 1.0 | 0.5 |
| Nonagriculture wage and salary2 | 132,589.0 | 146,736.9 | 154,888.2 | 14,147.9 | 8,151.3 | 92.5 | 92.8 | 93.1 | 1.0 | 0.5 |
| Goods-producing, excluding agriculture | 17,999.6 | 20,279.5 | 20,408.6 | 2,279.9 | 129.1 | 12.6 | 12.8 | 12.3 | 1.2 | 0.1 |
| Mining | 739.2 | 519.6 | 583.4 | -219.6 | 63.8 | 0.5 | 0.3 | 0.4 | -3.5 | 1.2 |
| Construction | 5,533.4 | 7,413.3 | 7,618.0 | 1,879.9 | 204.7 | 3.9 | 4.7 | 4.6 | 3.0 | 0.3 |
| Manufacturing | 11,727.0 | 12,346.6 | 12,207.2 | 619.6 | -139.4 | 8.2 | 7.8 | 7.3 | 0.5 | -0.1 |
| Services-providing, excluding special industries | 114,589.4 | 126,457.4 | 134,479.7 | 11,868.0 | 8,022.2 | 79.9 | 80.0 | 80.8 | 1.0 | 0.6 |
| Utilities | 552.5 | 540.8 | 506.2 | -11.7 | -34.6 | 0.4 | 0.3 | 0.3 | -0.2 | -0.7 |
| Wholesale trade | 5,474.7 | 5,677.9 | 5,813.7 | 203.2 | 135.8 | 3.8 | 3.6 | 3.5 | 0.4 | 0.2 |
| Retail trade | 14,673.6 | 15,396.0 | 15,063.3 | 722.4 | -332.7 | 10.2 | 9.7 | 9.0 | 0.5 | -0.2 |
| Transportation and warehousing | 4,289.4 | 6,092.0 | 6,558.5 | 1,802.6 | 466.5 | 3.0 | 3.9 | 3.9 | 3.6 | 0.7 |
| Information | 2,673.3 | 2,831.4 | 3,041.2 | 158.1 | 209.8 | 1.9 | 1.8 | 1.8 | 0.6 | 0.7 |
| Financial activities | 7,696.6 | 8,777.0 | 9,113.2 | 1,080.4 | 336.2 | 5.4 | 5.6 | 5.5 | 1.3 | 0.4 |
| Professional and business services | 17,389.1 | 21,249.5 | 22,798.9 | 3,860.4 | 1,549.4 | 12.1 | 13.4 | 13.7 | 2.0 | 0.7 |
| Educational services | 3,249.6 | 3,589.3 | 4,026.5 | 339.7 | 437.2 | 2.3 | 2.3 | 2.4 | 1.0 | 1.2 |
| Health care and social assistance | 17,068.8 | 20,084.0 | 22,694.0 | 3,015.2 | 2,610.0 | 11.9 | 12.7 | 13.6 | 1.6 | 1.2 |
| Leisure and hospitality | 13,352.6 | 14,100.8 | 16,024.2 | 748.2 | 1,923.4 | 9.3 | 8.9 | 9.6 | 0.5 | 1.3 |
| Other services | 6,082.7 | 6,114.1 | 6,641.4 | 31.4 | 527.3 | 4.2 | 3.9 | 4.0 | 0.1 | 0.8 |
| Federal government | 2,858.5 | 2,885.7 | 2,780.7 | 27.2 | -105.0 | 2.0 | 1.8 | 1.7 | 0.1 | -0.4 |
| State and local government | 19,228.0 | 19,118.9 | 19,417.9 | -109.1 | 299.0 | 13.4 | 12.1 | 11.7 | -0.1 | 0.2 |
| Agriculture, forestry, fishing, and hunting3 | 2,147.5 | 2,184.8 | 2,200.5 | 37.3 | 15.7 | 1.5 | 1.4 | 1.3 | 0.2 | 0.1 |
| Agriculture wage and salary | 1,304.9 | 1,460.2 | 1,520.1 | 155.3 | 59.9 | 0.9 | 0.9 | 0.9 | 1.1 | 0.4 |
| Agriculture self-employed | 842.6 | 724.6 | 680.4 | -118.0 | -44.2 | 0.6 | 0.5 | 0.4 | -1.5 | -0.6 |
| Nonagriculture self-employed | 8,590.3 | 9,213.2 | 9,363.4 | 622.9 | 150.3 | 6.0 | 5.8 | 5.6 | 0.7 | 0.2 |
| Note: 1 Employment data for wage and salary workers are from the BLS Current Employment Statistics (CES) survey, which counts jobs, whereas self-employed and agriculture, forestry, fishing, and hunting are from the Current Population Survey (CPS) household survey, which counts workers. 2 Includes wage and salary data from the CES survey, except private households, which is from the CPS. Logging workers are excluded. 3 Includes agriculture, forestry, fishing, and hunting data from the CPS, except logging, which is from CES survey. Government wage and salary workers are excluded. Source: U.S. Bureau of Labor Statistics | ||||||||||
In line with the last seven sets of projections, the healthcare and social assistance sector is projected to add the most employment from 2021 to 2031. Employment in this sector is projected to add 2.6 million jobs over the 2021–31 decade, reaching a level of 22.7 million by 2031. This is a projected annual growth rate of 1.2 percent—slower than the 1.6-percent growth rate from 2011 to 2021, but faster than the 0.5-percent annual growth rate for the overall economy.
As with the last three sets of projections, the retail trade sector is projected to have the largest employment decline among all service-providing industries, projected to drop by 332,700 over the 2021–31 decade. This projected decrease in employment contrasts with the 722,400 jobs which were added during the previous decade. The declining employment trajectory in retail trade continues to be driven by several factors, most notably the shift of consumer-spending behavior in favor of e-commerce shopping.47 In addition, while online purchases still support employment, relatively fewer jobs are in the retail sector; more jobs supported from online purchases are found in other sectors, including transportation and warehousing.
Overall employment in the goods-producing, excluding agriculture, sectors is projected to increase by 129,100 jobs during the 2021–31 decade to 20.4 million jobs. During the previous decade, employment in these sectors rose by 2.3 million, a much larger figure. The construction industry alone accounted for about 1.9 million of this employment growth, driven by recovery from the housing market crash and subsequent Great Recession of 2007–09. While growth is projected to slow considerably from 2021 to 2031, the construction sector is still projected to add the most employment (204,700 jobs) from 2021 to 2031 of all the goods producing sectors. (See chart 12.)
| Year | Employment (millions) |
|---|---|
|
2000 |
6.8 |
|
2001 |
6.8 |
|
2002 |
6.7 |
|
2003 |
6.7 |
|
2004 |
7.0 |
|
2005 |
7.3 |
|
2006 |
7.7 |
|
2007 |
7.6 |
|
2008 |
7.2 |
|
2009 |
6.0 |
|
2010 |
5.5 |
|
2011 |
5.5 |
|
2012 |
5.6 |
|
2013 |
5.9 |
|
2014 |
6.2 |
|
2015 |
6.5 |
|
2016 |
6.7 |
|
2017 |
7.0 |
|
2018 |
7.3 |
|
2019 |
7.5 |
|
2020 |
7.3 |
|
2021 |
7.4 |
|
2022 |
1 |
|
2023 |
1 |
|
2024 |
1 |
|
2025 |
1 |
|
2026 |
1 |
|
2027 |
1 |
|
2028 |
1 |
|
2029 |
1 |
|
2030 |
1 |
|
2031 projected |
7.6 |
|
Note: 1 Not applicable. Source: U.S. Bureau of Labor Statistics. |
|
Manufacturing is the largest component of the goods-producing sector, accounting for over half of total employment in this sector. Manufacturing employment in the United States plummeted between 2001 and 2011 because of rapid productivity gains and offshoring of jobs to lower labor cost countries.48 Although manufacturing did post a net gain of 619,600 jobs over the following decade, it is projected to decline slightly, by 139,400 jobs, over the 2021 to 2031 projection period. (See chart 13.)
| Year | Employment (millions) |
|---|---|
|
2000 |
17.3 |
|
2001 |
16.4 |
|
2002 |
15.3 |
|
2003 |
14.5 |
|
2004 |
14.3 |
|
2005 |
14.2 |
|
2006 |
14.2 |
|
2007 |
13.9 |
|
2008 |
13.4 |
|
2009 |
11.8 |
|
2010 |
11.5 |
|
2011 |
11.7 |
|
2012 |
11.9 |
|
2013 |
12 |
|
2014 |
12.2 |
|
2015 |
12.3 |
|
2016 |
12.4 |
|
2017 |
12.4 |
|
2018 |
12.7 |
|
2019 |
12.8 |
|
2020 |
12.2 |
|
2021 |
12.3 |
|
2022 |
1 |
|
2023 |
1 |
|
2024 |
1 |
|
2025 |
1 |
|
2026 |
1 |
|
2027 |
1 |
|
2028 |
1 |
|
2029 |
1 |
|
2030 |
1 |
|
2031 projected |
12.2 |
|
Note: 1 Not applicable. Source: U.S. Bureau of Labor Statistics. |
|
At its lowest level in February 2021, mining jobs were down by 23.0 percent from prepandemic levels. Although employment in mining is projected to recover 63,800 of these jobs over the 2021–31 decade, it is still less than half of the number of jobs lost during the pandemic.
The agriculture, forestry, fishing, and hunting sector is projected to add 15,700 jobs from 2021 to 2031, less than half of the number of jobs it added from 2011 to 2021. The projected smaller increase is due, in part, to the continued employment slowdown in the crop production industry and the continued decline in the number of self-employed workers within the agriculture, forestry, fishing, and hunting sector. The number of self-employed workers in this sector is projected to decline by 44,200 from 2021 to 2031 (-0.6 percent annually).
Of the 20 fastest growing employment industries, 7 are within the leisure and hospitality sector. (See publication table 2.3 under source data.) This sector suffered substantial job losses during the COVID-19 pandemic. As sector output and employment normalize and return to their long-term growth trends, many industries within the leisure and hospitality sector are projected to experience rapid recoveries from low 2021 employment levels. Despite rapid growth rates, the majority of these industries are generally small in comparison to others on the fastest growers list; therefore, the magnitude of jobs added are also generally small in comparison to others on the list, such as industries in the healthcare and social assistance sector.
Within leisure and hospitality, the promoters of events, and agents and managers industry is projected to be the fastest growing industry, at 3.4 percent annually, followed by amusement parks and arcades at 3.2 percent annually; and performing arts companies is projected to be the third fastest with a 3.0-percent annual growth from 2021 to 2031. Other industries that appear on the fastest employment growth list because of pandemic-related recoveries include support activities for mining; state and local government passenger transit; motion picture, video, and sound recording industries; museums, historical sites, and similar institutions; travel arrangement and reservation services; support activities for agriculture and forestry; other educational services; private; and other personal services.
Employment in healthcare and social assistance industries has trended up in the last seven projection periods; demand for healthcare services is expected to continue to increase because of the aging baby-boom population and continued growth in the number of patients with chronic conditions.49 Of the 20 fastest growing industries, 3 are within the healthcare and social assistance sector. The individual and family services industry is projected to be the fastest growing industry within this sector at an annual rate of 2.8 percent. Roughly three-quarters of the employment in the individual and family services industry is comprised of services for the elderly and persons with disabilities, which will see large increases in demand from the aging baby boom generation. Home healthcare services (2.0 percent annual growth rate) and offices of other health practitioners (1.9 percent annual growth rate) also make the fastest growers list. Healthcare and social assistance industries are expected to be not just amongst the fastest growers, but also within the largest employment gains, supporting an increasing share of U.S. total employment.
Of the 20 most rapidly declining employment industries, 14 industries stem from the manufacturing sector. (See publication table 2.4 under source data.) Increased international competition and continued automation that allows for an increase in overall production will continue to contribute to the loss of jobs for many industries within this sector.50 The tobacco manufacturing industry is projected to have the most rapid declines in industry employment, falling by 7.4 percent annually from 2021 to 2031.
Other industries projected to be among those with the most rapidly declining employment over the 2021–31 decade include coal mining within the mining sector, projected to decline by 3.0 percent annually. In addition, newspaper, periodical, book, and directory publishers within the information sector is also projected to decline—by 2.7 percent annually from 2021 to 2031. Losses in print readership and ad revenue and readership migration to digital media, as well as an uptick in digital ad revenue are the driving forces behind this employment decline.51
This section begins with a discussion of BLS employment projections of major occupational groups. It then highlights detailed occupations that are expected to see the fastest employment growth over the 2021–31 decade, and then it ends with a review of occupations that are projected to experience employment declines over the same period.
BLS produces employment projections for 22 major occupational groups.52 Chart 14 shows these groups’ projected percent changes in employment between 2021 and 2031, including the share of projected employment growth that has already been realized as of August 2022.
| Occupational group | Projected percent change, 2021-31, beyond realized employment growth | Percent change, realized as of August 2022 |
|---|---|---|
|
Healthcare support |
15.7 | 2.2 |
|
Computer and mathematical |
10.9 | 4.6 |
|
Personal care and service |
8.3 | 5.8 |
|
Food preparation and serving related |
2.9 | 8.3 |
|
Community and social service |
8.2 | 2.1 |
|
Legal |
7.5 | 2.1 |
|
Healthcare practitioners and technical |
6.6 | 2.0 |
|
Management |
4.0 | 3.6 |
|
Business and financial operations |
3.6 | 3.6 |
|
Educational instruction and library |
3.6 | 3.6 |
|
Life, physical, and social science |
3.3 | 3.6 |
|
Arts, design, entertainment, sports, and media |
1.9 | 4.8 |
|
Transportation and material moving |
1.7 | 4.7 |
|
Building and grounds cleaning and maintenance |
2.1 | 3.3 |
|
Total, all occupations |
1.4 | 3.8 |
|
Installation, maintenance, and repair |
1.4 | 3.6 |
|
Construction and extraction |
0.4 | 3.2 |
|
Architecture and engineering |
0.0 | 3.6 |
|
Protective service |
0.5 | 1.6 |
|
Farming, fishing, and forestry |
0.8 | 0.0 |
|
Sales and related |
-1.1 | 1 |
|
Production |
-1.9 | 1 |
|
Office and administrative support |
-4.5 | 1 |
|
Note: 1 Not applicable. Data for percent change realized as of August 2022 are estimates of the employment change from the 2021 base year of the projections through the most recent historical data available as of August 2022, excluding occupational groups with a projected employment decline. Components may not add to total projected percent change because of rounding. Source: U.S. Bureau of Labor Statistics. |
||
The vast majority of occupational groups, 19 of 22, are expected to experience employment growth over the projections decade with the healthcare support, computer and mathematical, and personal care and service groups projected to be the three fastest growing groups. These groups’ rapid employment growth is mainly attributable to structural factors in the economy that are expected to increase long-run demand for the occupations within these groups. This structural growth can be seen in chart 14, with job gains as of August 2022 accounting for only a minor share of their projected 2021−31 employment growth, indicating that structurally-driven, longer term gains in employment are mostly expected. The community and social service group, whose projected employment growth is also well above the all-occupation average, shows these characteristics as well.
On the other hand, some groups’ projected employment growth largely reflects short-term cyclical growth rather than long-term expected job gains. This is the case for the food preparation and serving related occupational group, for example, which suffered heavy employment losses in 2020 because of the COVID-19 pandemic. As chart 14 shows, although it is projected to grow rapidly—the fourth-fastest of all groups—much of the employment growth projected over 2021−31 has been realized already, as employment grew substantially throughout the first half of 2022.
Meanwhile, three occupational groups are expected to see employment decline over the projections decade. These include the production, sales and related, and office and administrative support groups, groups that were also projected to lose jobs in the previous two projections sets.53
As shown in the industry employment section, the healthcare and social assistance sector is projected to be the second-fastest growing sector between 2021 and 2031. This sectoral growth in turn is expected to drive rapid employment growth for several healthcare occupations, which are concentrated in both the healthcare support—the fastest growing of all occupational groups—and the healthcare practitioners and technical occupational groups. (See chart 14.) The growing size of the older adult population, who tends to have more healthcare needs and to require more complex care than younger people, is a major factor driving long-term structural demand for these occupations. In addition, the increasing prevalence of chronic conditions—such as heart disease, cancer, and diabetes—among the general population will bolster demand for healthcare services.
Employment of nurse practitioners is expected to grow 45.7 percent over the projections period, the fastest among all 832 detailed occupations. (See chart 15.) Along with physician assistants, this occupation is poised to see greater demand as the widely documented physician shortage prompts healthcare providers to increasingly adopt team-based models of care delivery.54 Moreover, an aging population will result in an increased need for therapy services to treat a variety of age-related conditions, fueling demand for occupational therapy assistants and physical therapist assistants.55 Similarly, an increasing number of seniors is expected to augment demand for long-term care services, including assistance with the activities of daily living. This increase, combined with the general preference of older adults to “age in place” and policy changes encouraging the provision of home- and community-based services, will boost demand for home health and personal care aides.56
| 2021 National Employment Matrix title | Percent employment change, 2021–31 | Employment change (in thousands), 2021–31 | Median annual wage, 2021 |
|---|---|---|---|
|
Nurse practitioners |
45.7 | 112.7 | $120,680 |
|
Wind turbine service technicians |
44.3 | 4.9 | $56,260 |
|
Ushers, lobby attendants, and ticket takers |
40.5 | 25.6 | $24,440 |
|
Motion picture projectionists |
40.3 | 0.8 | $29,350 |
|
Cooks, restaurant |
36.6 | 459.9 | $30,010 |
|
Data scientists |
35.8 | 40.5 | $100,910 |
|
Athletes and sports competitors |
35.7 | 5.7 | $77,300 |
|
Information security analysts |
34.7 | 56.5 | $102,600 |
|
Statisticians |
32.7 | 11.2 | $95,570 |
|
Umpires, referees, and other sports officials |
31.7 | 4.2 | $35,860 |
|
Note: Data are from the Occupational Employment and Wage Statistics program, U.S. Bureau of Labor Statistics. Wage data cover nonfarm wage and salary workers and do not cover the self-employed, owners and partners in unincorporated firms, or household workers. Some occupations are expected to experience cyclical recovery from the COVID-19 recession, which results in fast growth for these occupations. Source: U.S. Bureau of Labor Statistics. |
|||
In all, healthcare occupations (including one managerial-type occupation tied to the healthcare industry) make up 6 of the 30 fastest growing occupations between 2021 and 2031. (See publication table 1.3 under source data.) In addition, healthcare occupations are expected to account for roughly one of every four new jobs added over the 2021–31 decade. (See publication table 1.1 under source data.) Notably, home health and personal care aides are expected to add the most jobs of any occupation. Employment is projected to grow by about 924,000 over this period, reaching an employment level of 4.6 million in 2031, which would make it the largest occupation in the economy. (See publication table 1.4 under source data.)
Employment in the computer and mathematical occupational group is projected to grow 15.4 percent from 2021 to 2031, the second-fastest of all groups. (See chart 14.) As with healthcare occupations, structural changes in the economy are set to drive long-term demand for computer and mathematical occupations, with 3 of them featuring among the 10 fastest growing occupations. (See chart 15.) The growth of the digital economy is the primary driver behind the strong demand expected for these workers.57 Computer occupations will be at the forefront of developing and deploying the technological applications and solutions needed in an increasingly digitized economy, such as Internet of Things consumer and industrial devices, IT services including cloud computing and cybersecurity services, artificial intelligence (AI) tools and robotics, and other technologies.
Additionally, the onset of the COVID-19 pandemic accelerated the shift to online activity with the increased adoption of remote and hybrid work arrangements, a surge in consumer use of e-commerce and app-based services, and an expansion of telehealth services—trends that are expected to further support demand for computer occupations over the 2021–31 decade.58 Parallel to the growth of the digital economy is the generation of massive amounts of data. This trove of data will drive up demand for mathematical science occupations as they will be needed to collect, organize, and analyze these vast quantities of data in order to derive insight and aid decision-making processes. In total, 3 computer occupations, namely information security analysts, web developers, and software developers, and 3 mathematical science occupations, specifically data scientists, statisticians, and operations research analysts, are among the top 30 fastest growing occupations for 2021–31. (See publication table 1.3 under source data.)
Food preparation and serving related occupations are projected to be the fourth-fastest growing occupational group, with growth of 11.2 percent. In contrast to healthcare and computer and mathematical occupations, whose expected growth is primarily driven by structural factors, the projected job growth for this group largely reflects cyclical recovery from the COVID-19 recession. This cyclical recovery is also seen in some occupations that are part of the third-fastest growing personal care and service group, such as motion picture projectionists as well as ushers, lobby attendants, and ticket takers. In general, these occupations are concentrated in industries that suffered steep employment losses during the pandemic, which, largely because of these industries’ still-low employment base in 2021 and projected recovery growth, may lead to affected occupations featuring on the fastest growing occupations list.
For example, restaurant cooks, dancers, and athletes and sports competitors are among the 30 occupations projected to see the fastest job growth from 2021 to 2031. These occupations are highly concentrated in leisure and hospitality-tied industries that were severely impacted by the pandemic, such as the food services and drinking places, performing arts companies, and spectator sports industries. Although the leisure and hospitality sector saw some recovery in demand in 2021 amid the roll-out of vaccines and pandemic relief aid that coincided with improved consumer sentiment, the sector was hampered by the surge in infections caused by the Delta variant.59 As a result, sector employment remained depressed in 2021. Thus, the rapid employment growth projected for the occupations employed within that sector reflects cyclical recovery effects. Of the 10 fastest growing occupations, 5 have a strong recovery growth component in their projections, with restaurant cooks also projected to add about 459,900 new jobs over the projections decade—the largest increase in employment after home health and personal care aides. In all, the 30 occupations with the largest projected job increases are expected to account for three of every five new jobs added through 2031. (See publication table 1.4 under source data.)
Meanwhile, wind turbine service technicians are projected to have the second-fastest employment growth over the 2021–31 decade. (See chart 15.) Along with solar photovoltaic (PV) installers, who are also featured among the top 30 fastest growing occupations, these workers are set to see strong structural demand going forward because of the continued expansion of wind and solar power generation capacity, which has been facilitated by the increasing cost competitiveness of renewables against fossil fuels.60 As the adoption of renewable energy grows, more solar PV installers and wind turbine service technicians will be needed to install and maintain the associated infrastructure. Because these are small occupations, however, the fast projected growth will result in a limited number of jobs added over the projections decade, with less than 5,000 new jobs expected for each occupation. (See publication table 1.3 under source data.)
Over the 2021–31 decade, the office and administrative support occupational group is expected to see the strongest employment decline and to lose the largest number of jobs of any occupational group. (See table 3.) Automation of administrative and clerical tasks via the use of software and other technologies is expected to dampen demand for these workers. For instance, software tools for managing schedules and gathering customer information reduce the need for secretaries and administrative assistants,61 while continued improvements in communication technologies, such as AI-based virtual assistants, opens up more room for displacing customer service representatives.62 Of the 30 occupations expected to have the fastest drop in employment between 2021 and 2031, 7 are in the office and administrative support group, with word processors and typists’ employment projected to decrease 38.2 percent—the sharpest decline of any occupation. (See publication table 1.5 under source data.) Moreover, four of the five occupations projected to lose the most jobs over the 2021–31 decade are office and administrative support workers. (See publication table 1.6 under source data.) These four occupations alone, which include office clerks and customer service representatives, in turn account for almost two-thirds of all the projected job losses for this occupational group.
| Occupational group | Percent employment change, 2021–31 | Employment change, 2021–31 (thousands) |
|---|---|---|
| Office and administrative support | -4.5 | -880.8 |
| Production | -1.9 | -163.6 |
| Sales and related | -1.1 | -164.5 |
| Source: U.S. Bureau of Labor Statistics. | ||
As noted in the industry employment section, many industries within the manufacturing sector are expected to experience rapid employment declines over the projections period, resulting in projected job losses for many occupations concentrated in manufacturing. The continued adoption of various automation technologies in manufacturing operations is expected to put downward pressure on employment of production occupations. For example, manufacturers are increasingly integrating collaborative robots (cobots) into their production lines, which, by performing repetitive tasks and freeing up workers to perform other higher-value tasks, leads to productivity gains.63 Close to half of the 30 occupations expected to experience the fastest job losses in 2021–31 are tied to the production occupational group. (See publication table 1.5 under source data.)
Lastly, the growth of e-commerce, which has pressured margins and led to declining business at brick-and-mortar stores, is the main factor expected to weigh on employment in the sales and related occupational group.64 Although the COVID-19 pandemic amplified the impact of this trend, retailers’ adoption of various strategies to draw consumers to stores—for instance, improving the customer shopping experience or offering buy online, pick up in-store options—may support employment demand to some extent.65 The bulk of the projected employment losses for the sales and related group stems from just three occupations primarily employed in retail settings, namely retail salespersons, cashiers, and first-line supervisors of retail sales workers. (See publication table 1.2 under source data.) Notably, cashiers—the second largest occupation within the group—is projected to lose more jobs than any other occupation, shedding a total of about 335,700 positions between 2021 and 2031. (See publication table 1.6 under source data.) The proliferation of self-check machines is a key driver behind this expected decline.66
Because of an aging population and slower population growth, labor force growth is expected to be slower in 2021–31 than in previous decades. Older people participate in the labor force less than younger people do, so an aging population shrinks the pool of workers available for employment. The ongoing effects of the pandemic translate to a low employment figure for the 2021 base year of the projections, producing cyclical growth as the economy recovers. Total employment is projected to grow 5.3 percent from 2021 to 2031.
Over the projections period, employment is projected to grow faster in the service-providing sector than in the goods-producing sector. Occupations that provide healthcare or services related to healthcare are projected to be among those with the fastest employment growth. An aging population is projected to drive demand for more healthcare and related services. In addition, the number of people with chronic health conditions is expected to continue to grow, adding to the demand for services provided by healthcare-related occupations. Other occupations projected to grow rapidly include those involving computers, data, and renewable energy. Fast growth is also projected for many occupations concentrated in industries expected to recover from pandemic-induced declines, namely those in the leisure and hospitality sector.
Although the extent of structural economic change arising from the COVID-19 pandemic remains uncertain, some industries and occupations are expected to see altered long-term growth trajectories because of pandemic impacts. These include computer-related industries and occupations, which are expected to see higher demand from expanded telework, and retail trade, which is expected to decline as a result of an accelerated shift from brick-and-mortar retail to e-commerce.
Kevin S. Dubina, Janie-Lynn Kim, Javier Colato, and Michael J. Rieley, "Projections overview and highlights, 2021–31," Monthly Labor Review, U.S. Bureau of Labor Statistics, November 2022, https://doi.org/10.21916/mlr.2022.28
1 All annual growth rates in this article refer to a compound annual growth rate.
2 In this discussion, cyclical change refers to short-term business cycle fluctuations around a trend. For example, employment may decline in a particular industry during a recession (cyclical decline) and grow during the recovery immediately following the recession (cyclical growth), eventually returning to the long-term trend. Structural change refers to the long-term trend and, in the case of employment, reflects changes in the allocation of employment by industry and occupation. Structural changes in industry or occupational employment are based on factors such as changes in consumer preferences that affect the demand for goods and services or new technology that affects production practices.
3 Population refers to the civilian noninstitutional population ages 16 and older, excluding “active duty members of the U.S. Armed Forces; people confined to, or living in, institutions or facilities such as prisons, jails, and other correctional institutions and detention centers; and residential care facilities such as skilled nursing homes.” (https://www.bls.gov/cps/definitions.htm#population).
4 The baby boomer generation is defined as individuals born in years 1946 to 1964, and who will be between ages 67 and 85 years old in 2031.
5 Total employment is the sum of the employment figures for nonagricultural wage and salary workers; agricultural, forestry, fishing, and hunting workers; and self-employed workers. Nonagricultural wage and salary employment data are from the U.S. Bureau of Labor Statistics (BLS) Current Employment Statistics (CES) survey, excluding data for logging, and include private household employment data, which are provided by the Current Population Survey (CPS). The CPS also provides data for self-employed workers and agricultural, forestry, fishing, and hunting workers, except data for logging workers, which are provided by the CES survey.
6 “U.S. business cycle expansions and contractions” (Cambridge, MA: National Bureau of Economic Research, last updated July 19, 2021), https://www.nber.org/research/data/us-business-cycle-expansions-and-contractions.
7 Victoria Gregory and Joel Steinberg, “Why Are Workers Staying Out of the U.S. Labor Force?,” Regional Economist (Federal Reserve Bank of St. Louis, February 2, 2022), https://www.stlouisfed.org/publications/regional-economist/2022/feb/why-workers-staying-out-us-labor-force?
8 “Nonfarm payroll employment rose by 528,000 in July 2022,” The Economics Daily (U.S. Bureau of Labor Statistics, August 9, 2022), https://www.bls.gov/opub/ted/2022/nonfarm-payroll-employment-rose-by-528000-in-july-2022.htm.
9 Frank Pallotta, “Movie theaters reopened in 2021. In 2022 we'll see if they can thrive,” CNN, January 15, 2022, https://www.cnn.com/2022/01/15/media/2022-movie-box-office-preview/index.html.
10 Sara Hylton, Lindsey Ice, and Emily Krutsch, “What the long-term impacts of the COVID-19 pandemic could mean for the future of IT jobs,” Beyond the Numbers vol. 11, no. 3 (U.S. Bureau of Labor Statistics, February 2022), https://www.bls.gov/opub/btn/volume-11/what-the-long-term-impacts-of-the-covid-19-pandemic-could-mean-for-the-future-of-it-jobs.htm.
11 BLS develops macroeconomic projections with the Macroeconomic Advisers (MA) model, a structural econometric model of the U.S. economy. The model, licensed from MA by IHS Markit, comprises more than 1,000 variables, behavioral equations, and identities. Central characteristics of the MA model are a life-cycle model of consumption, a neoclassical view of investment, and a vector autoregression for the monetary policy sector of the economy. The full-employment foundation of the model is the most critical characteristic for the BLS outlook. Within MA, a submodel calculates an estimate of potential output from the nonfarm business sector. The calculation is based on full-employment estimates of the sector’s hours worked and output per hour. Error-correction models are embedded in the MA model so that the model’s solution is aligned with the full-employment submodel. MA does not forecast sharp cyclical movements in the economy over the 10-year projection horizon. “Add-factors” are either left unchanged after the first couple of years of the solution or returned to historical norms. Add-factors represent changes made to the base result of a forecast or projection equation; see “Glossary of statistical terms” (Organization for Economic Co-operation and Development, September 25, 2001, updated March 28, 2014), https://stats.oecd.org/glossary/detail.asp?ID=44. The structure of the model, exogenous assumptions, and MA’s view of the Federal Reserve’s long-term policy objective largely determine the characteristics of the model’s long-term outlook for the economy. For more information, see http://www.macroadvisers.com/.
12 Energy Information Administration estimates include prices for West Texas Intermediate crude oil, Brent crude oil, and natural gas and assume that current energy regulations will remain unchanged. For more information, see Annual energy outlook 2022 (U.S. Energy Information Administration, March 3, 2022, released annually), https://www.eia.gov/outlooks/aeo/.
13 For a detailed description of the projections process, see “Employment projections methods overview,” Employment Projections (U.S. Bureau of Labor Statistics), https://www.bls.gov/emp/documentation/projections-methods.htm.
14 This fact refers to annual data. The same cannot be said for monthly or quarterly data.
15 With a single exception when population growth fell from 104,995 in 1950 to 104,621 in 1951.
16 The recent pandemic baby bust did cause birth rates to drop below the 1.7 to 2.1 range. However, since BLS population only includes those 16 and older this baby bust does not impact the 10-year projected timeline. For historic fertility rates see “Fertility rate, total (births per woman)—United States” (The World Bank), https://data.worldbank.org/indicator/SP.DYN.TFRT.IN?locations=US.
17 “Net migration—United States” (The World Bank), https://data.worldbank.org/indicator/SM.POP.NETM?locations=US. Data are estimated 5-year inflows, so it is not possible to calculate precise annual averages.
18 See Jason Schachter, Pete Borsella and Anthony Knapp, “New population estimates show COVID-19 pandemic significantly disrupted migration across borders” (U.S. Census Bureau, December 21, 2021), https://www.census.gov/library/stories/2021/12/net-international-migration-at-lowest-levels-in-decades.html.
19 Farida B. Ahmad, Jodi A. Cisewski, and Robert N. Anderson, “Provisional Mortality Data — United States, 2021,” Morbidity and Mortality Weekly Report, vol. 71, no. 17 (Centers for Disease Control and Prevention, April 29, 2022), pp. 597–600, https://www.cdc.gov/mmwr/volumes/71/wr/mm7117e1.htm.
20 Carla K. Johnson, “US deaths from COVID hit 1 million, less than 2 1/2 years in,” Associated Press, May 16, 2022, https://apnews.com/article/us-covid-death-toll-one-million-7cefbd8c3185fd970fd073386e442317.
21 Brian McNeill, “U.S. life expectancy continued to fall in 2021,” VCU News, April 7, 2022, https://news.vcu.edu/article/2022/04/us-life-expectancy-continued-to-fall-in-2021.
22 There are 3.3 million more individuals 65 and older in 2021 versus 2019, and the 25 to 64 population declined over that time. Using the participation rates for those two groups, 18.9 and 86.1 percent, we can break up the 3.3 million 65 and older into three groups: those still working, those who stopped working, and those who had already stopped working before turning 65. Those who stopped working can be calculated by subtracting 18.9 from 86.1, which yields 67.2 percent. Multiplying that 67.2 percent by the 3.3 million more individuals 65 and older now in the population yields 2.2 million who dropped out of the labor force. Had the 2.2 million individuals who dropped out of the labor force still been working, the participation rate in 2021 would have been 62.5 rather than 61.7. We can therefore estimate that aging accounted for approximately 0.8 of the percentage point of the decrease from 63.1 to 61.7 percent.
23 Gregory and Steinberg, “Why are workers staying out of the U.S. labor force?”.
24 See Katie Bach, “Is ‘long Covid’ worsening the labor shortage?,” Brookings, January 11, 2022 https://www.brookings.edu/research/is-long-covid-worsening-the-labor-shortage/. See also Lisa Beilfuss, “Where are the workers? Millions are sick with ‘Long Covid,’” Barron’s, December 8, 2021,
and Christopher Rowland, “Long covid is destroying careers, leaving economic distress in its wake,” Washington Post, December 9, 2021, https://www.washingtonpost.com/business/2021/12/09/long-covid-work-unemployed/.
25 Matt Phillips, “Corporate profits hit a new record high in 2021,” Axios, March 31, 2022, https://www.axios.com/2022/03/31/corporate-profits-new-record-high-2021.
26 Reade Pickert, “US Corporate Profits Soar With Margins at Widest Since 1950,” Bloomberg, August 25, 2022, https://www.bloomberg.com/news/articles/2022-08-25/us-corporate-profits-soar-taking-margins-to-widest-since-1950.
27 Public health arenas refers to public facilities, public spaces, workplaces, places of commerce, entertainment venues, schools, churches, etc. See https://www.asahi.com/ajw/articles/13832094 for an example of displaying air quality levels as well as https://www.pointenergyinnovations.com/covid-19-and-office-building-hvac-responses/ for a more detailed list of ways to improve air quality within “public health arenas.”
For an example of a potential scientific breakthrough, see “Easy to use nasal Covid vaccines can be game changer: Scientists,” The Week, September 14, 2022, https://www.theweek.in/news/health/2022/09/14/easy-to-use-nasal-covid-vaccines-can-be-game-changer--scientists.html; and Marla Broadfoot, “Nose spray vaccines could quash COVID virus variants, Scientific American, May 3, 2022, https://www.scientificamerican.com/article/nose-spray-vaccines-could-quash-covid-virus-variants/.
28 For a more thorough discussion of full employment and potential output and how the two concepts relate to BLS projections, see Kevin S. Dubina, “Full employment: an assumption within BLS projections,” Monthly Labor Review, November 2017, https://www.bls.gov/opub/mlr/2017/article/full-employment-an-assumption-within-bls-projections.htm.
29 U.S. Bureau of Labor Statistics, “Consumer Price Index for All Urban Consumers: All items in U.S. city average [CPIAUCSL]” (retrieved from FRED, Federal Reserve Bank of St. Louis, June 22, 2022), https://fred.stlouisfed.org/series/CPIAUCSL.
30 The Current Population Survey published an unemployment rate of 5.4 percent in 2021. CPS calculates this rate using data rounded to a finer precision then is used within projection models. The unemployment level and population level used within the BLS projection model uses data rounded to the nearest hundred.
See Kevin S. Dubina, “Full employment: an assumption within BLS projections,” Monthly Labor Review, November 2017, https://www.bls.gov/opub/mlr/2017/article/full-employment-an-assumption-within-bls-projections.htm.
31 When speaking in terms of rates of the labor force this is mathematically always true, however, in terms of levels, it is possible for both unemployment and employment levels to decrease or increase simultaneously.
32 Paul A. Samuelson and William D. Nordhaus, Economics 17th edition (New York: McGraw-Hill, 2001), p. 270.
33 Board of Governors of the Federal Reserve System (US), “Federal Funds Effective Rate [FEDFUNDS]” (retrieved from FRED, Federal Reserve Bank of St. Louis), https://fred.stlouisfed.org/series/FEDFUNDS, August 9, 2022.
34 “Recent balance sheet trends” (Board of Governors of the Federal Reserve System, updated weekly) https://www.federalreserve.gov/monetarypolicy/bst_recenttrends.htm.
35 “Federal Reserve issues FOMC statement” (Board of Governors of the Federal Reserve System, July 27, 2022), https://www.federalreserve.gov/newsevents/pressreleases/monetary20220727a.htm.
36 Lorie Konish, “How effective were those stimulus checks? Some argue the money may have fueled inflation,” CNBC, June 11, 2022, https://www.cnbc.com/2022/06/11/the-pandemic-stimulus-checks-were-a-big-experiment-did-it-work.html.
37 Zack Friedman, “Unemployment benefits end today for millions of Americans,” Forbes, September 5, 2021 https://www.forbes.com/sites/zackfriedman/2021/09/05/unemployment-benefits-end-tomorrow-for-millions-of-americans/?sh=24ee84587f02.
38 “Expiration of child tax credits hits home,” PBS News Hour, January 14, 2022, https://www.pbs.org/newshour/nation/expiration-of-child-tax-credits-hits-home.
39 Throughout this article, output refers to real output in chain-weighted 2012 dollars.
40 “25 industries and tech shaping the post-covid world,” CBInsights, December 14, 2021, https://www.cbinsights.com/research/report/industries-tech-shaping-world-post-covid/.
41 Tara O’Neill Hayes and Serena Gillian, “Chronic disease in the United States: a worsening health and economic crisis” (American Action Forum, September 10, 2020), https://www.americanactionforum.org/research/chronic-disease-in-the-united-states-a-worsening-health-and-economic-crisis/.
42 “Overall tobacco trends” (American Lung Association, no date), https://www.lung.org/research/trends-in-lung-disease/tobacco-trends-brief/.
43 SingleCare Team, “Vaping statistics 2022,” The Checkup (blog), last updated February 15, 2022, https://www.singlecare.com/blog/news/vaping-statistics.
Electronic vapor cigarettes fall under the “other chemical product and preparation” industry and so their manufacture does not increase employment in the tobacco manufacturing industry. See North American Industry Classification System (NAICS) (2017) code 3259, https:/www.census.gov/naics/?input=325998&year=2017&details=325998.
44 See “Annual Energy Outlook 2022” (U.S. Energy Information Administration, March 3, 2022), https://www.eia.gov/outlooks/aeo/pdf/AEO2022_ChartLibrary_Electricity.pdf; and Brad Plumer, “In a first, renewable energy is poised to eclipse coal in U.S.,” New York Times, May 13, 2020, https://www.nytimes.com/2020/05/13/climate/coronavirus-coal-electricity-renewables.html.
45 For more information about total employment, see note 5.
46 Nonagricultural wage and salary employment data are from the CES, except for private household employment data, which are from the CPS. Logging workers are excluded.
47 Daniel Dorfman, “Retail trade employment: before, during, and after the pandemic,” Beyond the Numbers vol. 11, no. 4 (U.S. Bureau of Labor Statistics, April 2022), https://www.bls.gov/opub/btn/volume-11/retail-trade-employment-before-during-and-after-the-pandemic.htm.
48 Will Kimball and Robert E. Scott, “China trade, outsourcing and jobs” (Economic Policy Institute, December 11, 2014), https://www.epi.org/publication/china-trade-outsourcing-and-jobs/ and Christoph E. Boehm, Aaron Flaaen, Nitya Pandalai-Nayar, “Multinationals, offshoring and the decline of U.S. manufacturing,” Working Paper 25824 (Cambridge, MA: National Bureau of Economic Research, May 2019), https://www.nber.org/system/files/working_papers/w25824/w25824.pdf.
49 Hayes and Gillian, “Chronic disease in the United States.”
50 Alexa Lardieri, “Robots will replace 20 million jobs by 2030, Oxford report finds,” U.S. News, June 26, 2019, https://www.usnews.com/news/economy/articles/2019-06-26/report-robots-will-replace-20-million-manufacturing-jobs-by-2030.
51 “Newspapers Fact Sheet” (Pew Research Center, June 29, 2021), http://www.journalism.org/fact-sheet/newspapers/ and “Digital News Fact Sheet” (Pew Research Center, July 27, 2021), https://www.pewresearch.org/journalism/fact-sheet/digital-news/.
52 BLS uses the Standard Occupational Classification (SOC) system to categorize occupations into 23 major groups on the basis of the job duties performed in these occupations. The BLS Employment Projections program does not develop projections for SOC group 55-0000, military specific occupations. See “2018 Standard Occupational Classification system” (U.S. Bureau of Labor Statistics), https://www.bls.gov/soc/2018/major_groups.htm.
53 Kevin S. Dubina, Lindsey Ice, Janie-Lynn Kim, and Michael J. Rieley, “Projections overview and highlights, 2020–30,” Monthly Labor Review, October 2021, https://www.bls.gov/opub/mlr/2021/article/projections-overview-and-highlights-2020–30.htm.
54 Jerry Stone, “How the nurse practitioner is an integral part of the healthcare team,” MedicalGPS (blog), May 6, 2021.
55 David Y. Lo and Nicholas J. Janiga, “2021 update: physical therapy clinics and centers” (Healthcare Appraisers, October 13, 2021), https://healthcareappraisers.com/wp-content/uploads/2021/10/2021-Update-Physical-Therapy-Clinics-Centers-PDF.pdf.
56 Carrie Henning-Smith, John Mulcahy, Megan Lahr, and Jill Tanem, “Preferences for long-term care arrangements among rural and urban older adults” (Minneapolis, MN: UMN Rural Health Research Policy Center, May 2021), https://rhrc.umn.edu/wp-content/uploads/2021/09/UMN-Aging-in-Place-Policy-Brief_5.1.21_508.pdf.
57 Alan Zilberman and Lindsey Ice, “Why computer occupations are behind strong STEM employment growth in the 2019–29 decade,” Beyond the Numbers vol. 10, no. 1 (U.S. Bureau of Labor Statistics, January 2021), https://www.bls.gov/opub/btn/volume-10/why-computer-occupations-are-behind-strong-stem-employment-growth.htm.
58 Sara Hylton, Lindsey Ice, and Emily Krutsch, “What the long-term impacts of the COVID-19 pandemic could mean for the future of IT jobs,” Beyond the Numbers vol. 11, no. 3 (U.S. Bureau of Labor Statistics, February 2022), https://www.bls.gov/opub/btn/volume-11/what-the-long-term-impacts-of-the-COVID-19-pandemic-could-mean-for-the-future-of-it-jobs.htm.
59 Frank Steemers, “Lackluster job growth amid delta and labor shortages,” The Conference Board (blog), October 8, 2021, https://www.conference-board.org/blog/global-economy/employment-comment-oct-2021.
60 William Lawhorn, “Solar and wind generation occupations: a look at the next decade,” Beyond the Numbers vol. 10, no. 4 (U.S. Bureau of Labor Statistics, February 2021), https://www.bls.gov/opub/btn/volume-10/solar-and-wind-generation-occupations-a-look-at-the-next-decade.htm.
61 Laura Dolan, “5 ways to automate repetitive tasks in the office,” Keap, last updated September 20, 2022, https://keap.com/business-success-blog/marketing/automation/7-time-sucking-office-tasks-that-you-can-automate.
62 Cathal McGloin, “How bots automate customer service while lowering costs,” Servisbot, https://servisbot.com/virtual-assistants-power-customer-service-automation/.
63 Antoine Martin and Balasz Daniel, “How manufacturers can make the most of cobots,” Accenture, July 14, 2021, https://www.accenture.com/us-en/blogs/industry-digitization/how-manufacturers-can-make-the-most-of-cobots.
64 Daniel Dorfman, “Retail trade employment: before, during, and after the pandemic,” Beyond the Numbers vol. 11, no. 4 (U.S. Bureau of Labor Statistics, April 2022), https://www.bls.gov/opub/btn/volume-11/retail-trade-employment-before-during-and-after-the-pandemic.htm.
65 Dorfman, “Retail trade employment.”
66 Nathaniel Meyersohn, “Nobody likes self-checkout. Here’s why it’s everywhere,” CNN, July 10, 2022, https://www.cnn.com/2022/07/09/business/self-checkout-retail/index.html.