
An official website of the United States government
 United States Department of Labor
An official website of the United States government
United States Department of Labor

The .gov means it's official.
Federal government websites often end in .gov or .mil. Before sharing sensitive information,
make sure you're on a federal government site.

The site is secure.
The
https:// ensures that you are connecting to the official website and that any
information you provide is encrypted and transmitted securely.


The Current Population Survey (CPS) is a nationally representative survey that is the primary source of U.S. labor force statistics, including the official unemployment rate. It is a monthly survey with a sample of 60,000 households. Standard errors for January 2026 and later are available from the public database (LABSTAT) to assist data users in measuring the reliability of CPS estimates. These standard errors provide measures of precision for CPS labor force estimates and facilitate comparisons with other estimates representative of the same time period.
Standard errors are typically published in LABSTAT concurrently with the release of monthly CPS estimates. Due to month‑to‑month variation in processing workflows, however, the publication of standard errors may occur after the release of the estimates.
CPS estimates are subject to sampling and nonsampling error.
When a sample, rather than the entire population, is surveyed, estimates may differ from the true population values that they represent. The component of this difference that occurs because samples differ by chance is known as sampling error, and its variability is measured by the standard error of the estimate. An estimate, its respective standard error, and a critical value based on the confidence level can be used to build confidence intervals. BLS analyses are generally conducted at the 90-percent level of confidence. When the sample estimates and standard errors are unbiased, and the critical value is distributionally appropriate, these confidence intervals have well‑defined coverage properties. For example, under repeated sampling and assuming unbiasedness, 90-percent confidence intervals produced in this manner will contain the true population value 90 percent of the time.
Nonsampling error from CPS estimates can occur for many reasons, including the failure to sample a segment of the population, inability to obtain information for all respondents in the sample, inability or unwillingness of respondents to provide correct information, mistakes made by respondents, and errors made in the collection or processing of the data. A discussion of nonsampling error is available in Chapter 4.1 of the Current Population Survey Design and Methodology (Technical paper 77, October 2019).
An estimate and its respective standard error can be used to build a confidence interval, which is a range of values centered around the estimate that is likely to include the true population value with a degree of confidence. BLS analyses are generally conducted at the 90-percent level of confidence.
The standard errors available in the LN database are intended for comparing estimates within the same reference period. They can be used to assess whether estimates are statistically different from one another at a given confidence level—for example, when comparing the unemployment rate for two demographic groups in the same month.
Because of the complex CPS sample design in which households are interviewed multiple times over a 16-month period, these standard errors should not be used to test the statistical significance of changes over the month, quarter, or year. The use of standard errors in the LN database for comparisons over time is only appropriate when the estimates are far enough apart in time, at least 17 months, to ensure that the underlying samples are independent of each other. For changes over shorter time intervals, consult CPS documentation to determine whether 1-, 3-, 6-, 9-, and 12-month changes are statistically significant.
To construct a 90-percent confidence interval, begin with the estimate then add and subtract 1.645 times the standard error. Confidence intervals calculated in this manner are expected to contain the true population parameter in 90 percent of repeated samples.
In the chart displayed below, the green dots represent monthly estimates (unemployment rates for those age 25 and over) and the grey bars highlight their 90-percent confidence intervals. For example, the unemployment rate for those with a bachelor’s degree and higher was estimated at 2.8 percent with a standard error of 0.13. The grey bar shows a range of 1.645 times the standard error above and below the rate (ranging from 2.59 percent to 3.01 percent). Since this confidence interval overlaps with the confidence interval for those with some college or an associate degree, the two unemployment rates may or may not be statistically different in this given period. To determine whether the difference is statistically significant, a formal test must be conducted; readers can refer to Example 2, below, for an illustration of how to perform this test. By contrast, nonoverlapping confidence intervals indicate the estimates are statistically different from each other at a 90-percent confidence level.
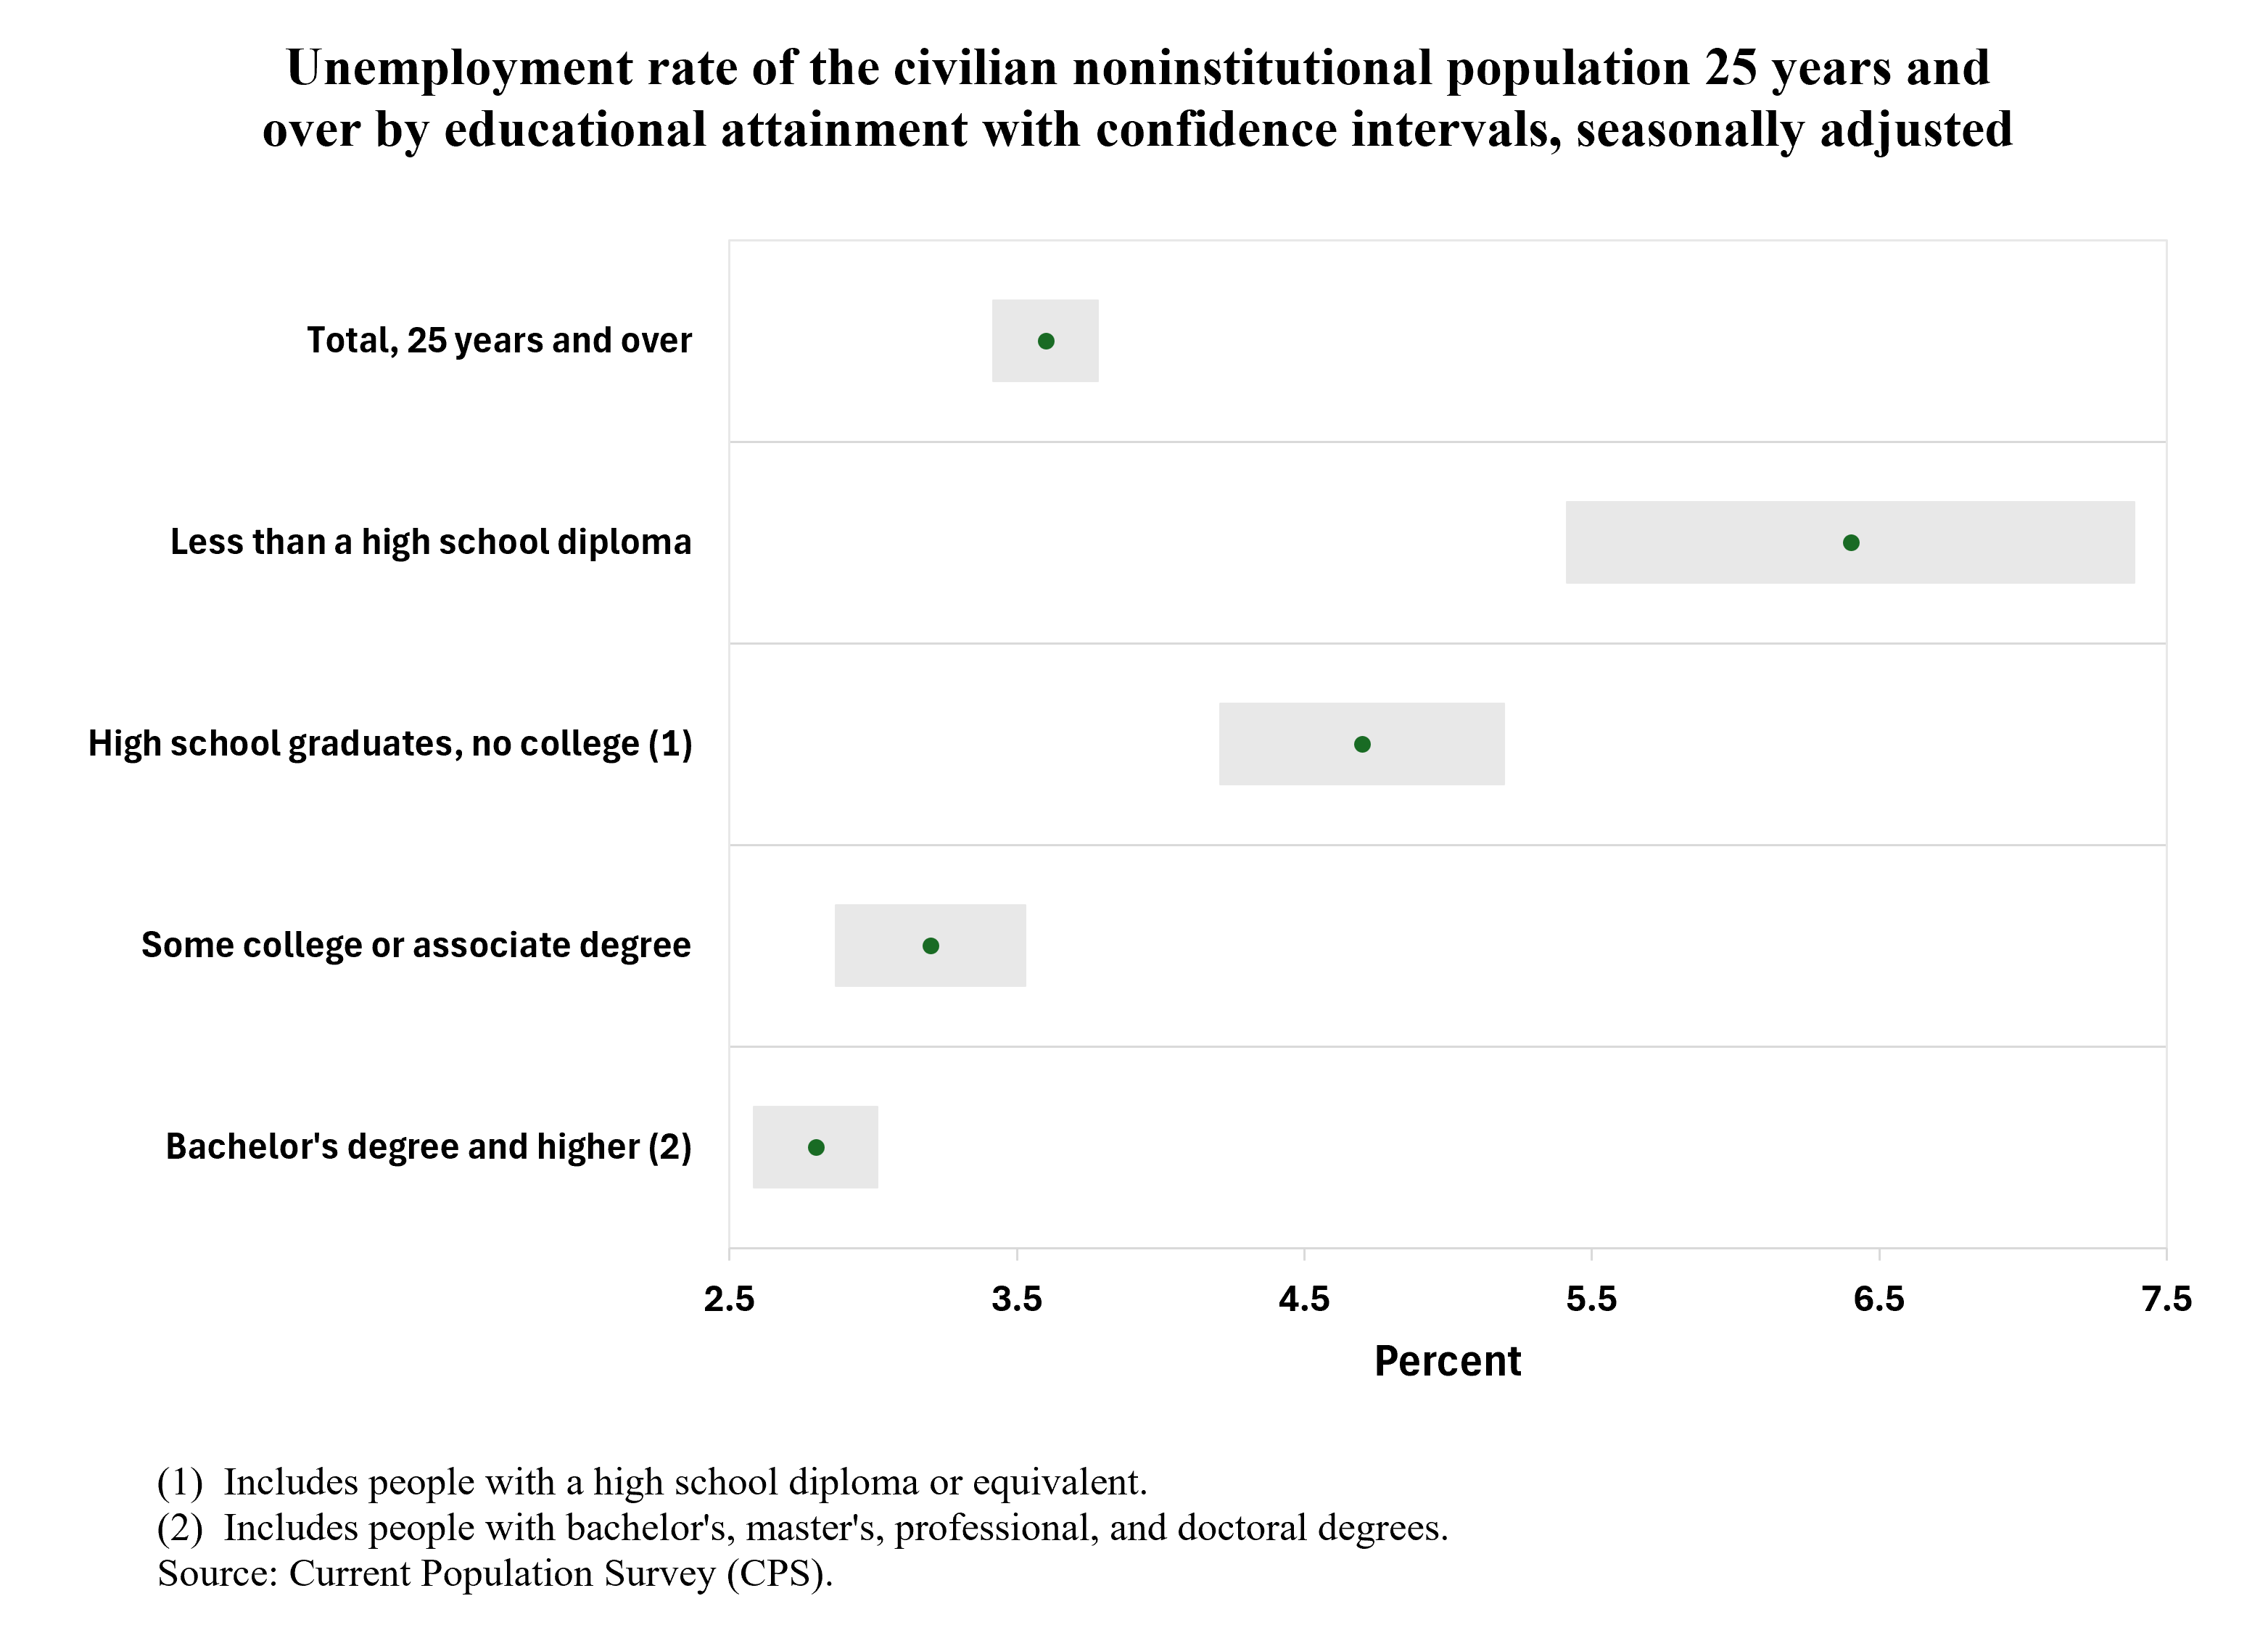
The width of a confidence interval varies across CPS data series even when these intervals are constructed at the same confidence level (such as 90 percent). This is because the width of the confidence interval reflects the size of the standard error. Standard errors differ because some estimates are based on smaller samples or more variable underlying populations, leading to greater variability and therefore wider confidence intervals. Conversely, estimates derived from larger samples or more stable populations will have smaller standard errors and narrower confidence intervals.
This example shows how to determine whether two CPS estimates representing the same time period—the labor force participation rates of men and women ages 25 to 54—are statistically different from one another.
| Description | Estimate (est) | Standard error (SE) |
|---|---|---|
Labor force participation rate for men ages 25 to 54 (est1) | 89.4% | 0.27 |
Labor force participation rate for women ages 25 to 54 (est2) | 78.0% | 0.34 |
The data for men and women come from independent subsamples of the broader population survey. In a sampling framework, two completely distinct, non-overlapping demographic groups have a sampling covariance of 0.
The 90-percent confidence interval for the difference in labor force participation rates between men and women ages 25 to 54 ranges from 10.69 to 12.11. Because the confidence interval does not include zero, the difference between the two estimates is statistically significant at the 90-percent confidence level. This means the labor force participation rate for men ages 25 to 54 is statistically higher than the rate for women ages 25 to 54 in this example.
If you do not find the information you need in this section, BLS also provides the following resources and guidance on how to calculate standard errors and confidence intervals for CPS estimates, please see resources for determining the reliability and statistical significance of CPS estimates.
Last Modified Date: July 22, 2026