
An official website of the United States government
 United States Department of Labor
An official website of the United States government
United States Department of Labor

The .gov means it's official.
Federal government websites often end in .gov or .mil. Before sharing sensitive information,
make sure you're on a federal government site.

The site is secure.
The
https:// ensures that you are connecting to the official website and that any
information you provide is encrypted and transmitted securely.


The Bureau of Labor Statistics releases the Employment Situation, or the “jobs report” every month, a news release that includes data from two surveys: the Current Population Survey (CPS) and the Current Employment Statistics (CES) survey. The news release includes data tables from each: the “A” tables from the CPS and the “B” tables from the CES.
Each month, CPS publishes a set of statistical significance tables (XLSX) which correspond to each of the “A” tables in the Employment Situation, that is, summary table A and tables A-1 through A-16.
These statistical significance tables allow data users to determine whether seasonally adjusted estimates are statistically significant at a 90-percent confidence level compared to the prior month, or compared to 3, 6, 9 or 12 months prior. For not seasonally adjusted estimates, the values to determine statistical significance are available for the prior month and 12 months prior.
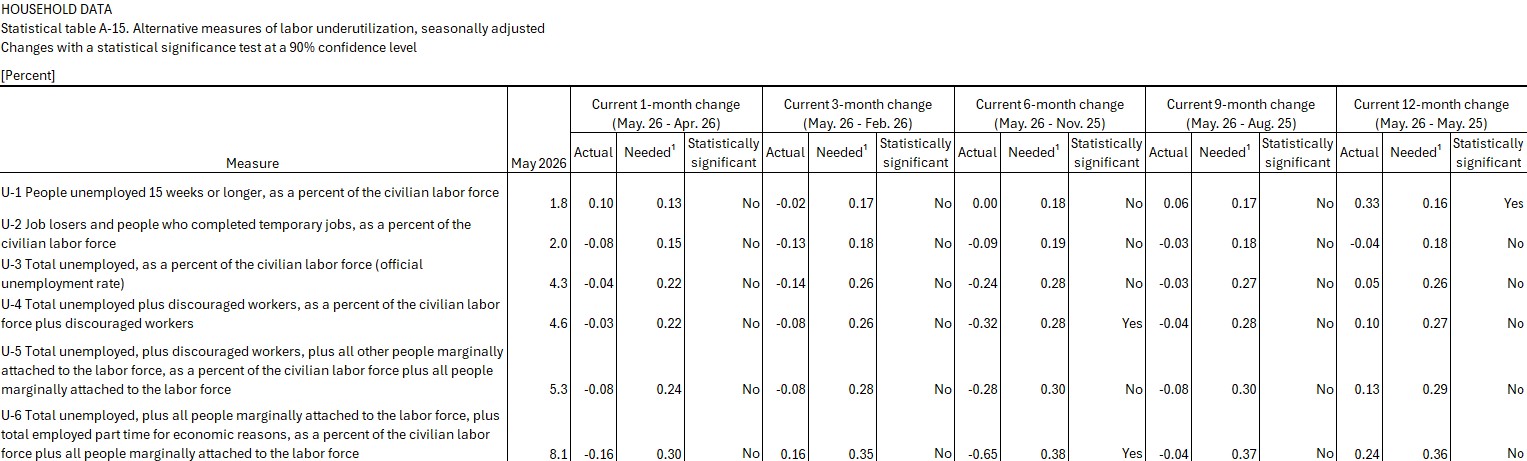
To illustrate, see the image, below, of statistical table A-15. The table includes: the estimates for the latest period (in this case it was May 2026); the 1-, 3-, 6-, 9-, and 12-month changes calculated with more precision than appears on the “A” tables; a “Needed” column that provides the needed change for the estimate to be statistically significant at a 90-percent confidence level; and a “Statistically significant” column providing a “Yes” if the change was significant and a “No” if it was not significant.
Labor market indicators, such as the unemployment rate, are estimates produced from a sample survey. Since a sample is surveyed, rather than the entire population, each estimate produced from the survey will have some level of error associated with it. Sampling errors are differences between the results calculated from a sample of observations and those calculated from all observations in the population.
The statistical significance tables provide a data user the value for the confidence interval range around an estimate at a 90-percent confidence level.
Consider the following statement from the September 2025 Employment Situation:
...the unemployment rate, at 4.4 percent…changed little in September.
The unemployment rate in August 2025 was 4.3 percent
From the statistical significance tables, we observe the unrounded over-the-month change in the unemployment rate: 0.12
But the Needed column for the 1-month change (which represents the absolute value of the minimum change needed to be statistically significant at a 90 percent confidence level) is: 0.21
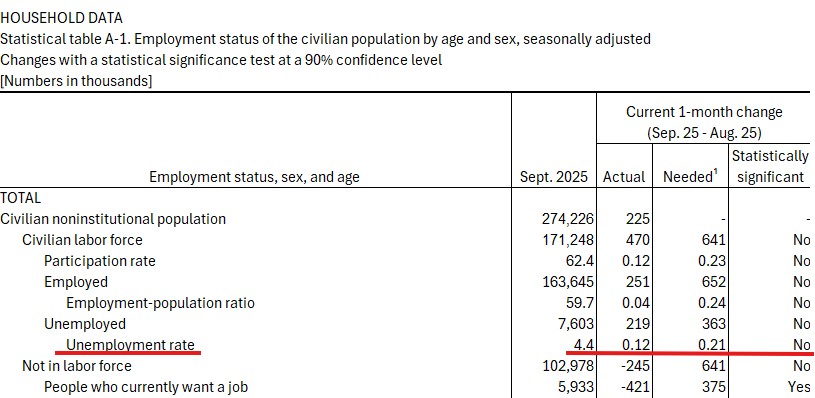
Thus, the one-month change in the unemployment rate from 4.3 percent in August 2025 to 4.4 percent in September 2025 was not statistically significant, and hence, the unemployment rate changed little over the month.
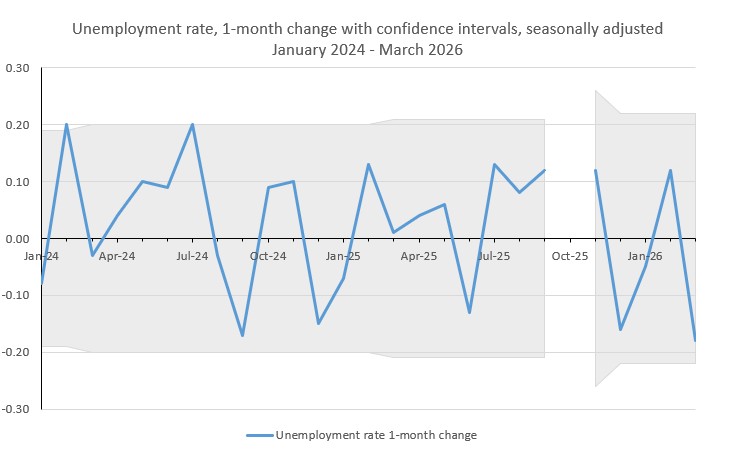
From January 2024 to March 2026, there were only two instances where the 1-month change in the national unemployment rate was statistically significant. In the chart below, the shaded gray area represents a 90-percent confidence interval for each over-the-month change. You can see that for most months, the change in the unemployment rate was within the confidence interval. In order for it to be statistically significant, it needs to be the same value or greater than the bounds in the shaded area, as it is in February 2024 and July 2024.
Data users can assess statistically significant change over time for a variety of estimates found in the Employment Situation A tables, such as: estimates by nativity, educational attainment, veteran status, class of worker, reasons for unemployment, duration of unemployment, occupation, and industry.
The comparisons over time in the statistical significance tables are not adjusted for population controls. Population controls are independent estimates of the population from the Census Bureau. They are updated annually in the CPS, typically in January, and are used to weight, or control, the survey results to reflect the size and composition of the civilian noninstitutional population age 16 and older. Thus, in some instances, analyses in the Employment Situation news releases will be different from what appears in the tables, as the analyses determine statistical significance after accounting for population control effects.
Consider the following passage from the March 2026 Employment Situation:
Both the labor force participation rate, at 61.9 percent, and the employment-population ratio, at 59.2 percent, changed little in March. These measures also showed little change over the year, after accounting for annual population control adjustments.
For the labor force participation rate, from the statistical significance tables, we observe the over-the-year change: -0.62
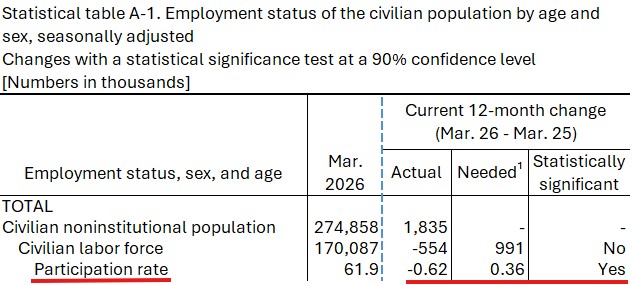
Based on the results in the table, it looks like the 12-month change in the labor force participation rate is statistically significant because the size of the change (0.62) exceeds the minimum change needed for significance (0.36). However, the effect on the rate from incorporating the 2026 updated population controls was: -0.4
In order to remove the effects of the population controls, the effect must be subtracted from the over-the-year change: -0.62 – (-0.4) = -0.22
Thus, because the absolute value of the 12-month change after accounting for population controls was 0.22 and statistical significance requires a minimum change of 0.36, the 12-month change from 62.5 percent in March 2025, to 61.9 percent in March 2026 was not statistically significant.
At this time, the public cannot replicate estimates in the “Needed” columns because they are calculated using unpublished standard errors that account for the survey’s complex design in which households are interviewed multiple times. These unpublished standard errors are calculated using the latest available data at the time of publication. Data users can follow these instructions for calculating approximate standard errors for CPS estimates to calculate “Needed” values for 1- and 12-month changes in labor force indicators that will be close to those appearing in the statistical significance tables.
To access resources for determining the reliability and statistical significance of CPS estimates, visit the Reliability of Current Population Survey estimates page.
BLS has published standard errors in the Labor Force statistics database. These standard errors provide measures of precision for CPS labor force estimates and facilitate comparisons with other estimates representative of the same time period. To learn more about them, check out this factsheet.
Last Modified Date: July 22, 2026