
An official website of the United States government
An official website of the United States government
The .gov means it's official.
Federal government websites often end in .gov or .mil. Before sharing sensitive information,
make sure you're on a federal government site.
The site is secure.
The
https:// ensures that you are connecting to the official website and that any
information you provide is encrypted and transmitted securely.
Seasonal adjustment removes the effects of events that follow a more or less regular pattern each year. Over the course of a year, such events affect the rate of wage and benefit change. For example, wage and benefit adjustments in state and local governments, especially schools, are concentrated in the June-September period. Increases in the Social Security tax rate and earnings ceiling, when they occur, take effect in the December-March period. Wage and benefit adjustments in construction typically occur in the summer when there is the most activity in the industry. Adjusting for these seasonal patterns makes it easier to observe the cyclical and other nonseasonal movements in the series.
| Reference period | Seasonally adjusted | Not seasonally adjusted |
|---|---|---|
|
Dec-15 |
0.4 | 0.3 |
|
Mar-16 |
0.4 | 0.2 |
|
Jun-16 |
0.5 | 0.3 |
|
Sep-16 |
0.7 | 1.2 |
|
Dec-16 |
0.4 | 0.2 |
|
Mar-17 |
0.7 | 0.4 |
|
Jun-17 |
0.4 | 0.2 |
|
Sep-17 |
0.3 | 1.1 |
|
Dec-17 |
0.5 | 0.2 |
|
Mar-18 |
0.5 | 0.2 |
|
Jun-18 |
0.6 | 0.3 |
|
Sep-18 |
0.6 | 1.4 |
|
Dec-18 |
0.6 | 0.5 |
|
Mar-19 |
0.6 | 0.3 |
|
Jun-19 |
0.6 | 0.3 |
|
Sep-19 |
0.8 | 1.8 |
|
Dec-19 |
0.5 | 0.2 |
|
Mar-20 |
0.6 | 0.2 |
|
Jun-20 |
0.7 | 0.3 |
|
Sep-20 |
-0.1 | 0.9 |
|
Dec-20 |
0.5 | 0.3 |
|
Mar-21 |
0.5 | 0.1 |
|
Jun-21 |
0.6 | 0.1 |
|
Sep-21 |
0.4 | 1.5 |
|
Dec-21 |
0.6 | 0.3 |
|
Mar-22 |
0.8 | 0.4 |
|
Jun-22 |
0.8 | 0.3 |
|
Sep-22 |
1.5 | 2.8 |
|
Dec-22 |
1.2 | 0.8 |
|
Mar-23 |
0.8 | 0.4 |
|
Jun-23 |
1.0 | 0.3 |
|
Sep-23 |
1.3 | 2.8 |
|
Dec-23 |
1.1 | 0.7 |
|
Mar-24 |
1.1 | 0.7 |
|
Jun-24 |
1.1 | 0.4 |
|
Sep-24 |
1.0 | 2.5 |
|
Dec-24 |
1.0 | 0.5 |
|
Mar-25 |
0.7 | 0.4 |
|
Jun-25 |
0.9 | 0.2 |
|
Sep-25 |
0.8 | 2.4 |
|
Dec-25 |
0.9 | 0.5 |
|
Source: U.S. Bureau of Labor Statistics, Employment Cost Index (ECI). |
||
At the beginning of each calendar year seasonal adjustment factors are calculated for use during the coming year and revisions of historical seasonally adjusted data are made for the most recent 5 years.
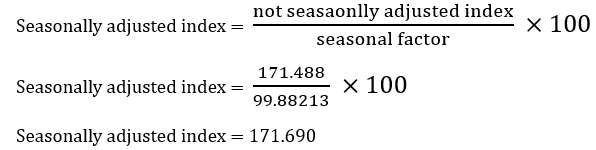
Employment Cost Index series are seasonally adjusted using either the direct or indirect seasonal adjustment method. Indexes at comparatively low levels of aggregation, such as the construction wage index, are adjusted by the direct method; that is, dividing the index by its seasonal factor. Seasonal factors are derived using the X-13 ARIMA seasonal adjustment program developed by the U.S. Census Bureau.
For example, in December 2025 the index for wages in the private construction industry was 171.488 with a seasonal factor of 99.88213.
Seasonal factors for directly adjusted series are available in XLSX format.
Most higher level aggregate indexes, such as civilian or private industry workers wages or benefits, are seasonally adjusted by the indirect method, a weighted sum of seasonally adjusted component indexes, where the weights sum to 1.0. Industry and occupational series that are seasonally adjusted by the indirect method are based on industry and occupational components, respectively.
Seasonally adjusted estimates, for both direct and indirect seasonally adjusted series, for the most recent 5 years are updated in the public database with each annual revision. The revised estimates are also available in XLSX format.
During this seasonal readjustment process all eligible series are reviewed for seasonality. In some instances, series no longer exhibit seasonality and are dropped from the seasonally adjusted News Release tables and are retained in the historical tables. In other instances, series are added when they begin exhibiting identifiable seasonality and are added to the seasonally adjusted data tables along with 5 years of historical data.
| Index Series ID |
3-month Percent Change Series ID |
Compensation component |
Ownership | Characteristic | Year | Change |
|---|---|---|---|---|---|---|
| CIS2024120000000I | CIS2024120000000Q | Wages and salaries | Private industry | Retail trade industry | 2011 | Seasonal |
| CIS2020000300000I | CIS2020000300000Q | Wages and salaries | Private industry | Service occupations | 2011 | Seasonal |
| CIS1026230000000I | CIS1026230000000Q | Wages and salaries | Civilian | Nursing and residential care facilities industry | 2012 | Seasonal |
| CIS2014110000000I | CIS2014110000000Q | Total compensation | Private industry | Wholesale trade industry | 2012 | Seasonal |
| CIS2025220000000I | CIS2025220000000Q | Wages and salaries | Private industry | Credit intermediation and related activities industry | 2013 | Non-seasonal |
| CIS2025220000000I | CIS2025220000000Q | Wages and salaries | Private industry | Credit intermediation and related activities industry | 2014 | Seasonal |
| CIS2026230000000I | CIS2026230000000Q | Wages and salaries | Private industry | Nursing and residential care facilities industry | 2015 | Seasonal |
| CIS2020000300000I | CIS2020000300000Q | Wages and salaries | Private industry | Service occupations | 2015 | Non-seasonal |
| CIS2014110000000I | CIS2014110000000Q | Total compensation | Private industry | Wholesale trade industry | 2016 | Non-seasonal |
| CIS2020000300000I | CIS2020000300000Q | Wages and salaries | Private industry | Service occupations | 2017 | Seasonal |
| CIS2014110000000I | CIS2014110000000Q | Total compensation | Private industry | Wholesale trade industry | 2018 | Seasonal |
| CIS2025600000000I | CIS2025600000000Q | Wages and salaries | Private industry | Administrative and support and waste management and remediation services industry | 2018 | Non-seasonal |
| CIS2020000110000I | CIS2020000110000Q | Wages and salaries | Private industry | Management, business, and financial occupations | 2019 | Non-seasonal |
| CIS2026220000000I | CIS2026220000000Q | Wages and salaries | Private industry | Hospitals industry | 2019 | Non-seasonal |
| CIS2026220000000I | CIS2026220000000Q | Wages and salaries | Private industry | Hospitals industry | 2020 | Seasonal |
| CIS2020000110000I | CIS2020000110000Q | Wages and salaries | Private industry | Management, business, and financial occupations | 2020 | Seasonal |
| CIS2025300000000I | CIS2025300000000Q | Wages and salaries | Private industry | Real estate and leasing industry | 2020 | Seasonal |
| CIS1026230000000I | CIS1026230000000Q | Wages and salaries | Civilian | Nursing and residential care facilities industry | 2020 | Non-seasonal |
| CIS2026230000000I | CIS2026230000000Q | Wages and salaries | Private industry | Nursing and residential care facilities industry | 2020 | Non-seasonal |
| CIS2027200000000I | CIS2027200000000Q | Wages and salaries | Private industry | Accommodation and food services industry | 2020 | Non-seasonal |
| CIS2024110000000I | CIS2024110000000Q | Wages and salaries | Private industry | Wholesale trade industry | 2021 | Seasonal |
| CIS2026230000000I | CIS2026230000000Q | Wages and salaries | Private industry | Nursing and residential care facilities industry | 2021 | Seasonal |
| CIS1026230000000I | CIS1026230000000Q | Wages and salaries | Civilian | Nursing and residential care facilities industry | 2021 | Seasonal |
| CIS2027200000000I | CIS2027200000000Q | Wages and salaries | Private industry | Accommodation and food services industry | 2021 | Seasonal |
| CIS2020000210000I | CIS2020000210000Q | Wages and salaries | Private industry | Sales and related occupations | 2021 | Non-seasonal |
| CIS2025600000000I | CIS2025600000000Q | Wages and salaries | Private industry | Administrative and support and waste management and remediation services | 2023 | Seasonal |
| CIS2026230000000I | CIS2026230000000Q | Wages and salaries | Private industry | Nursing and residential care facilities | 2024 | Non-seasonal |
| CIS1026230000000I | CIS1026230000000Q | Wages and salaries | Civilian | Nursing and residential care facilities | 2024 | Non-seasonal |
| CIS2020000210000I | CIS2020000210000Q | Wages and salaries | Private industry | Sales and related occupations | 2025 | Seasonal |
|
Source: U.S. Bureau of Labor Statistics, Employment Cost Index. |
||||||
For more information, see the seasonal adjustment explanation in the calculation section and seasonal adjustment articles in the more info section of the Handbook of Methods.
Last Modified Date: March 18, 2026