|
|
Occupational Employment Statistics Help File
Occupational Employment Statistics
Welcome to the step-by-step guide on how to use the Occupational Employment Statistics query system
Table Type
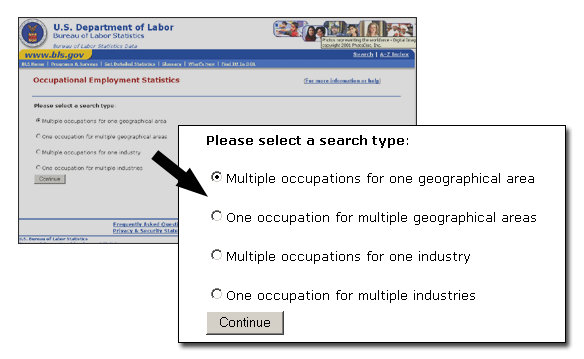
There are four table types:
-
Multiple occupations for one geographical area will provide cross industry estimates for all selected occupations. These estimates can be selected for one geographic area at the National, State, or Metropoliatn area level.
-
One occupation for multiple geographical areas will provide cross industry estimates for one occupation. These estimates can be viewed for all selected areas at the National, State, or Metropolitan area level.
-
Multiple occupations for one industry will provide National industry-specific estimates for all selected occupations. These estimates can be selected for one industry.
-
One occupation for multiple industries will provide National industry estimates for one occupation. These estimates can be viewed for all selected industries.
Area
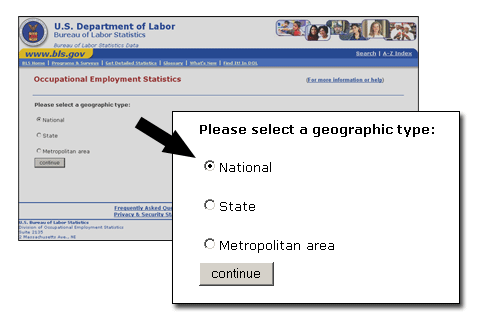
Cross industry estimates are available at the National, State, and Metropolitan area level. Industry-specific estimates are available only at the National level.
Occupation
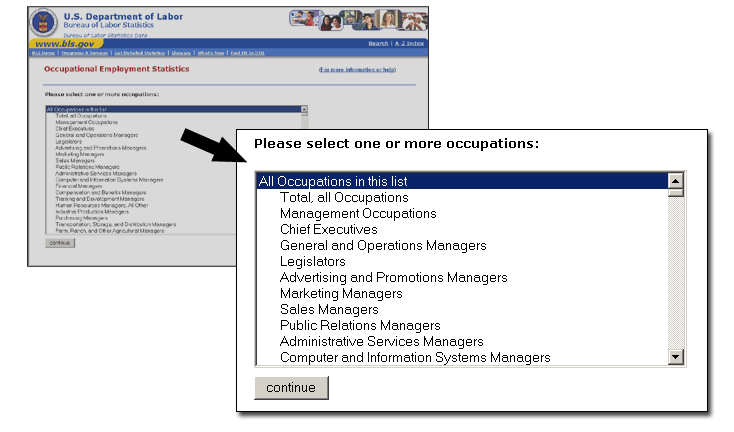
Estimates are available for over 800 Standard Occupational Classification (SOC) occupations.
Industry

Estimates are available for over 1000 North American Industry Classification System (NAICS) industries.
Year
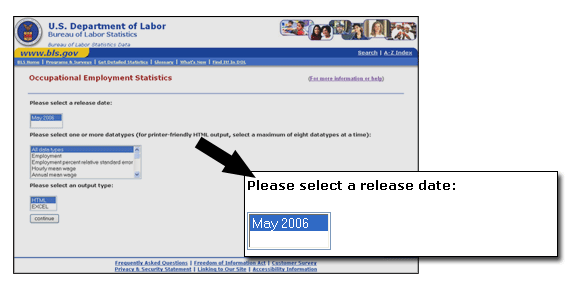
The most recently released data will be provided.
Datatype
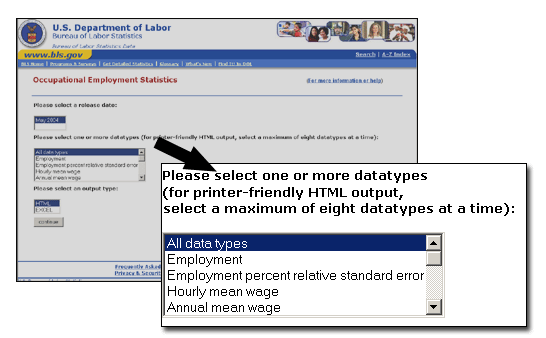
The National, State, and Metropolitan Area Occupational Employment and Wage Estimates consist of the following:
-
SOC Code Number: the Standard Occupational Classification (SOC) system's unique, six-digit (plus hyphen) numerical identifier for each occupation.
-
Occupation Title: a descriptive title that corresponds to the SOC code.
-
Employment: the estimated total occupational employment (not including self-employed).
-
Median Hourly Wage: the estimated 50th percentile of the distribution of wages based on data collected from employers in all industries; 50 percent of workers in an occupation earn less than the median wage, and 50 percent earn more than the median wage.
-
Mean Hourly Wage: the estimated total hourly wages of an occupation divided by its estimated employment, i.e., the average hourly wage.
-
Mean Annual Wage: the estimated total annual wages of an occupation divided by its estimated employment, i.e., the average annual wage.
-
Mean RSE : the Relative Standard Error of the mean wage estimates, a measure of the reliability or precision of the mean wage estimates. The relative standard error is defined as the ratio of the standard error to the survey estimate. For example, a relative standard error of 10 percent implies that the standard error is one-tenth as large as the survey estimate.
-
Employment RSE : the Relative Standard Error of the employment estimate, a measure of the reliability or precision of the employment estimate. The relative standard error is defined as the ratio of the standard error to the survey estimate. For example, a relative standard error of 10 percent implies that the standard error is one-tenth as large as the survey estimate.
-
Percentile Wage Estimates : (National estimates only) A percentile wage estimate shows what percentage of workers in an occupation earn less than a given wage and what percentage earn more. For example, a 25th percentile wage of $15.00 indicates that 25% of workers (in a given occupation in a given area) earn less than $15.00; therefore 75% of workers earn more than $15.00. More about percentile wages. : the estimated total annual wages of an occupation divided by its estimated employment, i.e., the average annual wage.
- Employment per 1000 jobs: the number of jobs (employment) in the given occupation per 1,000 jobs in the given area.
- Location Quotient: (State, metropolitan, and nonmetropolitan statistical area estimates only) the ratio of an occupation's share of employment in a given area to that occupation's share of employment in the U.S. as a whole. For example, an occupation that makes up 10 percent of employment in a specific metropolitan area compared with 2 percent of U.S. employment would have a location quotient of 5 for the area in question.
Output Type
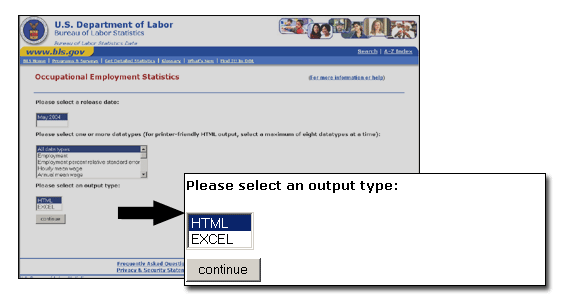
The Output types are:
- "Generate HTML table" which will create an HTML table on screen.
- "Generate Excel table" which will create an Excel file (.xls). You will be prompted to save or open the output.
Last modified: March 25, 2015
|
 United States Department of Labor