
An official website of the United States government
An official website of the United States government
The .gov means it's official.
Federal government websites often end in .gov or .mil. Before sharing sensitive information,
make sure you're on a federal government site.
The site is secure.
The
https:// ensures that you are connecting to the official website and that any
information you provide is encrypted and transmitted securely.
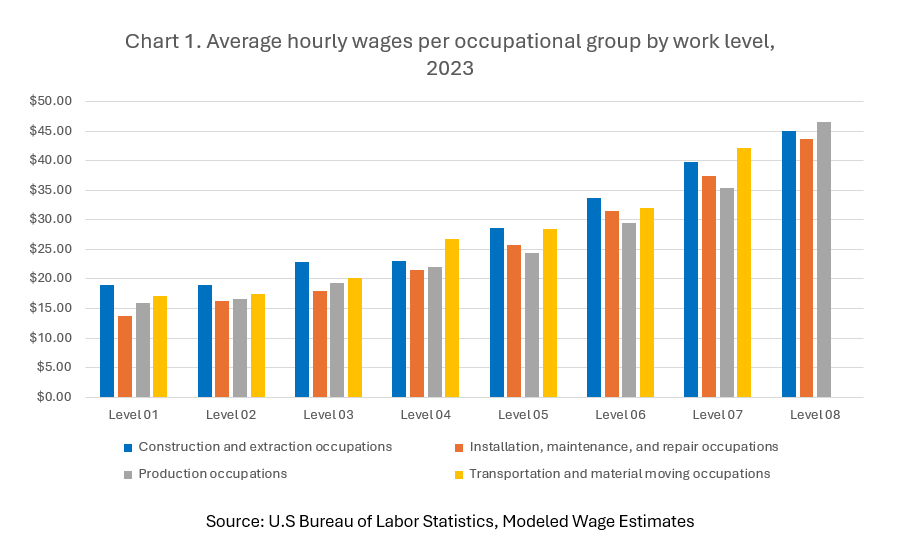
The Modeled Wage Estimates (MWE) allows for comparison of average hourly wages across occupations among geographic area and bargaining status (union and nonunion) by work level (entry, intermediate, experienced, 1-15 and unable to be leveled). The MWE uses the Standard Occupational Classification (SOC) system and includes average hourly wages for a variety of occupational groups and occupations. Chart 1 includes the national average hourly wages per level for the following major occupational groups:
construction and extraction
installation, maintenance, and repair
production
transportation and material moving
Within each of these major occupational groups are smaller groups and specific occupations. For example, construction and extraction occupations include supervisors of construction and extraction workers, construction trades workers, helpers in construction trades, other construction and related workers, and extraction workers. Within these subgroups are additional occupations. The MWE provides average hourly wages for both major occupational groups and the occupations within these groups.
| Occupation Text | Level 01 | Level 02 | Level 03 | Level 04 | Level 05 | Level 06 | Level 07 | Level 08 |
|---|---|---|---|---|---|---|---|---|
|
Construction and extraction occupations |
$18.93 | $18.97 | $22.84 | $22.98 | $28.66 | $33.70 | $39.76 | $45.02 |
|
Installation, maintenance, and repair occupations |
$13.72 | $16.28 | $18.05 | $21.58 | $25.70 | $31.42 | $37.49 | $43.64 |
|
Production occupations |
$15.90 | $16.65 | $19.27 | $22.10 | $24.31 | $29.50 | $35.40 | $46.58 |
|
Transportation and material moving occupations |
$17.04 | $17.39 | $20.18 | $26.72 | $28.48 | $32.03 | $42.08 | $- |
|
Source: U.S. Bureau of Labor Statistics, Modeled Wage Estimates |
||||||||
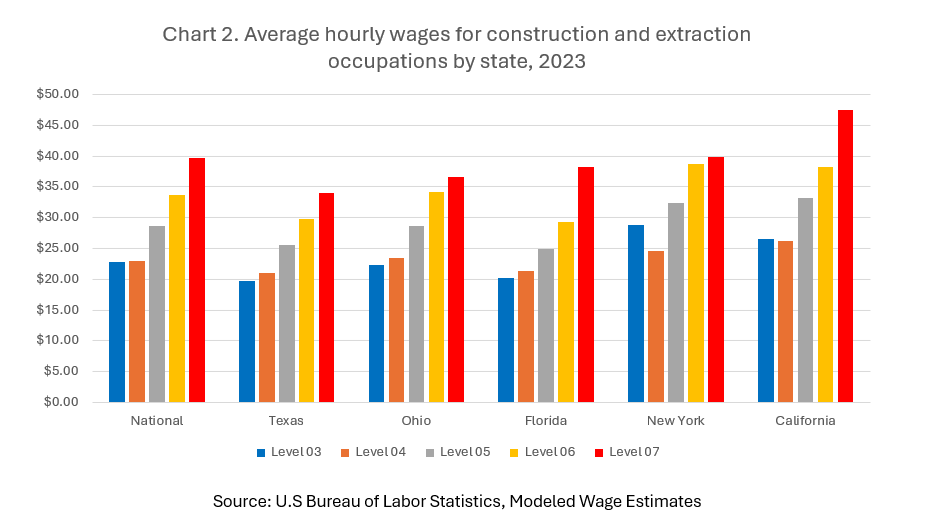
In 2023, the average hourly wage for construction and extraction occupations in the U.S. was $22.98 for level 4 and $39.76 for level 7. The average hourly wage in Florida was $21.35 for level 4 and $38.27 for level 7. In California, the average hourly wage was $26.30 for level 4 and $47.46 for level 7 (See Chart 2).
| Level | National | Texas | Ohio | Florida | New York | California |
|---|---|---|---|---|---|---|
|
Level 03 |
$22.84 | $19.66 | $22.38 | $20.28 | $28.89 | $26.59 |
|
Level 04 |
$22.98 | $21.03 | $23.50 | $21.35 | $24.57 | $26.30 |
|
Level 05 |
$28.66 | $25.60 | $28.59 | $24.96 | $32.42 | $33.13 |
|
Level 06 |
$33.70 | $29.72 | $34.11 | $29.38 | $38.70 | $38.26 |
|
Level 07 |
$39.76 | $33.97 | $36.63 | $38.27 | $39.85 | $47.46 |
|
Source: U.S. Bureau of Labor Statistics, Modeled Wage Estimates |
||||||
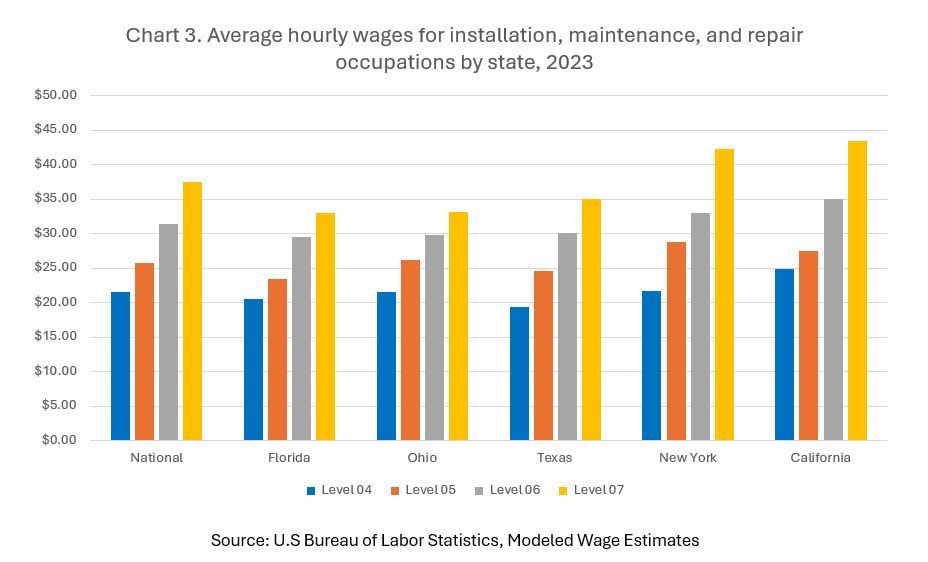
In 2023, the average hourly wage for installation, maintenance, and repair occupations in the U.S. was $21.58 for level 4 and $31.42 for level 6. The average hourly wage in Ohio was $21.59 for level 4 and $29.77 for level 6. In California, the average hourly wage was $24.79 for level 4 and $35.06 for level 6 (See Chart 3).
| Level | National | Florida | Ohio | Texas | New York | California |
|---|---|---|---|---|---|---|
|
Level 04 |
$21.58 | $20.58 | $21.59 | $19.40 | $21.65 | $24.79 |
|
Level 05 |
$25.70 | $23.34 | $26.10 | $24.57 | $28.75 | $27.45 |
|
Level 06 |
$31.42 | $29.57 | $29.77 | $30.12 | $32.96 | $35.06 |
|
Level 07 |
$37.49 | $33.04 | $33.12 | $35.00 | $42.23 | $43.43 |
|
Source: U.S. Bureau of Labor Statistics, Modeled Wage Estimates |
||||||
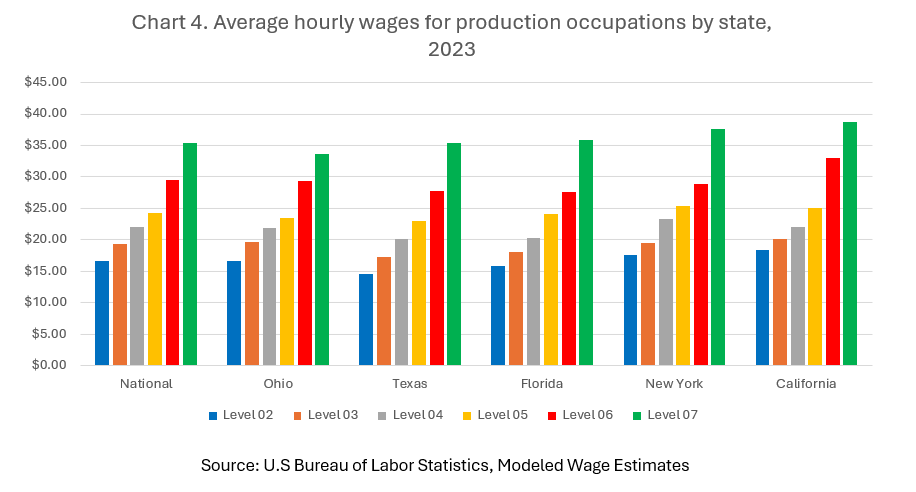
In 2023, the average hourly wage for production occupations in the U.S. was $16.65 for level 2 and $29.50 for level 6. The average hourly wage in Florida was $15.85 for level 2 and $27.54 for level 6. In California, the average hourly wage was $18.42 for level 2 and $32.95 for level 6 (See Chart 4).
| Level | National | Ohio | Texas | Florida | New York | California |
|---|---|---|---|---|---|---|
|
Level 02 |
$16.65 | $16.69 | $14.59 | $15.85 | $17.59 | $18.42 |
|
Level 03 |
$19.27 | $19.62 | $17.34 | $17.98 | $19.49 | $20.19 |
|
Level 04 |
$22.10 | $21.82 | $20.05 | $20.34 | $23.34 | $22.02 |
|
Level 05 |
$24.31 | $23.46 | $23.03 | $24.15 | $25.35 | $24.98 |
|
Level 06 |
$29.50 | $29.27 | $27.69 | $27.54 | $28.90 | $32.95 |
|
Level 07 |
$35.40 | $33.68 | $35.39 | $35.87 | $37.63 | $38.74 |
|
Source: U.S. Bureau of Labor Statistics, Modeled Wage Estimates |
||||||
In 2023, the average hourly wage for transportation and material occupations in the U.S. was $17.04 for level 1 and $28.48 for level 5. The average hourly wage in Texas was $15.04 for level 1 and $28.52 for level 5. In New York, the average hourly wage was $19.83 for level 1 and $34.77 for level 5 (See Chart 5).
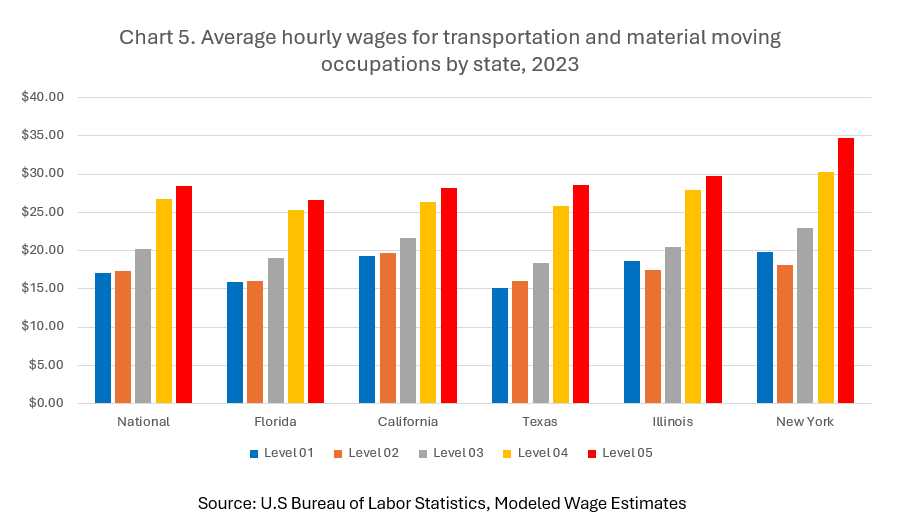
| Level | National | Florida | California | Texas | Illinois | New York |
|---|---|---|---|---|---|---|
|
Level 01 |
$17.04 | $15.88 | $19.34 | $15.04 | $18.67 | $19.83 |
|
Level 02 |
$17.39 | $16.03 | $19.69 | $16.01 | $17.40 | $18.07 |
|
Level 03 |
$20.18 | $19.04 | $21.64 | $18.34 | $20.42 | $22.93 |
|
Level 04 |
$26.72 | $25.29 | $26.33 | $25.81 | $27.90 | $30.21 |
|
Level 05 |
$28.48 | $26.63 | $28.20 | $28.52 | $29.74 | $34.77 |
|
Source: U.S. Bureau of Labor Statistics, Modeled Wage Estimates |
||||||
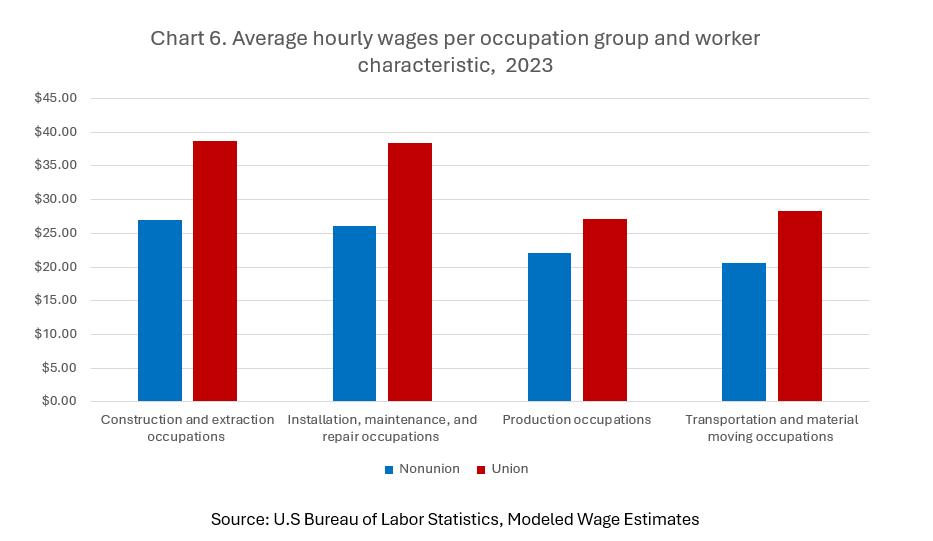
In 2023, the average hourly wage among construction and extraction occupations in the U.S. was $26.93 for nonunion and $38.69 for union workers. The average hourly wage for installation, maintenance, and repair occupations was $26.12 for nonunion and $38.44 for union workers. The average hourly wage for production occupations was $22.05 for nonunion and $27.07 for union workers. The average hourly wage for transportation and material moving occupations was $20.60 for nonunion and $28.38 for union workers (See Chart 6).
| Occupation Text | Nonunion | Union |
|---|---|---|
|
Construction and extraction occupations |
$26.93 | $38.69 |
|
Installation, maintenance, and repair occupations |
$26.12 | $38.44 |
|
Production occupations |
$22.05 | $27.07 |
|
Transportation and material moving occupations |
$20.60 | $28.38 |
|
Source: U.S. Bureau of Labor Statistics, Modeled Wage Estimates |
||
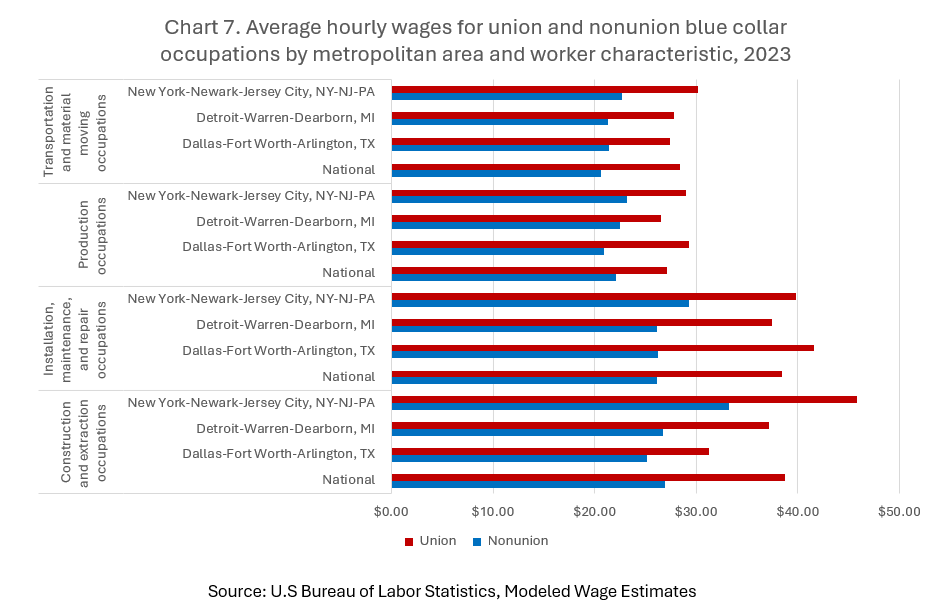
Among construction and extraction workers in 2023, the average hourly wage was $38.69 for union and $26.93 for nonunion workers in the U.S. The average hourly wage was $31.26 for union workers and $25.13 for nonunion workers in Dallas-Fort Worth-Arlington, TX. The average hourly wage was $45.76 for union and $33.19 for nonunion workers in New York-Newark-Jersey City, NY-NJ-PA.
Among installation, maintenance, and repair occupations in 2023, the average hourly wage was $38.44 for union and $26.12 for nonunion workers in the U.S. The average hourly wage was $37.40 for union and 26.09 for nonunion workers in Detroit-Warren-Dearborn, MI. The average hourly wage was $39.82 for union and $29.32 for nonunion workers in New York-Newark-Jersey City, NY-NJ-PA.
Among production occupations in 2023, the average hourly wage was $27.07 for union workers and $22.05 for nonunion workers in the U.S. The average hourly wage was $26.50 for union and $22.46 for nonunion workers in Detroit-Warren-Dearborn, MI. The average hourly wage was $28.97 for union and $23.14 for nonunion workers in New York-Newark-Jersey City, NY-NJ-PA.
Among transportation and material moving occupations in 2023, the average hourly wage $28.38 for union and $20.60 nonunion workers in the U.S. The average hourly was $27.37 for union and $21.36 for nonunion workers in Dallas-Fort Worth-Arlington, TX. The average hourly wage was $30.18 for union and $22.71 for nonunion workers in New York-Newark-Jersey City, NY-NJ-PA (See Chart 7).
| Occupation | Metropolitan area | Nonunion | Union |
|---|---|---|---|
|
Construction and extraction occupations |
National | $26.93 | $38.69 |
| Dallas-Fort Worth-Arlington, TX | $25.13 | $31.26 | |
| Detroit-Warren-Dearborn, MI | $26.76 | $37.13 | |
| New York-Newark-Jersey City, NY-NJ-PA | $33.19 | $45.76 | |
|
Installation, maintenance, and repair occupations |
National | $26.12 | $38.44 |
| Dallas-Fort Worth-Arlington, TX | $26.25 | $41.54 | |
| Detroit-Warren-Dearborn, MI | $26.09 | $37.40 | |
| New York-Newark-Jersey City, NY-NJ-PA | $29.32 | $39.82 | |
|
Production occupations |
National | $22.05 | $27.07 |
| Dallas-Fort Worth-Arlington, TX | $20.95 | $29.27 | |
| Detroit-Warren-Dearborn, MI | $22.46 | $26.50 | |
| New York-Newark-Jersey City, NY-NJ-PA | $23.14 | $28.97 | |
|
Transportation and material moving occupations |
National | $20.60 | $28.38 |
| Dallas-Fort Worth-Arlington, TX | $21.36 | $27.37 | |
| Detroit-Warren-Dearborn, MI | $21.30 | $27.85 | |
| New York-Newark-Jersey City, NY-NJ-PA | $22.71 | $30.18 | |
|
Source: U.S. Bureau of Labor Statistics, Modeled Wage Estimates |
|||
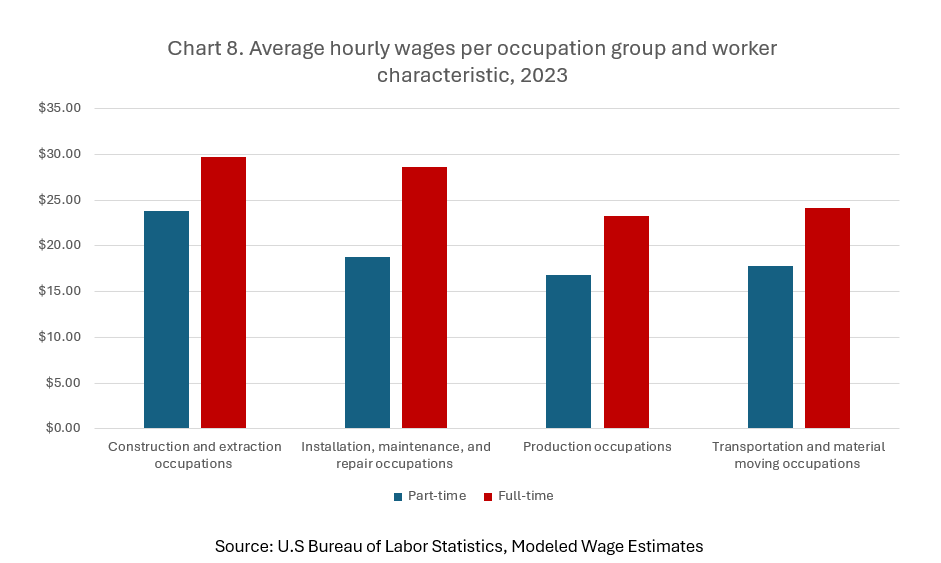
In 2023, the average hourly wage among construction and extraction occupations in the U.S. was $23.86 for part-time and $29.72 for full-time workers. The average hourly wage for installation, maintenance, and repair occupations was $18.79 for part-time and $28.62 for full-time workers. The average hourly wage for production occupations was $16.85 for part-time and $23.27 for full-time workers. The average hourly wage for transportation and material moving occupations was $17.78 for part-time and $24.10 for full-time workers (See Chart 8).
| Occupation | Part-time | Full-time |
|---|---|---|
|
Construction and extraction occupations |
$23.86 | $29.72 |
|
Installation, maintenance, and repair occupations |
$18.79 | $28.62 |
|
Production occupations |
$16.85 | $23.27 |
|
Transportation and material moving occupations |
$17.78 | $24.10 |
|
Source: U.S. Bureau of Labor Statistics, Modeled Wage Estimates |
||
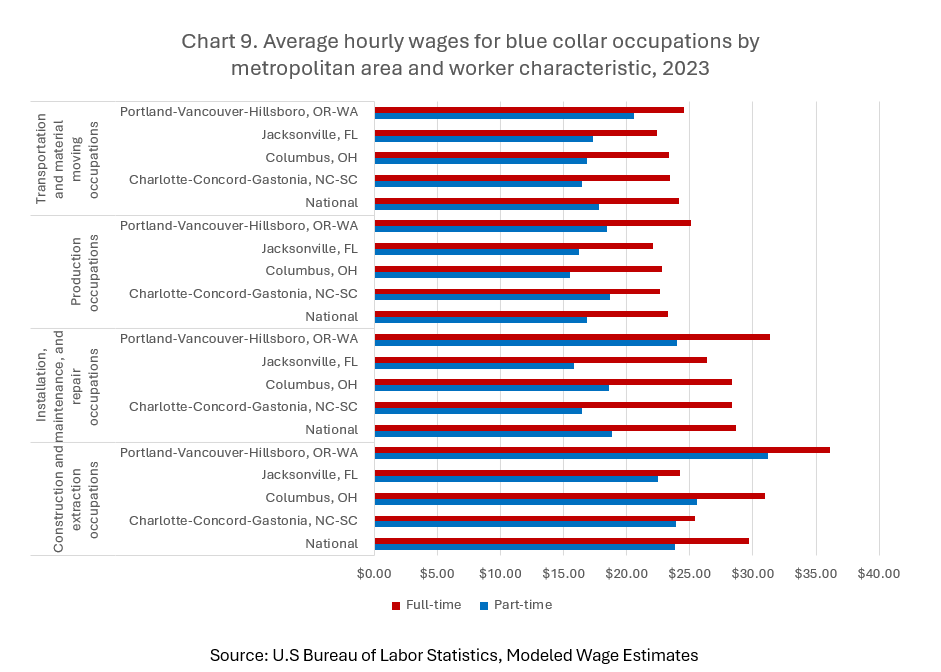
In 2023, the average hourly wage for construction and extraction occupations in the U.S. was $23.86 for part-time and $29.72 for full-time workers. The average hourly wage was $22.47 for part-time and $24.19 for full-time workers in Jacksonville, FL . The average hourly wage was $25.55 for part-time and $30.97 for full-time workers in Columbus, OH.
Among installation, maintenance, and repair occupations, the average hourly wage in the U.S. was $18.79 for part-time and $28.62 for full-time workers. The average hourly wage was $15.85 for part-time and $26.34 for full-time workers in Jacksonville, FL. The average hourly wage was $18.57 for part-time and $28.33 for full-time workers in Columbus, OH.
Among production occupations, the average hourly wage in the U.S. was $16.85 for part-time and $23.27 for full-time workers. The average hourly wage was $16.24 for part-time and $22.05 for full-time workers in Jacksonville, FL. The average hourly wage was $15.50 for part-time and $22.80 for full-time workers in Columbus, OH.
Among transportation and material moving occupations, the average hourly wage in the U.S. was $17.78 for part-time and $24.10 for full-time workers. The average hourly wage was $17.31 for part-time and $22.39 for full-time workers in Jacksonville, FL. The average hourly wage was $16.88 for part-time and $23.31 for full-time workers in Columbus, OH (See Chart 9).
| Occupation | Metropolitan area | Part-time | Full-time |
|---|---|---|---|
|
Construction and extraction occupations |
National | $23.86 | $29.72 |
| Charlotte-Concord-Gastonia, NC-SC | $23.91 | $25.41 | |
| Columbus, OH | $25.55 | $30.97 | |
| Jacksonville, FL | $22.47 | $24.19 | |
| Portland-Vancouver-Hillsboro, OR-WA | $31.22 | $36.11 | |
|
Installation, maintenance, and repair occupations |
National | $18.79 | $28.62 |
| Charlotte-Concord-Gastonia, NC-SC | $16.46 | $28.32 | |
| Columbus, OH | $18.57 | $28.33 | |
| Jacksonville, FL | $15.85 | $26.34 | |
| Portland-Vancouver-Hillsboro, OR-WA | $24.00 | $31.34 | |
|
Production occupations |
National | $16.85 | $23.27 |
| Charlotte-Concord-Gastonia, NC-SC | $18.66 | $22.62 | |
| Columbus, OH | $15.50 | $22.80 | |
| Jacksonville, FL | $16.24 | $22.05 | |
| Portland-Vancouver-Hillsboro, OR-WA | $18.43 | $25.10 | |
|
Transportation and material moving occupations |
National | $17.78 | $24.10 |
| Charlotte-Concord-Gastonia, NC-SC | $16.49 | $23.44 | |
| Columbus, OH | $16.88 | $23.31 | |
| Jacksonville, FL | $17.31 | $22.39 | |
| Portland-Vancouver-Hillsboro, OR-WA | $20.58 | $24.53 | |
|
Source: U.S. Bureau of Labor Statistics, Modeled Wage Estimates |
|||
Comparisons of hourly wage estimates by location, work levels, hours, and other factors
Revisiting the dilemma of review for modeled wage estimates by job characteristic
Wage estimates by job characteristic: NCS and OES program data
Last Modified Date: August 22, 2024