An official website of the United States government
 United States Department of Labor
The International Price Program (IPP) uses a matched model approach for its Import and Export Price Indexes, tracking prices for the same products over time to capture pure price changes and to avoid potential bias. Pricing consistent products is critical so that the indexes measure market‐related price movements, not those resulting from changes to the product characteristics or features. The Hedonic quality adjustment, or value quality adjustment method, captures quality changes in rapidly evolving products that affect prices.
Rapid product innovation of cutting‐edge technologies creates unique challenges for accurate pricing of high‐tech goods. Desktops, laptops, and servers require frequent adjustments to product features and prices to account for changes in quality. Hedonic models are currently used to adjust quality change in prices of these high‐tech goods.
IPP import and some export monthly computer prices are directly collected from respondents. Price changes resulting from product modifications are quality‐adjusted using estimates typically provided by the respondent. If the respondent is unable to provide the estimated price for the quality change, the price of the replacement product is adjusted by applying the quality adjusted price from the hedonic model.
IPP export computer prices that are collected using publicly available data are priced with specific item configurations. The prices for the computer items are adjusted using hedonic models when the quality of the products change. IPP has been using hedonic modeling for quality price adjustments in computers and computer parts since the 1990s.

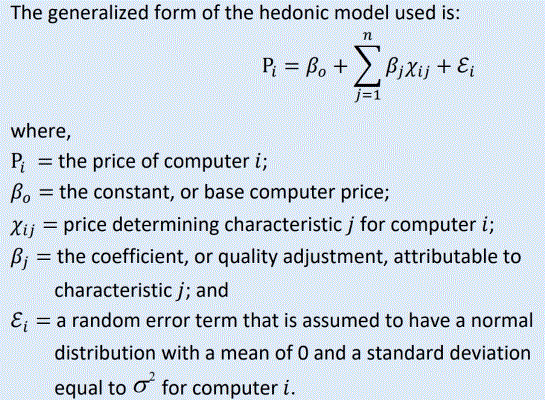
Hedonic methodology controls the effects of changes in product quality by disaggregating the product by its price determining characteristics. The Bureau of Labor Statistics’ hedonic models are ordinary least squares (OLS) regressions that use known data prices and features to estimate the change in price for each feature change. The regression maps a straight line whose intercept on the Y axis, β0, is the initial price, and whose coefficients for each j feature, βj, are the estimated price change for that feature.
For computers, the coefficients (or betas, βj) are estimated based on a hedonic regression model that is updated yearly from publicly available data, using thousands of observations for desktop and laptop computers with numerous features. This type of public pricing information is used to build the hedonic models that adjust for quality change. The coefficients provide a data‐driven estimate of how much the price changes when a specific feature changes on a product.
For example, in the table below, a computer company provides the same prices on an exported computer in the previous month (t − 1) and in the current month (t). The computer features/specifications are the same in both months, except that the memory has been upgraded from 6 gigabytes (GB) in the previous month to 8GB in the current month. The company reported the computer sold for the same amount of $1,199 in both months but cannot provide additional information to account for the 2GB memory upgrade.
For example, in the table below, a computer company provides the same prices on an exported computer in the previous month (t − 1) and in the current month (t). The computer features/specifications are the same in both months, except that the memory has been upgraded from 6 gigabytes (GB) in the previous month to 8GB in the current month. The company reported the computer sold for the same amount of $1,199 in both months but cannot provide additional information to account for the 2GB memory upgrade.
| Example: Quality Adjustment calculation for an exported personal desktop computer |
|
Reported price for 6GB, previous period (t − 1) = $1199 Reported price for 8GB desktop, current period (t) = $1199 Calculated coefficient = $14.74 per GB memory Value Quality Adjustment (VQA) for 2GB Memory = $14.74(2GB) = $29.48 Quality adjusted (QA) price = $1199.00 - $29.48 = $1169.52 QA price change = (P(t) − VQA) ÷ P(t − 1) − 1 = $1169.52 ÷ $1199 − 1 = 0.97541 − 1 = −0.02458 or −2.458% |
Additional information on the U.S. Import and Export Price Indexes can be found in the BLS Handbook of Methods. This section of the handbook also can be accessed on the BLS Internet site (https://www.bls.gov/mxp) under the topic "MXP Methods." You may contact the International Price Program of the BLS by telephone at (202) 691-7101 or by email.
Information in this report is in the public domain and may be reproduced without permission. This information is available to sensory impaired individuals upon request. Voice phone: (202) 691-5200; TDD Phone: (202) 691-5200; TDD message referral phone: 1-800-877-8339.
Last Modified Date: March 28, 2022