An official website of the United States government
 United States Department of Labor
Almost all Producer Price Indexes (PPIs) measure changes in prices received by establishments for the sale of goods produced or services provided. PPIs for the trade sector, which includes wholesale and retail trade services, are the exception to this method. Trade sector output, by the PPI program’s definition, is not directly measurable, so margin prices are calculated as a substitute. Referred to as margin indexes, these PPIs track changes in prices received, less the acquisition price of goods sold by wholesalers and retailers. This article explains the rationale behind measuring trade sector output using margins, addresses challenges presented by this technique, and clarifies how margin PPIs should be interpreted.
Since little, if any, alteration takes place once goods are obtained by a wholesaler or retailer, the PPI program does not measure goods as the trade sector’s output. Rather, the outputs of these establishments are considered distributive trade services—services that help facilitate the sale of goods by presenting them in a more appealing way or by making them accessible to the buyer at the next level.
The output of wholesale establishments is defined as the efficient transfer of goods from manufacturers or other wholesalers to other businesses, typically for resale. Services performed by wholesalers may include selling and promoting, buying and assortment building, bulk breaking, warehousing, transporting, and providing market information.
Establishments in the retail sector primarily purchase goods for resale to the general public for personal or household consumption, although some also serve business and institutional clients. Services performed by retailers may include marketing, storing, and displaying goods in convenient locations for customers to purchase. (See exhibit 1.)
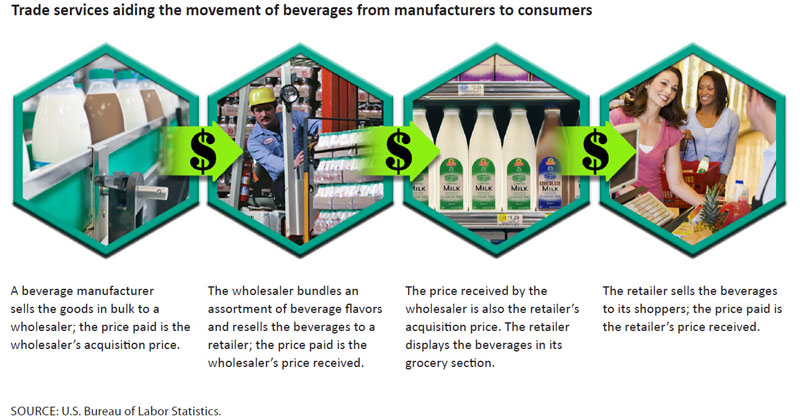
As illustrated by the services listed, rather than altering products, trade establishments add value to finished products through services that help sell more than the manufacturer could alone. Margin PPIs seek to measure this added value by tracking the retailer's or wholesaler’s selling price received for a good, less the current price of acquiring that same good. The difference between these two prices reflects what the PPI program refers to as the margin price. Mathematically,
Current Selling Price – Current Acquisition Price = Margin Price.
The prices most commonly reported by an establishment are average margin prices per unit for specific product lines. The PPI program weights these prices by the sampled establishment’s margin revenue to form one representative average margin index for the industry.
The main issue concerning margin PPIs is that they are prone to volatility, often moving more than 5 percent on a monthly basis. (See chart 1.)
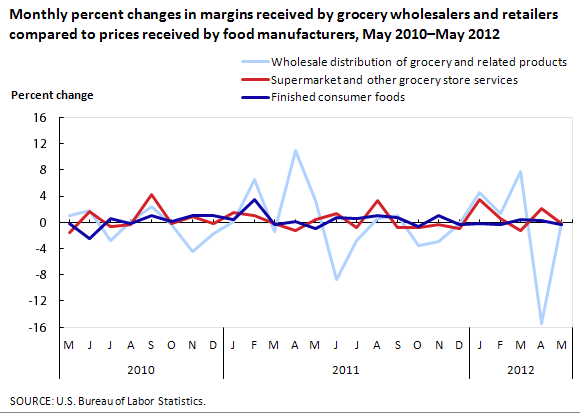
| Month | Wholesale distribution of grocery and related products | Supermarket and other grocery store services | Finished consumer foods |
|---|---|---|---|
May 2010 | 1.1 | -1.5 | -0.1 |
Jun 2010 | 1.8 | 1.7 | -2.5 |
Jul 2010 | -2.8 | -0.7 | 0.6 |
Aug 2010 | 0.2 | -0.4 | -0.2 |
Sep 2010 | 2.4 | 4.2 | 1 |
Oct 2010 | -0.4 | -0.1 | 0.1 |
Nov 2010 | -4.4 | 0.9 | 1 |
Dec 2010 | -1.7 | -0.1 | 1.1 |
Jan 2011 | 0.1 | 1.5 | 0.5 |
Feb 2011 | 6.6 | 1 | 3.5 |
Mar 2011 | -1.4 | -0.2 | -0.3 |
Apr 2011 | 11 | -1.3 | 0.1 |
May 2011 | 3.3 | 0.5 | -1 |
Jun 2011 | -8.7 | 1.3 | 0.7 |
Jul 2011 | -2.8 | -0.8 | 0.6 |
Aug 2011 | 0.6 | 3.4 | 1.1 |
Sep 2011 | 1 | -0.8 | 0.7 |
Oct 2011 | -3.6 | -0.8 | -0.6 |
Nov 2011 | -2.9 | -0.3 | 1 |
Dec 2011 | -0.1 | -1 | -0.4 |
Jan 2012 | 4.5 | 3.5 | -0.1 |
Feb 2012 | 1.3 | 0.6 | -0.3 |
Mar 2012 | 7.8 | -1.2 | 0.4 |
Apr 2012 | -15.4 | 2.1 | 0.3 |
May 2012 | 6.2 | -0.2 | -0.3 |
There are two main reasons behind this tendency toward volatility:
Unlike most PPIs, which are calculated on the basis of the latest selling price of products or services, margin PPIs are calculated from both the updated selling price and the updated acquisition price of products. Especially when these two prices move in opposite directions, the margin can change significantly in a single month.
Even a small change in price may be significant in percentage terms. Think of the shoppers in exhibit 1; suppose that the average price paid for a bottled beverage at the grocery retailer is $1.00. Even if the price the retailer pays in acquiring the product from the wholesaler stays the same, say, $0.90 per bottle, consider the change in margin if the retailer raises its selling price by just $0.05. (See exhibit 2.)
Margin price volatility with small price changes
Average selling price in month a = $1.00.
Average acquisition price in month a = $0.90.
Margin received in month a = $1.00 – $0.90 = $0.10.
Now consider an increase of $0.05 in the selling price in month b:
Average selling price in month b = $1.05.
Average acquisition price in month b = $0.90.
Margin received in month b = $1.05 – $0.90 = $0.15.
Percent change in margin received from month a to b = [($0.15 – $0.10)/ $0.10] ∗ 100 = 50.0%.
To extend the example in exhibit 2 further, what if the wholesaler also had discounted its selling price to the retailer in month b by just $0.02 per bottle? The change would have been recorded as a 70.0-percent increase in the margin price. Although this example may seem extreme, it is not unusual price behavior for individual products at your local retailer.
A common misconception regarding wholesale and retail trade indexes is that they track prices for goods sold by wholesalers and retailers, rather than margins. This misconception leads to a common misuse of margin indexes for price adjustment clauses in contracts for goods. When a PPI is not available for a certain grouping of goods, but there is an index for the trade establishments selling them, a data user might be inclined to use the trade index as a proxy for those products. For example, because only a limited number of PPIs are available for consumer electronics (since few such products are manufactured in the United States), but there is a margin PPI for retail electronics stores, it may be tempting to substitute the trade index for the manufacturing index. However, doing so would be a major misuse of data, because margin PPIs measure the value of the retail electronics stores’ services, not the value of the goods themselves.
The appropriate use of PPI data for the wholesale and retail trade sector is the analysis of price movements within and across industries. For example, a wholesale or retail trade establishment could use margin indexes to assess how it is managing margins compared with the average change in margins in its industry, in other trade industries, or in the trade sector as a whole. Changes in margins also may be used to investigate the effects of promotions and seasonality (such as holidays, when retailers typically advertise more discounts). Are retailers sacrificing their margins to sell more at certain times of the year? Do holidays that revolve more around food affect margins differently than holidays that revolve around purchasing gifts? These are the types of questions that may be investigated with margin PPIs.
Margin PPIs are published in the monthly PPI Detailed Report, table 5 (industry codes 42-45, excluding 429930) and table 6 (commodity codes 57 and 58), as well as in the online PPI Databases. More information on margin indexes can be found in several articles listed on the PPI Methodology webpage. For assistance, contact the PPI Section of Index Analysis and Public Information at ppi-info@bls.gov or (202) 691-7705.
The PPI for finished goods fell 1.2 percent in the second quarter of 2012, compared with a 0.6-percent advance in the first quarter.1 Most of this reversal can be traced to prices for finished energy goods, which decreased 6.5 percent for the 3 months ended in June, following a 0.5-percent rise in the preceding quarter. The index for finished goods less foods and energy moved up 0.6 percent after increasing 0.8 percent from December to March. In contrast, prices for finished consumer foods inched up 0.2 percent in the second quarter, following a 0.3-percent decline in the first quarter. At the earlier stages of processing, prices received by manufacturers of intermediate goods fell 1.8 percent for the 3 months ended in June, after climbing 1.5 percent in the previous quarter. This shift is attributable, in roughly equal proportions, to downturns in the indexes for intermediate goods less foods and energy and intermediate energy goods. In contrast, prices for intermediate foods and feeds rose more than they did in the previous quarter. From March to June, the crude goods index dropped 10.8 percent, following a 0.9-percent decrease in the first quarter of 2012. Prices for crude foodstuffs and feedstuffs and core crude goods fell in the second quarter after increasing in the first quarter, while the index for crude energy materials moved down at a faster rate than it had from December to March.2
In the energy goods sector, the index for wellhead natural gas was 44.7 percent lower in June 2012 than a year earlier. In fact, prices for wellhead natural gas are at their lowest point in nearly a decade. According to the U.S. Energy Information Administration (EIA), increased natural gas production has resulted in storage well above its 5-year historical average. For the week ended June 29, working gas in underground storage was about 3,100 billion cubic feet, 22.7 percent above its 5-year average and 24.1 percent higher than a year earlier.3 Furthermore, lower wellhead prices for natural gas have contributed to a significant shift in electric power generation. In April, for the first time, the quantity of electric power generated from natural gas equaled that generated from coal-fired electric power.4 In terms of the influence on utility power prices, the index for utility natural gas decreased 12.9 percent and prices for utility electric power inched down in June, compared with a year earlier. In the petroleum products market, prices for both crude petroleum and refined petroleum products turned down after previous gains. For the week ended July 6, 2012, crude oil stocks and crude inputs to refineries were slightly higher than a year earlier, while overall demand for finished motor gasoline was 3.9 percent lower than in mid-2011.5
In the sector for goods other than food and energy, the PPI for crude core moved lower after an earlier runup in prices. Weak markets for basic industrial materials, such as iron and steel scrap, nonferrous scrap, nonferrous metal ores, and wastepaper, led the downturn. Similarly, within intermediate core, prices for partially processed materials used for durable and nondurable goods manufacturing also reversed course by mid-2012, after surging in the first quarter. Prices for more highly processed intermediate goods, such as components for manufacturing and construction, as well as supplies for business, continued to rise, although at slower rates. However, within finished core, prices for consumer goods other than foods and energy and for capital equipment continued to advance steadily.6 On July 15, the Federal Reserve Board of Governors reported that industrial production and capacity utilization remained mixed. Industrial production moved up 0.4 percent in June, after edging down 0.2 percent in May. For the 12 months ended June 2012, industrial production advanced 4.7 percent, but only 1.6 percent in the first half of 2012. Capacity utilization expanded 1.3 percent since June 2011, to 78.9 percent of total capacity, and only 0.8 percent since December 2011.7 In its June survey, the Institute for Supply Management (ISM) reported that its measure of manufacturing activity contracted in June, the first decline since July 2009. ISM also reported declines in new orders, inventories, prices, and exports.8
In the food sector, the inflation picture remained mixed. The index for crude foodstuffs and feedstuffs declined in the second quarter after climbing in the first 3 months of the year. This reversal was broad based and included downturns in prices for slaughter cattle, slaughter poultry, and grains, as well as larger declines in raw milk prices. In contrast, the index for intermediate foods and feeds increased at a faster rate in the second quarter, while prices for finished consumer foods inched up after edging down in the first quarter. Prices for prepared animal feeds rose at an accelerated pace, while the indexes for beef products, eggs, and cheese products moved up following declines in the first quarter.
The PPI for finished goods moved down 1.2 percent for the 3 months ended June 2012, subsequent to a 0.6-percent advance in the first quarter of 2012. Accounting for more than 90 percent of this downturn, prices for finished energy goods dropped from March to June after rising in the previous 3-month period. The index for finished goods less foods and energy increased less in the 3 months ended in June compared with the previous quarter. By contrast, finished consumer foods prices turned up in the second quarter of 2012, following a decrease from December 2011 to March 2012. (See chart 2.)
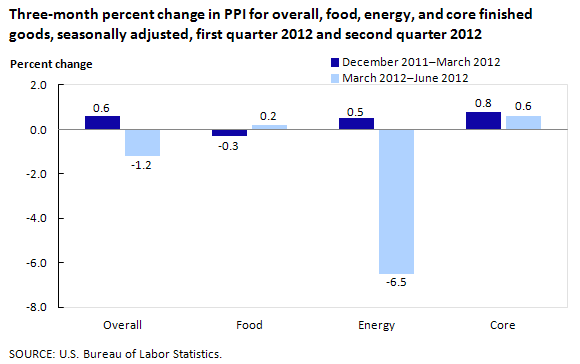
| Category | December 2011–March 2012 | March 2012–June 2012 |
|---|---|---|
Overall | 0.6 | -1.2 |
Food | -0.3 | 0.2 |
Energy | 0.5 | -6.5 |
Core | 0.8 | 0.6 |
The index for finished energy goods dropped 6.5 percent for the 3-month period ended in June, compared with a 0.5-percent rise from December to March. Prices for gasoline fell 8.7 percent from March to June, after rising 4.2 percent for the 3 months ended in March. The indexes for diesel fuel and home heating oil also turned down after increasing in the first quarter. Prices for liquefied petroleum gas and residential electric power decreased more in the second quarter than from December to March. By contrast, price decreases for residential natural gas slowed to 2.2 percent from March to June, from 5.7 percent for the 3 months ended in March.
Prices for finished goods other than foods and energy increased 0.6 percent in the second quarter of 2012, after moving up 0.8 percent in the previous 3-month period. Accounting for more than 40 percent of this deceleration, the pharmaceutical preparations index rose 1.0 percent, compared with a 2.6-percent increase in the previous quarter. Prices for rubber and rubber products turned down for the 3-month period ended in June, subsequent to advancing from December to March. The index for radio and television communication equipment was unchanged in the second quarter, after increasing in the previous 3-month period. By contrast, the index for nonwood commercial furniture and store fixtures advanced 4.1 percent from March to June, following a 1.3-percent decline a quarter earlier. Prices for cosmetics and other toilet preparations also turned up after falling in the 3 months ended in March.
For the 3 months ended in June, the index for finished consumer foods moved up 0.2 percent, following a 0.3-percent decrease from December to March. Leading this upturn, prices for beef and veal rose 5.6 percent, subsequent to a 2.6-percent drop in the first quarter. The indexes for eggs for fresh use; fresh vegetables, except potatoes; and natural, processed, and imitation cheese also turned up from March to June, after declining for the 3 months ended in March. By contrast, prices for pork fell 9.8 percent in the second quarter, compared with a 0.5-percent decrease from December to March. The index for processed young chickens increased less for the 3-month period ended in June than in the first quarter.
The PPI for intermediate materials, supplies, and components moved down 1.8 percent for the 3-month period ending in June, subsequent to a 1.5-percent advance in the 3 months ended in March. The downturn in the second quarter of 2012 can be traced to the indexes for intermediate goods less foods and energy and intermediate energy goods, both of which fell in the second quarter after rising from December to March. By contrast, prices for intermediate foods and feeds advanced more in the second than in the first quarter. (See chart 3.)
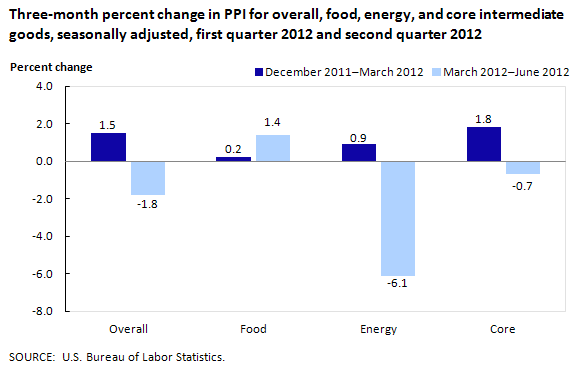
| Category | December 2011–March 2012 | March 2012–June 2012 |
|---|---|---|
Overall | 1.5 | -1.8 |
Food | 0.2 | 1.4 |
Energy | 0.9 | -6.1 |
Core | 1.8 | -0.7 |
Prices for intermediate goods less foods and energy declined 0.7 percent in the second quarter, compared with a 1.8-percent rise from December to March. The index for industrial chemicals led this downturn, falling 5.1 percent from March to June, subsequent to an 8.2-percent jump in the first quarter. Prices for nonferrous metals, thermoplastic resins and materials, steel mill products, and rubber and rubber products also decreased in the 3 months ended in June, after rising in the previous quarter. The index for prepared paint rose less from March to June than in the first quarter. By contrast, the index for agricultural chemicals and chemical products moved up 1.8 percent in the second quarter, following a 3.1-percent decline in the first quarter.
The index for intermediate energy goods fell 6.1 percent for the 3 months ended in June, following a 0.9-percent rise in the previous quarter. Diesel fuel prices dropped 13.9 percent from March to June, after rising 2.8 percent in the preceding quarter. The indexes for gasoline, jet fuel, lubricating oil base stocks, and residual fuel also turned down after advancing from December to March. Prices for liquefied petroleum gas fell more in the second quarter than in the previous 3 months. By contrast, the index for commercial electric power moved up 0.2 percent for the 3 months ended in June, following a 1.9-percent decline in the first quarter.
The index for intermediate foods and feeds climbed 1.4 percent for the 3 months ended in June, after moving up 0.2 percent in the first quarter. Nearly 80 percent of the second-quarter acceleration can be attributed to prices for processed animal feeds, which advanced 6.2 percent compared with a 2.1-percent rise in the first quarter. The indexes for natural, processed, and imitation cheese and for beef and veal increased following decreases from December to March. Conversely, prices for confectionary materials declined 9.0 percent for the 3 months ended in June, following a 10.3-percent jump in the first quarter. Prices for young chickens rose less in the second quarter, while the index for pork fell more than it had in the 3 months ended in March.
After moving down 0.9 percent in the first quarter of 2012, the PPI for crude materials for further processing decreased 10.8 percent in the second quarter. Leading this faster rate of decline, prices for crude foodstuffs and feedstuffs and for crude nonfood materials less energy turned down in the second quarter, after rising in the 3 months ended in March. The index for crude energy materials fell more than it did in the first quarter. (See chart 4.)
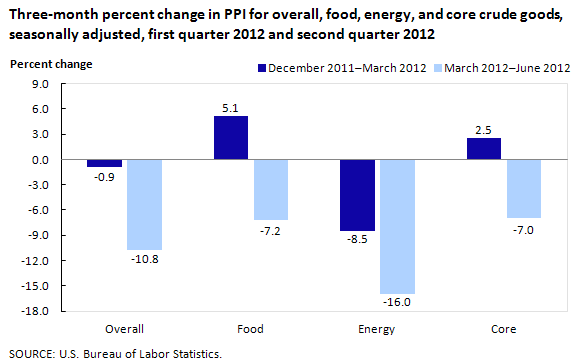
| Category | December 2011–March 2012 | March 2012–June 2012 |
|---|---|---|
Overall | -0.9 | -10.8 |
Food | 5.1 | -7.2 |
Energy | -8.5 | -16.0 |
Core | 2.5 | -7.0 |
The index for crude foodstuffs and feedstuffs declined 7.2 percent for the 3 months ended in June, following a 5.1-percent advance in the previous quarter. About one-fourth of the reversal can be traced to prices for slaughter cattle, which dropped 4.7 percent in the second quarter after climbing 8.1 percent in the previous 3 months. The indexes for corn, slaughter poultry, and oilseeds also decreased following increases in the first quarter. Raw milk prices fell more in the second quarter than they did in the first. By contrast, the index for slaughter hogs moved up 2.4 percent for the 3 months ended in June, compared with a 6.8-percent decline in the preceding quarter.
The index for crude energy materials fell 16.0 percent in the second quarter, after moving down 8.5 percent in the previous 3-month period. This faster rate of decline is attributable to prices for crude petroleum, which dropped 24.9 percent, following a 2.3-percent decrease in the first quarter. Conversely, price declines for wellhead natural gas slowed to 2.9 percent in the second quarter, from 27.5 percent for the 3 months ended in March. The coal index increased 2.6 percent after decreasing 5.9 percent in the previous quarter.
The index for crude nonfood materials less energy fell 7.0 percent in the second quarter, following a 2.5-percent rise in the preceding quarter. Nearly half of the downturn can be linked to prices for iron and steel scrap, which dropped 15.2 percent after moving up 0.6 percent in the first quarter. The indexes for nonferrous metal ores, nonferrous scrap, grains, and raw cotton also turned down for the 3 months ended in June. Conversely, prices for corrugated wastepaper inched up 0.3 percent, compared with a 10.9-percent decrease in the first quarter.
The Producer Price Index for the net output of total trade industries moved up 0.8 percent in the second quarter of 2012, after rising 1.5 percent in the previous 3-month period. (Trade industry PPIs measure changes in margins received by wholesalers and retailers.) From March to June, higher prices received by warehouse clubs and supercenters, gasoline stations, new car dealers, and supermarkets outweighed lower prices received by wholesale trade industries and family clothing stores.
The Producer Price Index for the net output of transportation and warehousing industries increased 0.4 percent from March to June, compared with a 2.5-percent gain in the 3-month period ended in March. In the second quarter, prices received by the scheduled passenger air transportation industry moved up 0.3 percent, following a 5.5-percent climb from December to March. The industry index for couriers also rose less compared with the first-quarter increase. Prices received by the long-distance general freight trucking industry group and the industry for local trucking of specialized freight turned down after rising from December to March. The index for the U.S. Postal Service was unchanged from March to June, subsequent to an increase in the first quarter. By contrast, prices received by the scheduled air freight transportation industry rose 6.5 percent in the 3-month period ended in June, following a 5.4-percent decline from December to March.
The Producer Price Index for the net output of total traditional service industries edged up 0.2 percent from March to June, after rising 0.6 percent from December to March. Prices received by the direct health and medical insurance carriers industry moved up 0.4 percent, following a 1.3-percent gain in the previous 3-month period. The index for noncasino hotels and motels also rose less from March to June compared with the previous quarter’s increase. Prices received by the security, commodity contracts, and like activity industry group and the passenger car rental industry turned down in the second quarter. By contrast, the index for the commercial banking industry advanced 2.1 percent from March to June, following a 3.3-percent decline from December to March. Prices received by lessors of nonresidential buildings also turned up in the second quarter, after falling from December to March.
This Beyond the Numbers report was prepared by staff in the Division of Industrial Prices and Price Indexes, Office of Prices and Living Conditions, U.S. Bureau of Labor Statistics. Email: ppi-info@bls.gov; telephone: (202) 691-7705.
Information in this summary will be made available to sensory-impaired individuals upon request. Voice phone: (202) 691-5200. Federal Relay Service: 1 (800) 877-8339. This summary is in the public domain and may be reproduced without permission.
Producer Price Index program staff, “Wholesale and retail Producer Price Indexes: margin prices ,” Beyond the Numbers: Prices & Spending, vol. 1 / no. 8 (U.S. Bureau of Labor Statistics, August 2012), https://www.bls.gov/opub/btn/volume-1/wholesale-and-retail-producer-price-indexes-margin-prices.htm
1 Price movements for PPIs described in this summary include preliminary data for the months of March 2012 through June 2012. All PPI data are recalculated 4 months after their original publication, to reflect late data received from survey respondents. In addition, seasonally adjusted PPIs are recalculated on an annual basis for 5 years, to reflect more recent seasonal patterns.
2 Within the PPI stage-of-processing structure, the indexes for goods other than foods and energy commonly are referred to as the core indexes.
3Weekly Natural Gas Storage Report (U.S. Department of Energy, U.S. Energy Information Administration, July 6, 2012), http://ir.eia.gov/ngs/ngs.html. Working gas is the volume of gas in the reservoir above the level of base gas. Working gas is available to the marketplace. Base gas (or cushion gas) is the volume of gas intended as permanent inventory in a storage reservoir to maintain adequate pressure and deliverability rates throughout the withdrawal season.
4Today in Energy: Monthly coal- and natural gas-fired generation equal for first time in April 2012 (U.S. Department of Energy, U.S. Energy Information Administration, July 6, 2012), http://www.eia.gov/todayinenergy/archive.cfm?my=Jul2012. For the period from January 2007 to December 2010, electric power generation from coal averaged about 46.5 percent of total generation; natural gas averaged 22.8 percent and nuclear sources 19.7 percent. The remainder of electric power generation came from renewable, petroleum, and other sources.
5Weekly Petroleum Status Report, DOE/EIA-0208(2012-79), (U.S. Department of Energy, U.S. Energy Information Administration, July 11, 2012), http://www.eia.gov/pub/oil_gas/petroleum/data_publications/weekly_petroleum_status_report/historical/2012/2012_07_11/pdf/wpsrall.pdf. See also This Week in Petroleum (U.S. Department of Energy, U.S. Energy Information Administration, July 11, 2012), https://www.eia.gov/petroleum/weekly/archive/120711/twipprint.html. For the 4-week period ended July 6, 2012, demand for finished motor gasoline averaged 8.864 million barrels per day, compared with 9.226 million barrels per day a year earlier.
6 More highly processed intermediate and finished goods commonly price movements that are somewhat different from price movements for less processed goods, because basic material costs tend to be smaller portions of total costs for producers of more highly processed goods than for manufacturers of less processed goods. Contracts and escalation agreements also can delay or mitigate the pass-through effect of early-stage price volatility at successive stages of processing.
7Industrial Production and Capacity Utilization, G.17 (419) (Board of Governors of the Federal Reserve System, July 17, 2012), http://www.federalreserve.gov/releases/G17/.
8June 2012 Manufacturing ISM Report on Business (Tempe, AZ, Institute for Supply Management, July 2, 2012), http://www.ism.ws/ismreport/mfgrob.cfm. For archived copies, contact ISM Report on Business, public relations office, (800) 888-6276.
Publish Date: Monday, August 13, 2012