An official website of the United States government
 United States Department of Labor
The Bakken Formation is an oil-producing shale formation underneath North Dakota, Montana, and parts of Canada. In recent years, horizontal drilling and hydraulic fracturing techniques, combined with higher prices for crude oil, have led to rapid increases in oil extraction from shale formations like the Bakken Formation. As of late 2011, North Dakota was the fourth largest oil-producing state, after Texas, Alaska, and California.1 The large increase in oil production has led to growth in employment and wages and has changed the industry profile of employment in the region.
This Beyond the Numbers examines employment and wages by industry sector 2 according to the North American Industrial Classification System (NAICS) in the counties in North Dakota and Montana with wells producing oil from the Bakken Formation.3 Data from 2007 provide a snapshot of the economy in the region before the Bakken formation began its rapid expansion of oil production,4 and data from 2011 provide the most recent annual data available from the region. To obtain industry totals for the region, employment and wages by private industry sector for each county in the region were added together, based on annual data from the Quarterly Census of Employment and Wages (QCEW). In addition, total employment and wages for federal, state, and local government in each county were included in the analysis. Some industry totals were suppressed for confidentiality reasons, but 88.1 percent of the 2007 employment and 88.4 percent of the 2011 employment were available for analysis at the ownership and industry levels included in the study.
The Quarterly Census of Employment and Wages program publishes a quarterly count of employment and wages reported by employers covering 98 percent of U.S. jobs, available at the county, metropolitan statistical area (MSA), state, and national levels by detailed industry. Data are released within 7 months of the end of each quarter.
From 2007 to 2011, employment in these counties grew from 77,937 jobs to 105,891 jobs, an increase of 35.9 percent. Total wages paid in these counties more than doubled over the same period: in 2007, workers in these counties earned about $2.6 billion, and in 2011 they earned $5.4 billion. Their average annual pay increased from $33,040 to $50,553 for an increase of 53.1 percent. Over the same period, national employment decreased by 4.4 percent, while average annual pay increased by 8.1 percent from $44,458 in 2007 to $48,043 in 2011.
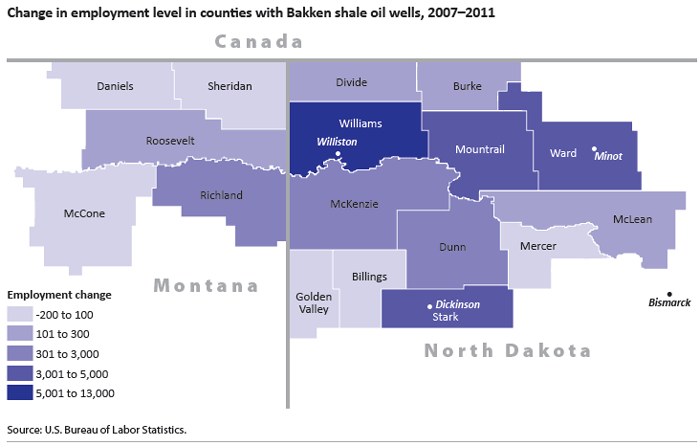
Among the counties included in the study, the county with the largest employment growth was Williams County, ND, where employment increased by 12,561 workers from 2007 to 2011. This increase more than doubled employment in the county. Almost half of this increase was in mining, quarrying, and oil and gas extraction. Other counties with employment increases of greater than 1,000 workers were McKenzie, Mountrail, Stark, and Ward, all in North Dakota. Ward County, with more than 31,000 jobs in 2011, had the highest overall number of jobs of any county in the area studied, but only one oil-producing well as of March 2011. Nonetheless, employment increased by 3,208 jobs from 2007 to 2011, with most of the increase spread across mining, quarrying, and oil and gas extraction; construction; transportation and warehousing; and leisure and hospitality. McKenzie, Mountrail, and Stark counties all had the highest level of job growth in mining, quarrying, and oil and gas extraction. Among the counties studied in Montana, Richland had the largest employment growth, with an increase of 882 jobs from 2007 to 2011. (See map.)

| County | Net change in employment | Percent change in employment |
|---|---|---|
Montana | ||
Daniels County | -18 | -3.0 |
McCone County | 24 | 4.4 |
Richland County | 882 | 18.1 |
Roosevelt County | 258 | 7.6 |
Sheridan County | 78 | 6.3 |
North Dakota | ||
Billings County | 91 | 22.5 |
Burke County | 219 | 37.2 |
Divide County | 189 | 30.9 |
Dunn County | 964 | 113.1 |
Golden Valley County | 18 | 2.8 |
McKenzie County | 2,155 | 76.0 |
McLean County | 285 | 9.3 |
Mercer County | -116 | -2.5 |
Mountrail County | 3,039 | 137.1 |
Stark County | 4,117 | 33.7 |
Ward County | 3208 | 11.5 |
Williams County | 12,561 | 112.1 |
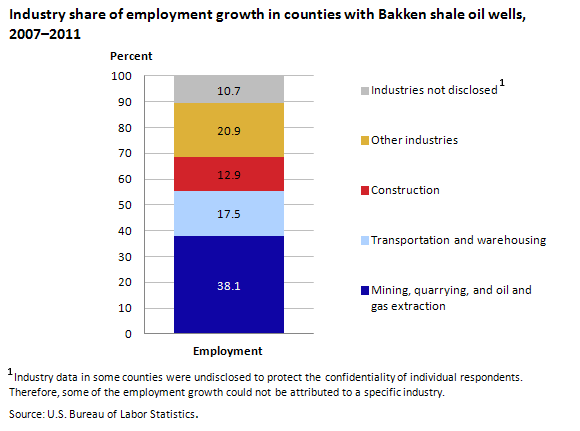
In the counties with wells in the Bakken Formation, employment grew by 27,954 jobs from 2007 to 2011. Of these jobs, 38.1 percent were in mining, quarrying, and oil and gas extraction. Transportation and warehousing accounted for 17.5 percent of the growth, and construction accounted for another 12.9 percent. Altogether, these three industry sectors accounted for 68.5 percent of the employment growth in counties with oil-producing wells in the Bakken Formation. (See chart 1.)

| Industry | Share of employment (percent) |
|---|---|
Industries not disclosed(1) | 10.7 |
Other industries | 20.9 |
Construction | 12.9 |
Transportation and warehousing | 17.5 |
Mining, quarrying, and oil and gas extraction | 38.1 |
Footnotes: | |
Despite the strong employment growth in the region, a few industry sectors experienced employment declines. Most notably, health care and social assistance employment declined by 1,353 workers from 2007 to 2011. Administrative and waste services had the next largest decline, with 727 fewer workers in 2011 than in 2007. These two decreases had an offsetting effect on the region’s employment growth equal to about 7.4 percent of the size of the region’s net job increase.
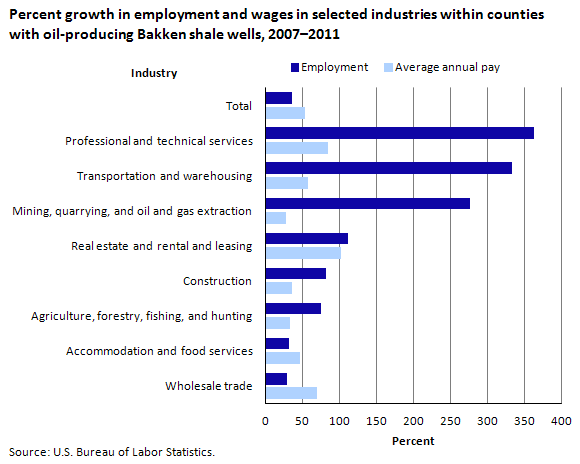
The industry within these counties with the largest percent increase in employment was professional and technical services, where employment increased more than threefold from 521 workers in 2007 to 2,407 in 2011. Transportation and warehousing also more than tripled, with employment increasing from 1,465 in 2007 to 6,347 in 2011. Mining, quarrying, and oil and gas extraction experienced the third-largest percent increase (276 percent), with employment increasing from 3,857 in 2007 to 14,499 in 2011.
The industry within these counties with the largest percent increase in average annual pay was real estate and rental and leasing, where average annual pay doubled, increasing from $35,940 in 2007 to $72,355 in 2011. Professional and technical Services experienced the second largest percent increase (85 percent), with average annual pay increasing from $34,950 in 2007 to $64,529 in 2011. Wholesale trade experienced the third-largest percent increase (70 percent), with average annual pay increasing from $42,144 in 2007 to $71,548 in 2011. (See chart 2.)

| Industry | Percent growth in employment | Percent growth in average annual pay |
|---|---|---|
Total | 36 | 53 |
Professional and technical services | 362 | 85 |
Transportation and warehousing | 333 | 57 |
Mining, quarrying, and oil and gas extraction | 276 | 28 |
Real estate and rental and leasing | 111 | 101 |
Construction | 81 | 36 |
Agriculture, forestry, fishing, and hunting | 75 | 33 |
Accommodation and food services | 32 | 47 |
Wholesale trade | 28 | 70 |
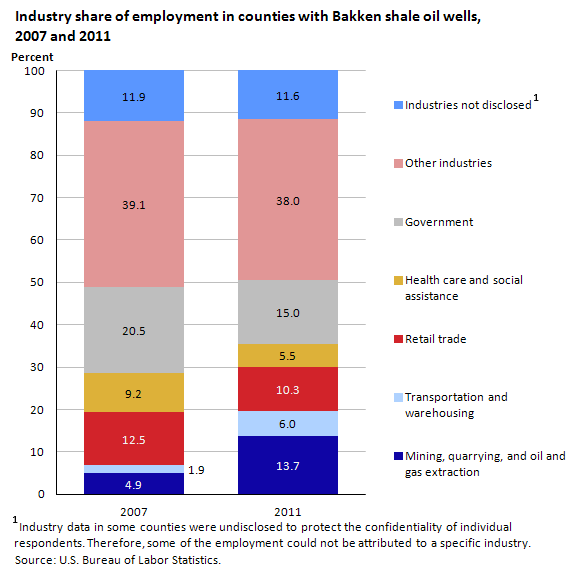
The counties in this study had an economy in 2007 that was already far more concentrated in mining, quarrying, and oil and gas extraction than the country as a whole. In the Bakken region, mining made up 4.9 percent of jobs, while mining comprised 0.5 percent of jobs nationwide. Utilities made up 1.9 percent of these counties’ jobs, about four times as high a percentage as they do nationally. Other industries were concentrated about the same as at the national level. Retail trade made up the largest portion of the nation’s employment at 11.5 percent, as well as in the Bakken region at 12.5 percent. Construction, wholesale trade, and leisure and hospitality were each concentrated similarly in both the Bakken region and the nation as a whole. Industries with a notably lower concentration than the national average in the Bakken region were manufacturing, as well as administrative and waste services. Together, these two sectors accounted for 16.4 percent of national employment but only 6.9 percent of employment in the Bakken counties.
Between 2007 and 2011, the industry profile of employment in these counties became even more concentrated in mining, quarrying, and oil and gas extraction, which accounted for 13.7 percent of all jobs in 2011. By that time, this industry sector’s share of employment was 24 times as large as the industry share nationwide. The increase in this industry’s share of jobs in these counties is the result of its large employment growth over those same years. Transportation and warehousing also experienced large job growth, increasing threefold to 6.0 percent of jobs in 2011. In 2007, this sector’s share of employment was just over half as concentrated as it was at the national level, while in 2011, it was nearly twice as concentrated in the Bakken region as it was nationally. Because of the large employment growth in industries like the above, other industries having only modest employment growth became smaller shares of the economy. For example, retail trade experienced employment growth of 1,116 workers from 2007 to 2011, but decreased as a share of jobs in these counties from 12.5 percent in 2007 to 10.3 percent in 2011. The number of government jobs stayed about the same, but decreased from 20.5 percent of jobs in 2007 to 15.0 percent of jobs in 2011. Health care and social assistance employment decreased by 1,353 jobs (–19 percent), which reduced its share of jobs in these counties from 9.2 percent in 2007 to 5.5 percent in 2011. (See chart 3.) Nationally, health care made up 12.7 percent of jobs in 2011.

| Industry | Share of employment (percent) | |
|---|---|---|
| 2007 | 2011 | |
Industries not disclosed(1) | 11.9 | 11.6 |
Other industries | 39.1 | 38.0 |
Government | 20.5 | 15.0 |
Health care and social assistance | 9.2 | 5.5 |
Retail trade | 12.5 | 10.3 |
Transportation and warehousing | 1.9 | 6.0 |
Mining, quarrying, and oil and gas extraction | 4.9 | 13.7 |
Footnotes: | ||
The rapid increase in oil production in the Bakken shale region has been accompanied by strong employment increases in mining, quarrying, and oil and gas extraction; transportation and warehousing; and construction. Several industries have seen large increases in average annual pay, notably real estate and rental and leasing, as well as professional and technical services. The result of this growth is a regional economy with a higher percentage of its jobs in mining, quarrying, and oil and gas extraction, as well as transportation and warehousing, and a lower percentage of jobs in industries that did not grow as rapidly, such as government, health care and social assistance, and retail trade.
This BEYOND THE NUMBERS article was prepared by Paul Ferree and Peter W. Smith of the Quarterly Census of Employment and Wages Program. Inquiries: https://data.bls.gov/cgi-bin/forms/cew?/cew/cewcont.htm Telephone (202) 691-6567.
Information in this article will be made available to sensory-impaired individuals upon request. Voice phone: (202) 691-5200. Federal Relay Service: 1-800-877-8339. This article is in the public domain and may be reproduced without permission.
Paul Ferree and Peter W. Smith, “Employment and wage changes in oil-producing counties in the Bakken Formation, 2007-2011 ,” Beyond the Numbers: Employment & Unemployment, vol. 2 / no. 11 (U.S. Bureau of Labor Statistics, April 2013), https://www.bls.gov/opub/btn/volume-2/employment-wages-bakken-shale-region.htm
4 To see a visualization of growth in oil production from Bakken shale in North Dakota, see this article, www.eia.gov/todayinenergy/detail.cfm?id=7550.
Publish Date: Friday, April 26, 2013