
An official website of the United States government
An official website of the United States government
The .gov means it's official.
Federal government websites often end in .gov or .mil. Before sharing sensitive information,
make sure you're on a federal government site.
The site is secure.
The
https:// ensures that you are connecting to the official website and that any
information you provide is encrypted and transmitted securely.

U.S. competitiveness is measured in many different ways. However, two sets of measures that historically have been of interest in helping to assess the strength of the economy are the price trends of U.S. exports and of U.S. imports. The Bureau of Labor Statistics (BLS, the Bureau) first began publication of a limited set of export price indexes in 1971, followed 2 years later by a set of import price indexes. The Bureau developed these series in response to two key concerns, one statistical and the other economic. The statistical issue was over the validity of the import and export unit value indexes published by the Census Bureau.1 The economic question had to do with the nation’s ability to compete in the increasingly global economy. The publication of detailed export and import price indexes helped address these concerns because those indexes were true price indexes and because they provided a greater level of detail than the analogous indexes previously published by the Census Bureau. The number of published series increased until the Bureau was able to publish the first all-import price index in 1983, followed a year later by the first all-export price index.2 Although the publication of these series alleviated the need to rely upon the unit value data—indeed, the Census Bureau discontinued publication of its unit value indexes in 1989—concerns over U.S. competitiveness have only grown over time.
In 1970, just before the BLS import and export price indexes were established, total U.S. trade was equivalent to 11 percent of gross domestic product (GDP). By 2012, the proportion had increased to 30 percent. Perhaps more significant was the increase in imported manufactured goods, compared with domestic manufactures. In 1970, the value of all U.S. imported manufactures was the equivalent of 12 percent of the value of domestic production. By 2012, the value of manufactured imports was nearly identical to the value added by the domestic U.S. manufacturing industry. Over the 1970–2012 period, employment in the U.S. manufacturing sector fell by one-third.3
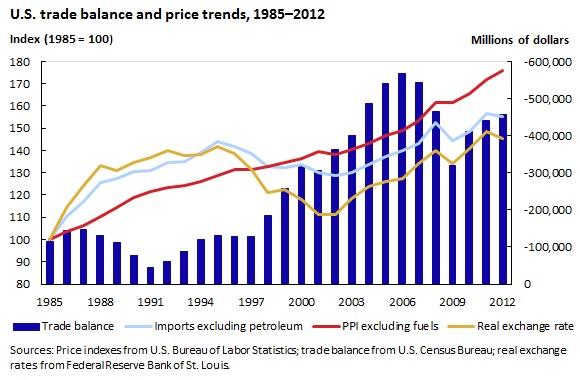
So, what light can the U.S. import and export price indexes shine on these trends? The BLS index for imports excluding petroleum shows a rising trend from its inception in 1985 to the present day, as it tracks increases in trade from abroad. (See chart 1.) However, when one compares the import index with the Producer Price Index (PPI) excluding fuels, one sees a more interesting picture. Paralleling the weakening of the dollar, import prices rose during the decade between 1985 and 1995, reflecting relatively higher price trends than those of the comparable domestic price series. Beginning in 1995, as the dollar appreciated against foreign currencies, import prices began to trend lower than the domestic series prices. As import prices trended lower, the shift to imported manufactures accelerated, with total manufactured imports rising 45 percent between 1996 and 2002. Note that the increase in U.S. manufactured imports relative to domestic production predates the appreciation of the dollar.
| Year | Trade balance | Index (1985=100) | ||
|---|---|---|---|---|
| Imports excluding petroleum index | Real exchange rate index | PPI excluding fuels | ||
1985 | -115,754 | 100.0 | 100.0 | 100.0 |
1986 | -144,986 | 110.3 | 114.3 | 103.6 |
1987 | -146,904 | 117.2 | 124.4 | 106.1 |
1988 | -131,711 | 125.7 | 133.3 | 110.1 |
1989 | -112,538 | 127.3 | 130.8 | 114.5 |
1990 | -77,971 | 130.5 | 134.5 | 119.1 |
1991 | -44,632 | 131.0 | 136.9 | 121.4 |
1992 | -61,562 | 134.6 | 139.8 | 123.5 |
1993 | -87,050 | 134.9 | 137.7 | 124.2 |
1994 | -119,560 | 139.2 | 138.0 | 126.2 |
1995 | -130,083 | 144.1 | 141.9 | 128.9 |
1996 | -128,785 | 141.8 | 138.7 | 131.6 |
1997 | -129,380 | 138.6 | 131.6 | 131.5 |
1998 | -184,448 | 132.9 | 121.3 | 132.7 |
1999 | -257,274 | 132.2 | 122.3 | 134.7 |
2000 | -316,065 | 133.7 | 117.8 | 136.4 |
2001 | -304,999 | 130.1 | 111.4 | 139.3 |
2002 | -361,534 | 128.9 | 111.3 | 138.0 |
2003 | -401,365 | 130.1 | 118.4 | 140.4 |
2004 | -486,849 | 133.8 | 123.9 | 143.3 |
2005 | -541,373 | 137.4 | 126.1 | 146.9 |
2006 | -567,294 | 140.1 | 127.5 | 149.1 |
2007 | -542,086 | 143.2 | 133.9 | 153.5 |
2008 | -465,229 | 152.4 | 139.8 | 161.3 |
2009 | -318,466 | 144.3 | 134.3 | 161.7 |
2010 | -411,720 | 148.4 | 140.9 | 165.4 |
2011 | -441,769 | 156.4 | 148.6 | 172.0 |
2012 | -457,075 | 155.1 | 145.5 | 175.8 |
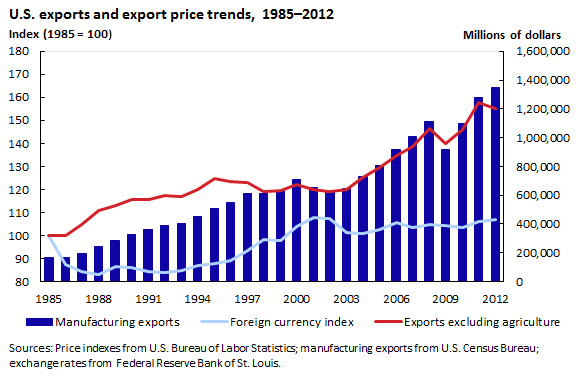
On the export side, however, the role of prices and exchange rates may prove more instructive. Chart 2 shows the trend for U.S. exports of manufactured goods since 1985. Included are two price indexes. The trend for the value of manufacturing exports appears to rise most rapidly as export prices go up. This rapid rise can be somewhat misleading, however, because the export price index is denoted in dollar terms. When the index is recalculated and looked at from the point of view of currency of the average foreign buyer (the so-called foreign currency index), the graph tells a different story. As a result of a weakening dollar, between 1985 and 1996 the average price of U.S. exports, in foreign currency terms, tended to moderate and the value of exports more than doubled. However, between 1996 and 2002 the value of manufacturing exports rose only 13 percent, coinciding with a significant increase in the average foreign currency price of U.S. exports due to the strengthening of the dollar.
| Year | Index (1985=100) | ||
|---|---|---|---|
| Manufacturing exports | Foreign currency index | Exports excluding agriculture index | |
1985 | 164,139 | 100.0 | 100.0 |
1986 | 168,924 | 87.3 | 99.8 |
1987 | 194,031 | 84.3 | 104.9 |
1988 | 245,980 | 83.1 | 110.8 |
1989 | 285,790 | 86.3 | 112.9 |
1990 | 329,499 | 86.0 | 115.7 |
1991 | 362,159 | 84.4 | 115.6 |
1992 | 386,464 | 83.8 | 117.2 |
1993 | 405,165 | 84.9 | 116.9 |
1994 | 448,663 | 86.9 | 119.8 |
1995 | 508,102 | 87.9 | 124.7 |
1996 | 546,982 | 89.0 | 123.4 |
1997 | 614,272 | 93.5 | 123.1 |
1998 | 613,289 | 98.3 | 119.2 |
1999 | 629,172 | 97.8 | 119.6 |
2000 | 708,014 | 103.8 | 122.3 |
2001 | 655,834 | 107.7 | 120.0 |
2002 | 622,628 | 107.2 | 119.2 |
2003 | 646,994 | 101.3 | 120.0 |
2004 | 726,982 | 100.9 | 125.1 |
2005 | 805,301 | 102.8 | 129.6 |
2006 | 914,426 | 105.5 | 134.5 |
2007 | 1,008,773 | 103.4 | 138.4 |
2008 | 1,112,277 | 104.8 | 146.5 |
2009 | 917,945 | 104.3 | 140.0 |
2010 | 1,101,356 | 103.6 | 146.0 |
2011 | 1,275,796 | 106.0 | 157.5 |
2012 | 1,348,185 | 106.7 | 155.2 |
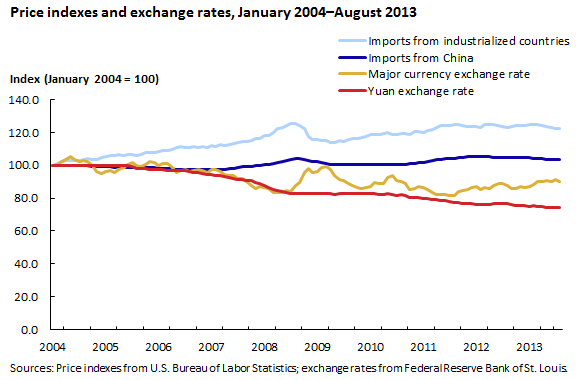
A decade ago, the dollar began to depreciate. Between 2002 and 2008, the dollar depreciated nearly 30 percent compared with the price of a market basket of major currencies,4 and U.S. manufacturing exports increased considerably, jumping nearly 80 percent during the same timeframe. On the import side, however, the impact of exchange rates, trade prices, and trade flows was not as clear. Even as the dollar began to weaken and import prices started to climb around 2002, in parallel with domestic prices, the value of manufactured imports continued to grow. Perhaps the key here is to differentiate trade and exchange rate patterns by locality. As can be seen in chart 3, import prices of manufactured goods from industrialized nations to the United States rose as the dollar declined from 2004 to 2008 (and earlier years, not shown). In contrast, during this same time, the dollar moved very little against the Chinese yuan, and correspondingly, prices for imports from China barely moved.
| Month | Imports from China | Imports from industrialized countries | Yuan exchange rate | Major currency exchange rate |
|---|---|---|---|---|
Jan 2004 | 100.0 | 100.0 | 100.0 | 100.0 |
Feb 2004 | 99.6 | 101.3 | 100.0 | 100.7 |
Mar 2004 | 99.6 | 102.0 | 100.0 | 102.5 |
Apr 2004 | 99.6 | 102.7 | 100.0 | 103.6 |
May 2004 | 99.8 | 102.8 | 100.0 | 105.5 |
Jun 2004 | 99.8 | 102.7 | 100.0 | 103.8 |
Jul 2004 | 99.9 | 102.9 | 100.0 | 102.4 |
Aug 2004 | 99.8 | 103.5 | 100.0 | 102.7 |
Sep 2004 | 99.7 | 103.9 | 100.0 | 102.1 |
Oct 2004 | 99.5 | 103.8 | 100.0 | 99.8 |
Nov 2004 | 99.3 | 103.8 | 100.0 | 96.0 |
Dec 2004 | 99.1 | 104.5 | 100.0 | 94.9 |
Jan 2005 | 99.0 | 105.5 | 100.0 | 96.0 |
Feb 2005 | 99.1 | 105.8 | 100.0 | 97.0 |
Mar 2005 | 98.9 | 106.2 | 100.0 | 95.8 |
Apr 2005 | 99.0 | 106.4 | 100.0 | 97.4 |
May 2005 | 99.0 | 106.0 | 100.0 | 98.8 |
Jun 2005 | 98.9 | 106.5 | 100.0 | 100.6 |
Jul 2005 | 98.6 | 106.3 | 99.4 | 101.5 |
Aug 2005 | 98.7 | 106.2 | 97.9 | 99.7 |
Sep 2005 | 98.5 | 106.6 | 97.8 | 99.2 |
Oct 2005 | 98.7 | 107.8 | 97.7 | 100.7 |
Nov 2005 | 98.7 | 107.6 | 97.7 | 102.4 |
Dec 2005 | 98.6 | 107.6 | 97.6 | 101.5 |
Jan 2006 | 98.2 | 108.2 | 97.4 | 99.9 |
Feb 2006 | 98.2 | 109.0 | 97.3 | 100.8 |
Mar 2006 | 98.0 | 108.9 | 97.1 | 100.8 |
Apr 2006 | 97.8 | 109.3 | 96.8 | 99.4 |
May 2006 | 97.7 | 110.8 | 96.8 | 95.6 |
Jun 2006 | 97.5 | 111.7 | 96.7 | 96.6 |
Jul 2006 | 97.6 | 111.1 | 96.5 | 97.1 |
Aug 2006 | 97.7 | 111.1 | 96.3 | 96.2 |
Sep 2006 | 97.5 | 111.7 | 95.8 | 96.7 |
Oct 2006 | 97.3 | 110.7 | 95.5 | 97.6 |
Nov 2006 | 97.4 | 111.4 | 95.0 | 96.5 |
Dec 2006 | 97.4 | 111.0 | 94.5 | 95.8 |
Jan 2007 | 97.3 | 112.0 | 94.1 | 97.6 |
Feb 2007 | 97.3 | 111.5 | 93.6 | 97.2 |
Mar 2007 | 97.5 | 112.4 | 93.5 | 96.2 |
Apr 2007 | 97.5 | 112.1 | 93.3 | 94.6 |
May 2007 | 97.8 | 112.7 | 92.8 | 93.8 |
Jun 2007 | 98.2 | 113.4 | 92.2 | 93.5 |
Jul 2007 | 98.6 | 114.1 | 91.5 | 91.8 |
Aug 2007 | 99.0 | 114.4 | 91.5 | 91.9 |
Sep 2007 | 99.2 | 114.4 | 90.9 | 90.0 |
Oct 2007 | 99.4 | 114.9 | 90.6 | 87.6 |
Nov 2007 | 99.6 | 116.2 | 89.7 | 85.6 |
Dec 2007 | 99.7 | 116.2 | 89.0 | 87.3 |
Jan 2008 | 100.6 | 118.0 | 87.5 | 86.5 |
Feb 2008 | 100.6 | 118.3 | 86.6 | 86.0 |
Mar 2008 | 101.2 | 120.0 | 85.4 | 83.2 |
Apr 2008 | 101.6 | 122.2 | 84.6 | 83.3 |
May 2008 | 102.3 | 122.9 | 84.2 | 83.7 |
Jun 2008 | 102.9 | 124.2 | 83.4 | 84.4 |
Jul 2008 | 103.7 | 125.6 | 82.6 | 83.8 |
Aug 2008 | 103.9 | 125.5 | 82.7 | 87.6 |
Sep 2008 | 103.8 | 124.1 | 82.5 | 89.4 |
Oct 2008 | 103.7 | 122.2 | 82.6 | 95.4 |
Nov 2008 | 103.0 | 117.6 | 82.5 | 98.2 |
Dec 2008 | 102.5 | 115.6 | 82.8 | 95.7 |
Jan 2009 | 102.1 | 115.4 | 82.6 | 96.2 |
Feb 2009 | 101.6 | 115.1 | 82.6 | 98.7 |
Mar 2009 | 101.0 | 114.8 | 82.6 | 99.4 |
Apr 2009 | 100.5 | 114.0 | 82.5 | 97.5 |
May 2009 | 100.5 | 114.0 | 82.4 | 93.5 |
Jun 2009 | 100.5 | 114.8 | 82.6 | 91.3 |
Jul 2009 | 100.4 | 114.7 | 82.5 | 90.6 |
Aug 2009 | 100.7 | 115.5 | 82.5 | 89.1 |
Sep 2009 | 100.6 | 116.0 | 82.5 | 87.6 |
Oct 2009 | 100.5 | 116.5 | 82.5 | 86.2 |
Nov 2009 | 100.5 | 117.2 | 82.5 | 85.7 |
Dec 2009 | 100.7 | 117.8 | 82.5 | 86.7 |
Jan 2010 | 100.4 | 118.7 | 82.5 | 87.3 |
Feb 2010 | 100.3 | 118.6 | 82.5 | 89.3 |
Mar 2010 | 100.2 | 118.8 | 82.5 | 88.9 |
Apr 2010 | 100.4 | 119.5 | 82.5 | 89.2 |
May 2010 | 100.7 | 119.9 | 82.5 | 92.8 |
Jun 2010 | 100.5 | 118.7 | 82.4 | 93.5 |
Jul 2010 | 100.6 | 118.8 | 81.9 | 90.8 |
Aug 2010 | 100.6 | 119.2 | 82.0 | 89.8 |
Sep 2010 | 100.6 | 119.1 | 81.4 | 88.7 |
Oct 2010 | 100.9 | 118.9 | 80.6 | 85.5 |
Nov 2010 | 101.2 | 120.4 | 80.4 | 86.1 |
Dec 2010 | 101.5 | 120.7 | 80.3 | 87.2 |
Jan 2011 | 101.9 | 119.9 | 79.7 | 86.2 |
Feb 2011 | 102.2 | 121.1 | 79.5 | 85.1 |
Mar 2011 | 102.8 | 121.9 | 79.3 | 83.7 |
Apr 2011 | 103.2 | 123.2 | 78.9 | 82.2 |
May 2011 | 103.5 | 124.2 | 78.5 | 82.3 |
Jun 2011 | 103.8 | 124.0 | 78.2 | 82.2 |
Jul 2011 | 104.1 | 124.5 | 78.0 | 81.7 |
Aug 2011 | 104.2 | 125.0 | 77.4 | 81.6 |
Sep 2011 | 104.5 | 124.8 | 77.2 | 84.2 |
Oct 2011 | 104.9 | 124.3 | 77.0 | 84.7 |
Nov 2011 | 105.2 | 123.9 | 76.8 | 85.4 |
Dec 2011 | 105.2 | 123.8 | 76.7 | 86.6 |
Jan 2012 | 105.5 | 123.4 | 76.3 | 86.8 |
Feb 2012 | 105.6 | 123.3 | 76.1 | 85.5 |
Mar 2012 | 105.5 | 124.8 | 76.3 | 86.3 |
Apr 2012 | 105.1 | 124.6 | 76.2 | 86.1 |
May 2012 | 105.0 | 124.9 | 76.4 | 87.5 |
Jun 2012 | 105.0 | 124.1 | 76.9 | 88.8 |
Jul 2012 | 105.0 | 123.6 | 77.0 | 89.0 |
Aug 2012 | 105.0 | 123.0 | 76.8 | 87.8 |
Sep 2012 | 104.8 | 123.7 | 76.4 | 85.9 |
Oct 2012 | 104.6 | 124.0 | 75.7 | 86.1 |
Nov 2012 | 104.6 | 124.0 | 75.3 | 87.1 |
Dec 2012 | 104.6 | 124.1 | 75.3 | 86.5 |
Jan 2013 | 104.5 | 124.7 | 75.2 | 87.0 |
Feb 2013 | 104.4 | 125.1 | 75.3 | 88.2 |
Mar 2013 | 104.2 | 125.1 | 75.1 | 90.2 |
Apr 2013 | 104.2 | 124.3 | 74.7 | 90.1 |
May 2013 | 103.6 | 123.5 | 74.2 | 91.0 |
Jun 2013 | 103.6 | 122.8 | 74.1 | 90.2 |
Jul 2013 | 103.6 | 122.7 | 74.1 | 91.3 |
Aug 2013 | 103.6 | 122.4 | 74.0 | 90.3 |
Closing out the past 10 years, the overall trend of import and export prices—and, indeed, of the Consumer Price Index (CPI) and the PPI—was affected primarily by several broad trends: first the spike in food and oil prices in 2008 and then the sharp declines in these series that paralleled the 2008–2009 recession. The value of U.S. trade, both imports and exports, declined during this period. From 2010 through 2012, however, the value of trade rebounded and export and import prices moved moderately higher.
Assessing the 40-year price trends of U.S. exports and imports is enlightening. As the 2013 Economic Report of the President states, “The Nation’s economic recovery and long-run growth prospects depend in large part on U.S. businesses being able to compete in an open, fair and growing world economy.”5 One critical ingredient for data-driven decisionmaking is having high-quality, reliable data.
During the third quarter of 2013, the price index for overall imports advanced 0.4 percent, following a 1.7-percent decline in the second quarter. The increase in import prices was driven by a 3.8-percent rise in the index for fuel imports. Falling prices for nonfuel imports during the quarter largely offset the increase in fuel prices.
Fuel imports. The price index for fuels and lubricants increased 3.8 percent in the third quarter of 2013, after falling 4.8 percent in the second quarter of the year. The advance for the quarter ended in September was brought about by increases of 1.5 percent in July, 1.6 percent in August, and 0.6 percent in September. A rise of 5.2 percent in petroleum prices from June to September drove the quarterly advance and helped to offset a 32.9-percent decline in natural gas prices.
Following a 5.4-percent drop during the second quarter, petroleum prices advanced 5.2 percent for the 3 months ended in September. Growing tensions between Syria and the United States combined with political unrest in Libya to pushed import petroleum prices higher over the 3-month period.6 Prices for petroleum were up each month in the third quarter, rising 2.4 percent, 1.9 percent, and 0.8 percent, respectively. The trade deficit for oil remains large in dollar terms despite the United States importing less oil in recent years.7
The 32.9-percent drop in the price index for natural gas was the largest quarterly decrease since a 34.7-percent decline during the first quarter of 2006. July began the third quarter with a 22.1-percent drop, the largest monthly decline since a 23.0-percent decrease in October 2006. In July, the Energy Information Administration reported a record high of 74.52 billion cubic feet of natural gas output in the lower 48 states, the highest level of output since that agency began measuring output in 2005.8 With mild temperatures resulting in lowered demand, the price of natural gas continued its downward trend, falling 7.5 percent in August and 6.9 percent in September.
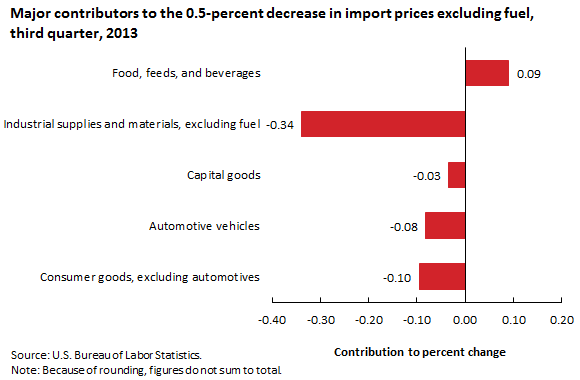
Nonfuel imports. Import prices excluding fuel decreased 0.5 percent over the third quarter of 2013, because of declines of 0.4 percent in July and 0.2 percent in August. As shown in chart 4, lower prices for nonfuel industrial supplies and materials had the largest contribution to the overall decline in nonfuel prices. Falling prices for consumer goods, automotive vehicles, and capital goods also factored into the decrease in the price index for nonfuel imports.
| Category | Percent change |
|---|---|
Consumer goods, excluding automotives | -0.10 |
Automotive vehicles | -0.08 |
Capital goods | -0.03 |
Industrial dupplies and materials, excluding fuel | -0.34 |
Food, feeds, and beverages | 0.09 |
Prices for nonfuel industrial supplies and materials fell 2.0 percent in the third quarter of 2013, largely because of falling gold prices. Despite a 4.6-percent increase in September, prices for gold decreased 5.3 percent in July and 3.6 percent in August, leaving the index down 4.4 percent for the 3-month period. After sharp drops in the price of gold since the beginning of the year, the global gold supply fell as recyclers refrained from selling the metal.9
Each of the finished-goods categories decreased as well in the third quarter. Prices for automotive vehicles declined 0.5 percent, and the price index for consumer goods fell 0.3 percent, between June and September. Prices for capital goods decreased 0.1 percent over the same period.
In contrast, the price index for foods, feeds, and beverages rose 1.5 percent for the quarter ended in September. Primarily, prices for vegetables drove the index up, with a 1.8-percent increase for the third quarter, following a 5.4-percent decline in the second quarter of the year.
For the third quarter of 2013, the price index for overall exports declined 0.3 percent, following a decrease of 1.2 percent in the second quarter. Prices for agricultural commodities dropped 3.9 percent between June and September, while prices for nonagricultural commodities rose 0.2 percent.
Agricultural exports. The price index for agricultural exports declined 3.9 percent in the third quarter of 2013, almost entirely because of a decrease of 4.2 percent in August. The same index also fell 0.3 percent in July but increased 0.7 percent in September. The large decline in August was brought about by falling prices for soybeans and corn, which declined 15.9 percent and 14.4 percent, respectively. Improved weather conditions prevailed throughout much of the Midwestern United States. Seasonally mild temperatures and abundant rain, especially in August, raised expectations that U.S. crops would benefit from the good growing conditions and produce strong yields.10 After a drought the previous year resulted in a severe reduction in production, many farmers responded by increasing the amount of acreage, they planted in corn.11 The improved weather conditions and increased acreage resulted in the U.S. Department of Agriculture estimating that, in 2013, farmers will harvest a record 13.76 billion bushels of corn, a 27.7-percent increase over the previous year’s harvest.12 The soybean harvest was forecast to rise 13.4 percent, to 3.4 billion bushels.
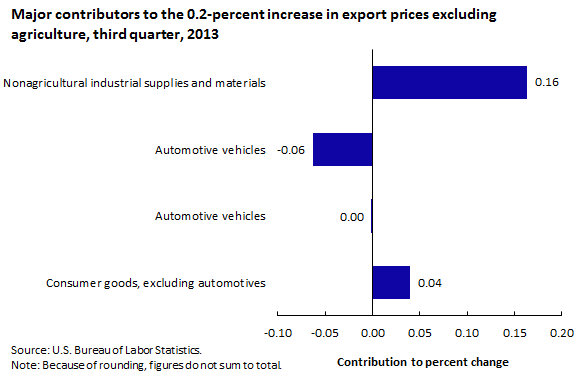
Nonagricultural exports. In the third quarter of 2013, the price index for nonagricultural exports rose 0.2 percent, after declining 1.3 percent the previous quarter. The advance was spurred by a 0.3-percent increase in September, while a 0.2-percent decrease in July counterbalanced the September advance. As seen in chart 5, the price index for nonagricultural industrial supplies and materials was the primary contributor to the overall movement of nonagricultural exports.
| Category | Percent change |
|---|---|
Consumer Goods, Excluding Automotives | 0.04 |
Automotive Vehicles | 0.00 |
Capital Goods | -0.06 |
Nonagricultural Industrial Supplies and Materials | 0.16 |
Nonagricultural industrial supplies and materials increased 0.5 percent for the quarter as the result of advances of 0.3 percent in August and 0.8 percent in September, which were partially mitigated by a 0.6-percent decrease in July. The August and September increases were brought about by rising prices for fuel oil in both months and higher prices for nonmonetary gold and other precious metals in September. The July decrease was primarily the result of falling prices for nonmonetary gold and other precious metals. Prices for the major finished-goods categories were mixed in the third quarter of 2013. Consumer goods prices declined 0.5 percent, while capital goods prices ticked up 0.1 percent and prices for automotive vehicles recorded no change.
This BEYOND THE NUMBERS summary was prepared by William Alterman, Edwin Bennion, and Sharon Royales, economists in the International Prices Program, Office of Prices and Living Conditions, U.S. Bureau of Labor Statistics. Email: mead.dave@bls.gov, telephone: (202) 691-7154; email: royales.sharon@bls.gov, telephone: (202) 691-7166; or email: bennion.edwin@bls.gov, telephone: (202) 691-7142.
Information in this article will be made available upon request to individuals with sensory impairments. Voice phone: (202) 691-5200. Federal Relay Service: 1-800-877-8339. This article is in the public domain and may be reproduced without permission.
Notes
William Alterman, Edwin Bennion, and Sharon Royales, “Forty Years of the BLS Export and Import Price Indexes: trends and competition ,” Beyond the Numbers: Global Economy, vol. 2 / no. 24 (U.S. Bureau of Labor Statistics, December 2013), https://www.bls.gov/opub/btn/volume-2/forty-years-of-the-bls-export-and-import-price-indexes.htm
Publish Date: Monday, December 09, 2013