An official website of the United States government
 United States Department of Labor
Steadily growing global demand for grain crops has generated higher crop prices and increased demand for fertilizers, particularly imported fertilizers. As corn prices remain high, U.S. corn growers are expected to plant 97.3 million acres of corn in 2013, representing the largest planting since 1936.1 This large planting is likely to translate into another year of high fertilizer prices. However, other factors such as changing input prices often have an impact on fertilizer prices. The severity of the drought in 2012 caused an unanticipated decline in the demand for fertilizer leading to large price declines. Looking at trends in the Bureau of Labor Statistics (BLS) import price index for fertilizer can help shed some light on the changing price dynamics.
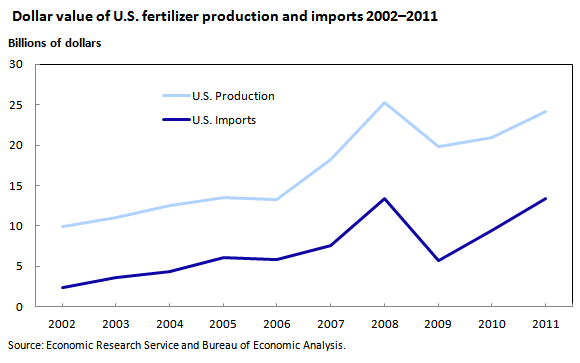
Fertilizers are substances that can be applied to the soil to increase yields and quality in crops, especially when combined with favorable weather. U.S. farmers rely heavily on imports for their fertilizer supplies. In 2011, the United States imported 13.4 billion dollars of fertilizer and produced 24.1 billion dollars of fertilizer.2 (See chart 1.) The dollar value of imported fertilizer to the United States increased 466.2 percent between 2002 and 2011, more than three times the rate of domestic fertilizer during the same period.
There are three major types of fertilizer: nitrogen, potash, and phosphate. Of the three principle fertilizer types, the United States imported more than 50 percent of U.S. nitrogen supplies and 85 percent of U.S. potash supplies, making these fertilizer imports especially important for U.S. crop production.3 Trinidad and Tobago, Canada, Russia, and the Near East were the largest suppliers of nitrogen to the United States, although Canada, Belarus, and Russia supplied the vast majority of potash imports.4 Most of the U.S. phosphate supply, in contrast, was produced domestically, making the United States the world’s largest phosphate exporter.5

| Year | U.S. production | U.S. imports |
|---|---|---|
2002 | $9,965,000,000 | $2,361,746,253 |
2003 | 11,026,000,000 | 3,572,452,412 |
2004 | 12,551,000,000 | 4,382,482,411 |
2005 | 13,455,000,000 | 6,104,231,573 |
2006 | 13,237,000,000 | 5,802,049,514 |
2007 | 18,222,000,000 | 7,608,153,202 |
2008 | 25,226,000,000 | 13,420,200,284 |
2009 | 19,845,000,000 | 5,721,979,839 |
2010 | 20,985,000,000 | 9,461,057,401 |
2011 | 24,135,000,000 | 13,373,370,150 |
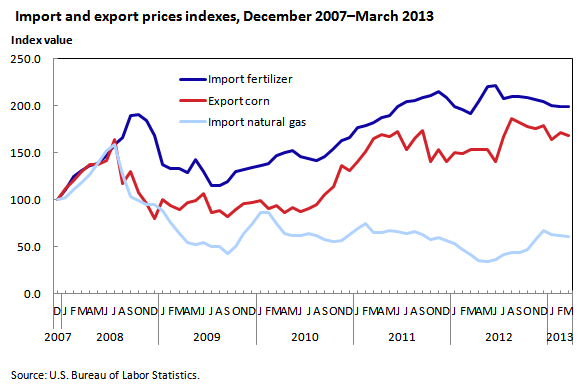
U.S. import fertilizer prices have been on the rise in recent years and have nearly doubled since the index was first published in December 2007. (See chart 2.) From December 2007 to October 2008, prices for import fertilizer jumped 90.4 percent. That period coincided with a sharp runup in many commodity prices, which affected both the prices of commercial grain crops, and major products that were used to manufacture fertilizer, notably natural gas. However, during the latter months of 2008, the U.S. economy experienced a general reversal in price trends, including fertilizer. Import fertilizer prices fell 39.8 percent from October 2008 to July 2009.
Following the summer of 2009, with a few exceptions, prices for imported fertilizer rose steadily, before the most recent peak at the start of the summer growing season in 2012. From July 2009 to June 2012, the price index for imported fertilizer increased 93.1 percent. Import fertilizer prices fell 9.5 percent from June 2012 to March 2013.

| Month | Import fertilizer | Import natural gas | Export corn |
|---|---|---|---|
Dec 2007 | 100.0 | 100.0 | 100.0 |
Jan 2008 | 110.5 | 102.2 | 111.9 |
Feb 2008 | 124.3 | 111.2 | 120.8 |
Mar 2008 | 130.6 | 118.6 | 130.5 |
Apr 2008 | 136.1 | 126.5 | 137.3 |
May 2008 | 138.0 | 138.8 | 137.3 |
Jun 2008 | 146.9 | 152.1 | 141.7 |
Jul 2008 | 159.2 | 159.2 | 163.7 |
Aug 2008 | 165.9 | 126.3 | 116.9 |
Sep 2008 | 189.7 | 102.9 | 129.8 |
Oct 2008 | 190.4 | 98.9 | 107.7 |
Nov 2008 | 184.4 | 95.2 | 96.3 |
Dec 2008 | 168.4 | 95.1 | 80.2 |
Jan 2009 | 137.1 | 88.1 | 100.1 |
Feb 2009 | 133.3 | 76.0 | 93.9 |
Mar 2009 | 133.6 | 64.5 | 89.5 |
Apr 2009 | 128.4 | 54.8 | 97.5 |
May 2009 | 142.8 | 52.5 | 99.3 |
Jun 2009 | 130.5 | 54.7 | 107.1 |
Jul 2009 | 114.6 | 50.1 | 86.1 |
Aug 2009 | 114.7 | 50.0 | 88.3 |
Sep 2009 | 119.3 | 42.9 | 81.9 |
Oct 2009 | 129.5 | 50.4 | 89.3 |
Nov 2009 | 131.6 | 64.1 | 95.6 |
Dec 2009 | 133.8 | 73.2 | 96.8 |
Jan 2010 | 136.5 | 86.2 | 99.1 |
Feb 2010 | 138.9 | 86.5 | 90.6 |
Mar 2010 | 147.0 | 74.2 | 93.5 |
Apr 2010 | 150.6 | 63.7 | 86.5 |
May 2010 | 152.8 | 61.4 | 91.4 |
Jun 2010 | 146.4 | 61.3 | 87.2 |
Jul 2010 | 143.9 | 64.5 | 90.7 |
Aug 2010 | 141.9 | 61.3 | 95.3 |
Sep 2010 | 146.3 | 57.7 | 105.2 |
Oct 2010 | 154.6 | 55.7 | 114.4 |
Nov 2010 | 162.9 | 56.8 | 136.0 |
Dec 2010 | 166.4 | 62.6 | 130.6 |
Jan 2011 | 176.8 | 69.1 | 140.9 |
Feb 2011 | 179.2 | 75.1 | 151.7 |
Mar 2011 | 182.6 | 65.4 | 165.1 |
Apr 2011 | 187.3 | 64.7 | 169.4 |
May 2011 | 189.6 | 66.7 | 167.7 |
Jun 2011 | 199.1 | 66.4 | 173.0 |
Jul 2011 | 204.7 | 64.1 | 153.1 |
Aug 2011 | 205.8 | 66.0 | 165.4 |
Sep 2011 | 208.7 | 63.2 | 173.9 |
Oct 2011 | 211.1 | 57.2 | 140.9 |
Nov 2011 | 215.5 | 59.2 | 153.5 |
Dec 2011 | 209.0 | 56.9 | 140.9 |
Jan 2012 | 199.5 | 53.1 | 149.7 |
Feb 2012 | 196.2 | 47.4 | 149.3 |
Mar 2012 | 192.1 | 41.3 | 153.1 |
Apr 2012 | 204.5 | 35.4 | 153.7 |
May 2012 | 220.4 | 34.0 | 153.5 |
Jun 2012 | 221.3 | 36.7 | 140.7 |
Jul 2012 | 207.4 | 41.3 | 167.7 |
Aug 2012 | 209.4 | 43.4 | 186.3 |
Sep 2012 | 210.3 | 43.2 | 182.6 |
Oct 2012 | 209.1 | 46.5 | 177.5 |
Nov 2012 | 206.6 | 57.4 | 175.7 |
Dec 2012 | 204.6 | 66.9 | 178.6 |
Jan 2013 | 200.5 | 62.8 | 163.8 |
Feb 2013 | 199.7 | 61.6 | 171.9 |
Mar 2013 | 199.5 | 60.7 | 168.8 |
During the period from mid-2009 to March 2013, the two main factors that have traditionally influenced fertilizer import prices—the price of grain crops and the U.S. price of natural gas—started to move in different directions.
Grain prices have increased over the past 3 years. Corn has been the most important of the grains, accounting for the most acreage, using the most fertilizer, and recently set price records in 2012. Chart 2 illustrates how corn has experienced large price increases since early 2010. Since 2009, planted domestic corn acreage has increased 12.6 percent, particularly in response to the record-breaking prices.6 Corn is estimated to account for approximately 40 percent of U.S. fertilizer consumption.7
Increases in corn demand for ethanol production, drought weather conditions, and low grain stocks were some factors for higher corn prices.8 These price pressures occurred amidst a backdrop of other long term factors strengthening global grain demand, such as population growth, and increased demand for grain-fed animal protein enabled by global economic growth.9
These high grain prices gave U.S. farmers an incentive to plant more acreage and invest more money into crop inputs. Insufficient domestic fertilizer supplies and rising grain prices created greater demand for imported fertilizer and a subsequent rise in import fertilizer prices. As seen in chart 2, import prices advanced 93.1 percent for the 3-year period from July 2009 to June 2012. The June 2012 price peak coincided with the high growth season, when most nitrogen fertilizers are applied to corn.10
However, from the June 2012 peak to March 2013, the import fertilizer price index declined 9.5 percent, while many grain prices continued to increase. This seemingly contradictory outcome was a result of a combination of factors. During the 2012 drought, farmers ceased to apply fertilizer to crops that were already dying. In addition, with drought conditions, fertilizers were less likely to leach away in runoff. With fertilizers not consumed by the drought stricken and dying crops, nor leached away as quickly by rain, some residual fertilizers were more likely to remain in the soils and this could reduce demand for the next year’s fertilizer orders. In the second half of 2012, fertilizer import prices started to decrease. These factors had a major impact on the fall 2012 phosphate and potash applications. According to the United States Department of Agriculture, 2012 nitrogen imports were similar to the elevated 2011 levels because of high grain prices, but phosphate and potash imports declined 22 percent and 20 percent, respectively.11
Inorganic fertilizer production is an energy intensive process, relying heavily on electricity, petroleum, and especially natural gas for manufacture and transport. Natural gas constitutes approximately 74 percent of the energy used to manufacture fertilizers.12 High energy prices were cited as a principle factor that led to the record fertilizer prices reached in 2008.13 Although most potassium and phosphorus supplies need to be mined, industrial nitrogen fertilizers are mainly produced from natural gas synthesized ammonia compounds. According to The Fertilizer Institute’s Ammonia Production Cost Survey, natural gas accounts for 72 percent to 85 percent of the cost of ammonia production.14
Because nitrogen fertilizers account for the largest amount of import trade dollars in the import price index, and natural gas is the overwhelming input cost for nitrogen fertilizers, decreasing U.S. natural gas prices should have put downward pressure on import fertilizer prices because more nitrogen fertilizer would be produced domestically. However, most domestic nitrogen fertilizer producers could not scale up capacity fast enough to take back market share that had been lost to import fertilizer suppliers. During the 2002–2008 period, increasing natural gas prices contributed to U.S. nitrogen plant closures, and fertilizer prices rose with natural gas prices and increased imports.15 In contrast, Chart 2 shows that since early 2010, import fertilizer prices rose while natural gas prices declined. This decoupling can partially be explained by natural gas being a mostly regional commodity that had a steep and unexpected price decrease in the United States. New drilling technologies were implemented to expand natural gas supplies in the United States faster than in the nitrogen fertilizer export countries.16 Because of the unexpectedly strong decline in U.S. natural gas prices, domestic nitrogen producers have not scaled up production capacity fast enough to reduce reliance on imports. Demand remained high for fertilizer imports, despite the decline in natural gas prices. Existing U.S. ammonia producers are now price competitive and several new plants are under construction.17 While the insufficient availability of domestic supply was a factor in rising import fertilizer prices, the principle price factor was the demand generated from high grain prices.
Prior to 2010, import fertilizer prices were directly influenced by the demand for fertilizer as well as the price of natural gas, a key component in the manufacture of many fertilizers. Falling domestic natural gas prices over the past few years appeared to have had comparatively little impact on fertilizer prices, which trended up primarily due to ever-increasing demand. Because domestic fertilizer production was insufficient, fertilizer imports increased in order to supply the demand generated by high grain prices. However, the second half of 2012 exhibited a reversal of the recent trend, although grain prices reached record highs, fertilizer applications were reduced for crops that were failing from drought conditions. The BLS import fertilizer price index will continue to be important to watch during the 2013 growing season, as the rapid increase in U.S. natural gas supplies and volatile grain prices are likely to affect the domestic fertilizer supply and the demand for fertilizer imports.
The price index for overall imports increased 0.6 percent during the first quarter of 2013, despite a 0.5-percent decline in March. The advance followed a 1.0-percent decrease in the final quarter of 2012. Driving up the index for imports was an increase in prices for imports of fuels and lubricants, which advanced 2.7 percent during the first quarter of 2013, despite a decline of 1.9 percent in March. The price index for nonfuel imports also increased over the quarter, ticking up 0.1 percent.
Fuel imports. The advance for the quarter ended in March, followed a 4.3-percent decline in the fourth quarter of 2012, and was driven by advances of 1.8 percent in January and 2.8 percent in February. An increase in petroleum prices, which rose 3.2 percent over the first 3 months of the year, was responsible for the quarterly increase, and more than offset a 9.3-percent decline in natural gas prices.
A 2.2-percent advance in January, followed by a 3.0-percent rise in February, resulted in the quarterly increase in petroleum prices, despite a 1.9-percent decline in March. A major reason for the rise in January was an announced reduction in production by Saudi Arabia, the world’s largest oil producer. The country cut production by 400,000 barrels in December 2012.18 Encouraging economic news from China also contributed to the increase in oil prices in January. The Hong Kong Shanghai Bank Corporation purchasing managers index increased in January, reflecting an expansion in manufacturing.19 Expansion in China’s manufacturing means greater demand for petroleum. Petroleum prices continued to rise in February, and this rise was primarily attributed to forecasted improvement in worldwide demand and strong trade data from China.20 In addition, the U.S. Energy Information Administration (EIA) announced in February that world oil demand will grow faster in 2013 than previously expected, increasing its forecast to 1.05 million barrels-per-day (bpd), up 100,000 bpd from the previous forecast.21 However, petroleum prices declined 1.9 percent in March largely from increases in the supply and wavering demand. During March, the EIA announced an increase in U.S. crude supplies of 2.6 million barrels per week, and industrial production in the eurozone countries declined.22
The price index for natural gas declined 9.3 percent during the first quarter of 2013, led by a 6.1-percent decrease in January. The decline in the first quarter of 2013 was in stark contrast to the previous quarter’s increase of 54.9 percent. High natural gas stocks, as reported by the EIA, helped lower prices. At the beginning of February, stocks of natural gas stood at 2.864 trillion cubic feet, 351 billion cubic feet above the 5-year average.23
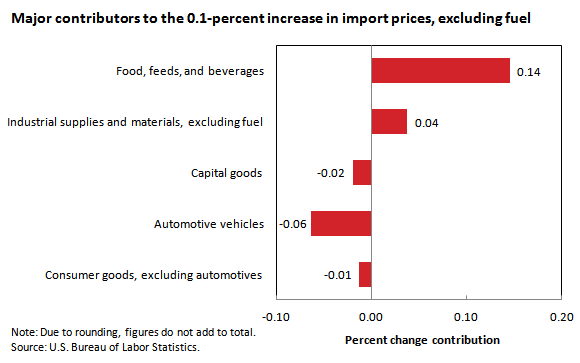
Nonfuel imports. The price index for nonfuel imports excluding fuels ticked up 0.1 percent in the first quarter of 2013, due to increases in January and February of 0.2 percent and 0.1 percent, respectively. The monthly increases were largely offset by a 0.2 percent decline in March. As seen in chart 3, rising prices for foods, feeds, and beverages drove the increase, while falling prices for automotive vehicles partially offset the advance.

| Category | Percent change |
|---|---|
Food, feeds, and beverages | 0.14 |
Industrial supplies and materials, excluding fuel | 0.04 |
Capital goods | -0.02 |
Automotive vehicles | -0.06 |
Consumer goods, excluding automotives | -0.01 |
Foods, feeds, and beverages increased 2.4 percent during the first quarter of 2013, the first quarterly increase since a 1.2-percent advance during the first quarter of 2012. Prices for vegetables and vegetable preparations rose 7.7 percent in March, after advancing 3.3 percent in February. Higher fish and shellfish prices also contributed to the increase in the food category, advancing 2.3 percent in February and 3.8 percent in March.
With the exception of fuel, prices for the other major categories had a smaller impact on the overall movement of import prices. The price index for industrial supplies and materials, excluding fuel increased 0.2 percent, while, in contrast, automotive vehicles prices and prices for capital goods decreased 0.3 percent and 0.1 percent, respectively.
Export prices. In the first quarter of 2013 the price index for overall exports increased 0.7 percent, following a 0.7-percent decrease in the fourth quarter of 2012. Prices for agricultural commodities declined 1.0 percent between January and March, while nonagricultural export prices rose 0.9 percent.
Agricultural exports. The price index for agricultural exports decreased 1.0 percent in the first quarter of 2013, due to declines of 1.8 percent and 1.2 percent in March and January, respectively, and despite a 2.1-percent advance in February. Improved weather forecasts for Brazil and Argentina contributed to the falling prices for corn, wheat, and soybeans, which decreased 8.6 percent, 7.9 percent, and 3.5 percent, in January.24 In February, prices for soybeans and corn rose 3.8 percent and 4.9 percent, respectively, on concerns that the Brazilian and Argentinean crops would suffer from lack of rain. In March, decreasing prices for fruit and soybeans, which fell 7.1 percent and 5.1 percent, respectively, led the decline. Wheat prices fell after the USDA increased their forecast for wheat supplies.
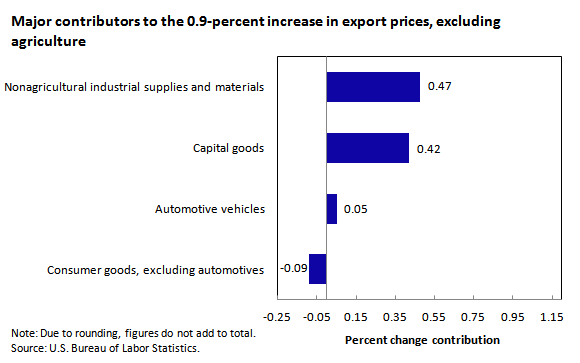
Nonagricultural exports. The price index for nonagricultural exports increased 0.9 percent in the first quarter of 2013, after decreasing 0.5 percent in the final quarter of 2012. The quarterly increase was led by a 0.5-percent increase in January, followed by a 0.6-percent increase in February. As seen in chart 4, the price indexes for nonagricultural industrial supplies and materials and capital goods were the primary contributors to the quarterly increase.

| Category | Month |
|---|---|
Nonagricultural industrial supplies and materials | 0.47 |
Capital goods | 0.42 |
Automotive vehicles | 0.05 |
Consumer goods, excluding automotives | -0.09 |
Nonagricultural industrial supplies and materials prices rose 1.3 percent for the January–March period on the strength of rising fuel prices. Prices for capital goods increased 1.0 percent during the first quarter of 2013, due to higher computer and semiconductor prices. Automotive vehicles increased 0.5 percent for the first quarter of 2013, while consumer goods declined 0.6 percent.
This BEYOND the NUMBERS was prepared by Edwin Bennion and Jon Ruder, economists, in the Office of Prices and Living Conditions, Washington, DC. Email: MXPinfo@bls.gov. Telephone: 202-691-7101.
For more benefits information, see www.bls.gov/mxp. For additional assistance, contact one of our information offices: National-Washington, DC: (202) 691-6199, TDD (800) 877-8339; Atlanta (404) 893-4222; Boston: (617) 565-2327; Chicago: (312) 353-1880; Dallas: (972) 850-4800; Kansas City: (816) 285-7000; New York: (646) 264-3600; Philadelphia: (215) 597-3282; San Francisco: (415) 625-2270.
Information in this article will be made available to sensory-impaired individuals upon request. Voice phone: (202) 691-5200. Federal Relay Service: 1 (800) 877-8339. This article is in the public domain and may be reproduced without permission.
Jon Ruder and Edwin Bennion, “Growing demand for fertilizer keeps prices high ,” Beyond the Numbers: Global Economy, vol. 2 / no. 12 (U.S. Bureau of Labor Statistics, May 2013), https://www.bls.gov/opub/btn/volume-2/growing-demand-for-fertilizer-keeps-prices-high.htm
Publish Date: Friday, May 10, 2013