
An official website of the United States government
An official website of the United States government
The .gov means it's official.
Federal government websites often end in .gov or .mil. Before sharing sensitive information,
make sure you're on a federal government site.
The site is secure.
The
https:// ensures that you are connecting to the official website and that any
information you provide is encrypted and transmitted securely.

The decline in the share of workers covered by traditional pension plans over the past 35 years is marked by a variety of efforts to transform these plans into vehicles that can continue to provide retirement income to workers while stabilizing the financial responsibility for employers. For example, collective bargaining disputes often involve give-and-take on the future generosity of pension benefits.1 Likewise, state governments have introduced less generous pension tiers for new employees as part of fiscal belt-tightening.2 Among the changes in pension plans tracked by the Bureau of Labor Statistics (BLS) since the late 1970s are different formulas for calculating benefits. One of those formula types is the pension equity plan, or PEP. These plans were first identified by BLS private industry surveys conducted in the late 1990s; today, they make up a small share of all pension plans. This issue of Beyond the Numbers examines the concept behind pension equity plans and looks at some unique features of these plans.
To understand PEPs, a little background may be helpful. Traditional defined benefit pension plans are designed to provide periodic payments to workers once they retire. Benefits are usually determined based on earnings, years of service, or both. Often described as “golden handcuffs,” such plans provide greater benefits for longer service. Further, benefits may be tied to salary just prior to retirement, providing greater incentive to continue working with the same employer until retirement age. Unlike 401(k)s and other defined contribution plans, pension plans don’t typically identify an employee’s ongoing balance from year to year. The employee may know that a benefit will be available at retirement, and may have some understanding of how benefits are determined, but knowing the actual benefit amount requires being prescient about future earnings and years of service.
Alternative pension formulas began to emerge in the late 1980s, notably the cash balance (or cash account) plan.3 A prominent feature of these plans is an ongoing balance, letting plan participants know the current value of their retirement benefits. From surveys conducted in 1988, BLS first identified cash balance plans covering 1 percent of full-time defined benefit plan participants in medium and large private establishments. Subsequent surveys showed growth in cash balance plans—6 percent in 1997 and 17 percent in 2002. The most recent data, for 2013, show these plans covering 30 percent of participants in private industry.4 The pension equity plan is a second alternative. It lets employees accumulate pension credits each year, which are converted to a dollar value when employment ends. BLS first identified PEPs in 1997, covering 1 percent of defined benefit participants in private industry.5 In the seven BLS surveys of private industry pension benefits from 2002 to 2013, the share of participants covered by a PEP has always been between 1 percent and 5 percent.6 Chart 1 shows how the formulas used to compute pension benefits have changed over time.
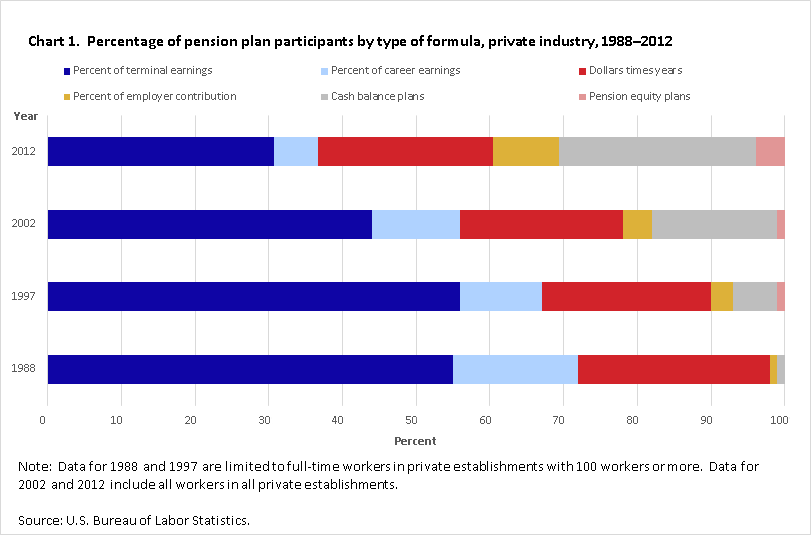
| Type of plan | 1988 | 1997 | 2002 | 2012 |
|---|---|---|---|---|
| Percent of terminal earnings | 55 | 56 | 44 | 31 |
| Percent of career earnings | 17 | 11 | 12 | 6 |
| Dollars times years | 26 | 23 | 22 | 24 |
| Percent of employer contribution | 1 | 3 | 4 | 9 |
| Cash balance plans | 1 | 6 | 17 | 27 |
| Pension equity plans | 0 | 1 | 1 | 4 |
In a typical PEP, a retirement account is established for each employee once plan eligibility requirements are met, for example, once 12 months of service is completed. The account is used to accumulate credits, often referred to as points or percents. Credits are typically granted once a year, either at the employee’s anniversary date or at a specific date in the plan year—perhaps the first or last business day of the calendar year. Credits are often based on age and length of service with the employer; for example, a plan might sum a worker’s age plus years of service and provide credits according to the following schedule:
Age plus | Annual |
0–34 | 2 |
35–44 | 3 |
45–54 | 5 |
55–69 | 7 |
70–79 | 10 |
80 or more | 12 |
Under this hypothetical example, a 25-year-old worker with 2 years of service would receive 2 credits for the year (the sum of age plus service is 27) and a 55-year-old worker with 27 years of service would receive 12 credits for the year (the sum of age plus service is 82).
A PEP may provide additional credits for workers with higher income, defined in relation to the Social Security taxable wage base (SSTWB). The SSTWB is the maximum annual earnings subject to Social Security taxes each year; in 2014 the SSTWB was $117,000. Because employers are not paying Social Security tax on employee income above the SSTWB, some employers provide additional retirement benefits on that higher income. The additional PEP credits may be provided each year that the employee’s income exceeds the SSTWB, or may be determined when the employee terminates employment.
As the name implies, participants in PEPs build equity in their plans over time, in the form of an increasing balance of credits. This differs from a traditional defined benefit plan, in which the employee merely accumulates years of service, and from a cash balance plans, in which the present value of future benefits is known.
Traditional defined benefit plans identify specific age and service requirements that must be met to retire with full benefits (normal retirement) or reduced benefits (early retirement). PEPs often do not specify a retirement age. Rather, when PEP-covered workers leave their employer, total credits are summed over their career. This total is treated as a percentage and applied to some measure of the employee’s earnings, typically an average over the last few years of work. For example, earnings may be defined as the average of the 5 consecutive year period with highest earnings or the average of the last 5 years of service. This calculation yields a total dollar amount value of the pension benefit. If a worker had accumulated 210 credits and had average earnings of $70,000, the value of their benefit would be $147,000 at termination (210 percent of $70,000). Exhibit 1 provides a more detailed example at how a worker would accumulate PEP credits and how those credits are applied to earnings.
Although the end result of a PEP formula is a single dollar amount, the plan—like all defined benefit plans—must specify the default form of benefit as periodic payments for life, including survivor benefits for married employees. To do this, PEPs convert the dollar value into an annuity, based on assumptions about the employee’s life expectancy, investment returns, and other factors. (A sample annuity calculation is included in exhibit 1.) In most plans, workers can decline the annuity and opt to receive benefits as a lump sum.
In some cases, employers switched from a more traditional pension plan to a PEP. As a result, long-service employees may have benefits that come from a combination of old and new plans. In other cases, plans may have converted an employee’s service under a prior pension formula into PEP credits, often including a minimum benefit provision designed to ensure that workers are no worse off due to conversion to the PEP. Minimum benefits may also be available to short-service workers.
______________________________________________________________________________________________________
Exhibit 1.Pension equity plan (PEP) example—it’s a lot of mathPat, a 56-year-old worker, retires after 31 years of service, with average annual earnings of $120,000 for the final 3 years. Also, for the final 4 years, Pat’s earnings exceeded the Social Security Taxable Wage Base (SSTWB). That threshold was $117,000 in 2014.
In this example, we will calculate the total value of the plan and the monthly payout Pat can expect to receive from the plan.
STEP 1. Calculate total credits earnedIn this pension equity plan, employees accumulate annual credits based on the following schedule:
Age plus
years of serviceAnnual
PEP creditsAdditional
credits0–34
2
Employees also receive
2 additional credits
for each year that
earnings exceeded
the Social Security
Taxable Wage Base.35–44
3
45–54
5
55–69
7
70–79
10
80 or more
12
Based on that schedule, Pat accumulates credits as follows:
Years of
service
AgePEP
creditsYears above
SSTWBAdded
credits1–4
25–29
2/year = 8
0
0
5–9
30–34
3/year = 15
0
0
10–14
35–39
5/year = 25
0
0
15–22
40–47
7/year = 56
0
0
23–27
48–52
10/year = 50
0
0
28–31
53–56
12/year = 48
4
8
Thus, Pat's total PEP credits are summed as follows:
8 + 15 + 25 + 56 + 50 + 48 + 8 = 210 total credits
STEP 2. Calculate total value of benefitsa. Take the 210 PEP credits; convert them to 210 percent of final average salary.
b. Pat's final average salary (in the last 3 years of work) was $120,000. Multiply that by the 210 percent:$120,000 x 210 percent = $252,000
That is the total value, which is available to Pat in a lump sum or alternate form of payment. This is also referred to as the lump sum value.
STEP 3. Convert total value of benefits into an annuity—a fixed monthly sum payable for lifeApply the factor, which is based on the employee’s age and the current interest rates; factor will vary if employee is married and will receive annuity for employee and spouse. Example of factors designed to yield monthly annuity:
Age
Factor
65
137.42
60
206.13
56
261.11
55
274.84
We then divide the total PEP value by the annuity factor for age 56:
$252,000 / 261.11 = $965
That would be the monthly payment if Pat retires at age 56 and chooses the annuity option rather than the lump sum.
______________________________________________________________________________________________________
Much has been written about changes in retirement benefits, and the advantages and disadvantages of different types of plans. Employers and employees may consider different questions as they evaluate a particular retirement plan, such as:
How transparent is the plan value; that is, do employees know the current value at any point during their career?
Are plan benefits easily portable, so that an employee can move a lump sum from a former employer’s plan to a new employer’s plan?
Does the plan build in inflation protection during an employee’s career, by tying benefits to final earnings?
Are future employer costs known or easily calculated?
Are early retirement benefits subsidized, and at what cost to employers?
Whatever the perspective, BLS data show a decline in the share of workers covered by a defined benefit plan, and an increase in the share of pension participants covered by a cash balance formula. At the same time, BLS has identified a small share of participants covered by PEPs and many of them worked in health-related industries. Some PEPs have been frozen, meaning they are closed to new employees, part of the continuing decline in pension coverage. PEPs may have been introduced in part to help employees understand how their retirement plan builds value over time, but the incidence of these plans remains low.
This Beyond the Numbers article was prepared by William J. Wiatrowski, economist in the Office of Compensation and Working Conditions, U.S. Bureau of Labor Statistics. Email: wiatrowski.william@bls.gov, telephone: (202) 691-6300.
Information in this article will be made available upon request to individuals with sensory impairments. Voice phone: (202) 691-5200. Federal Relay Service: 1-800-877-8339. This article is in the public domain and may be reproduced without permission
William J. Wiatrowski, “A look at today's pension equity plans ,” Beyond the Numbers: Pay & Benefits, vol. 4 / no. 7 (U.S. Bureau of Labor Statistics, April 2015), https://www.bls.gov/opub/btn/volume-4/a-look-at-todays-pension-equity-plans.htm
1 Examples of collective bargaining debates that included disputes over pension benefits may be found in Elizabeth A. Ashack, “Profiles of Significant Collective Bargaining Disputes of 2012,” Monthly Labor Review, May 2013, available at https://www.bls.gov/opub/mlr/2013/article/profiles-of-significant-collective-bargaining-disputes-of-2012.htm.
2 For an example of the types of changes that have taken place in State retirement plans, see http://americancityandcounty.com/pension-reform/california-changes-government-workers-pension-benefits.
3 For a description of typical cash balance plans, see Kenneth R. Elliott and James H. Moore, Jr., “Cash Balance Pension Plans: The New Wave,” Compensation and Working Conditions, Summer 2000, available at https://www.bls.gov/opub/mlr/cwc/cash-balance-pension-plans-the-new-wave.pdf.
4 Retirement data are from the BLS National Compensation Survey and predecessor surveys. Earlier surveys were limited to full-time workers in private establishments employing 100 workers or more. Beginning in the late 1990s, surveys included all workers in all private establishments. The most recent data are available at https://www.bls.gov/ncs/ebs/detailedprovisions/2013/ownership/private/basic_retirement.htm#defined_benefit.
5 An earlier BLS article looked at some of the first pension equity plans, and provides information about the early history of these plans. See L. Bernard Green, “What is a Pension Equity Plan?” Compensation and Working Conditions, October 2003, available at https://www.bls.gov/opub/mlr/cwc/what-is-a-pension-equity-plan.pdf.
6 Pension equity plans are first identified in the BLS benefit survey tables in 2002. Prior to 2002, PEPs were identified under the catch-all category of “other” defined benefit formulas, and the percentage of participants was very small. Because the percentage of participants remained low in all years, and because data for 2 survey years (2009 and 2013) were not publishable due to confidentiality restrictions, readers are cautioned against using these data to show any trend in PEP coverage. It is appropriate to indicate that, since first identified, PEP coverage has been low.
Publish Date: Wednesday, April 15, 2015