
An official website of the United States government
An official website of the United States government
The .gov means it's official.
Federal government websites often end in .gov or .mil. Before sharing sensitive information,
make sure you're on a federal government site.
The site is secure.
The
https:// ensures that you are connecting to the official website and that any
information you provide is encrypted and transmitted securely.

More BLS articles and information on import and export oil prices can be found at the following links:
The Reemergence of the United States as a Global Petroleum Producer
Throughout the first half of 2014, import petroleum prices rose 10.7 percent following a near 2-year low at the end of 2013. The 6-month advance returned import prices to levels last seen at the beginning of 2012. The second half of 2014 was a much different story. Beginning in July, prices began to fall, with the Bureau of Labor Statistics (BLS) import crude petroleum index dropping 51.7 percent between June 2014 and January 2015. A confluence of factors exerted downward pressure on petroleum prices, leading to the most dramatic drop in petroleum prices since the sharp drop in prices at the end of 2008. This issue of Beyond the Numbers examines the price trends in import petroleum prices leading up to the plunge in prices in 2014. The article uses data from the BLS International Prices Program (IPP) and Energy Information Administration (EIA).
Prior to 2012, petroleum prices rose sharply, increasing 180.1 percent between February 2009 and April 2011. A number of factors that had influenced the increase continued to exert upward pressure on petroleum prices in 2012 and 2013. Strong economic growth in the United States and China and lower interest rates in some European countries indicated strengthening global demand for crude oil.1 In addition, conflict-related production disruptions in parts of the Middle East and Africa coupled with sanctions imposed on Iran kept 1 million barrels of petroleum a day off the world market.2 What changed in 2012 and 2013 that offset the upward pressure on petroleum prices was the input of increased supply, primarily from the United States. The West Texas Intermediary (WTI) price for crude oil (a grade of Texas light sweet crude petroleum used as a benchmark for domestic pricing in the United States) started 2012 at $102.96 a barrel and ended 2013 nearly the same level, at $98.17. 3 Prices varied during the period, ranging between $77.72 a barrel on June 28, 2012 and $110.62 a barrel on September 6, 2013. Prices remained between $90 and $100 a barrel over most of the 2-year period. The BLS import crude petroleum index, which measures price change using transaction data on virtually all crude petroleum imports into the United States reflected the 2-year trend. 4 As evidenced in our indexes, volatile crude petroleum has a major impact on the price of petroleum in the United States.
As seen in table 1, U.S. import prices for crude petroleum reflected the relative stability in prices over the period, declining 8.4 percent in 2012 and a further 2.5 percent in 2013. The 2012 decline was the smallest annual price change in import petroleum prices since a 7.8-percent increase in 2006.
| Year | December-December percent change |
|---|---|
| 2006 | 7.8 |
| 2007 | 50.6 |
| 2008 | -51 |
| 2009 | 78.5 |
| 2010 | 16.5 |
| 2011 | 27.6 |
| 2012 | -8.4 |
| 2013 | -2.5 |
| 2014 | -31.9 |
| Source: U.S. Bureau of Labor Statistics. | |
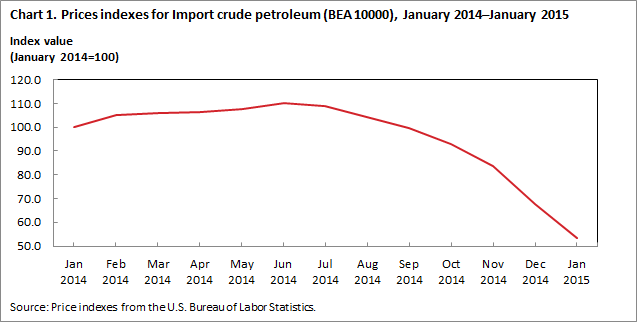
As depicted in chart 1, prices began to climb steadily at the beginning of 2014, with the import price index for crude petroleum edging up 0.5 percent in January. In February, the upward trend in prices accelerated, advancing 5.3 percent as tensions between Russia, a major world petroleum producer, and Ukraine stoked fears that energy supplies could be disrupted. At the same time, global demand grew in the wake of an unexpectedly frigid winter in the United States and an increase in Chinese petroleum imports.5 The advance accelerated in the spring of 2014, reflected by crude petroleum import price index increases of 0.3 percent in April, 1.4 percent in May, and 2.2 percent in June. Intensifying conflict involving the terrorist organization ISIS created upward price pressure amid reported concerns that the turmoil could threaten Iraqi petroleum production.6
| Month | Import crude petroleum index |
|---|---|
| Jan 2014 | 100.0 |
| Feb 2014 | 105.3 |
| Mar 2014 | 106.0 |
| Apr 2014 | 106.4 |
| May 2014 | 107.8 |
| Jun 2014 | 110.2 |
| Jul 2014 | 108.7 |
| Aug 2014 | 104.1 |
| Sep 2014 | 99.8 |
| Oct 2014 | 93.0 |
| Nov 2014 | 83.7 |
| Dec 2014 | 67.8 |
| Jan 2015 | 53.2 |
Starting in mid-June 2014, petroleum prices began to fall worldwide, and that drop continued at a significantly accelerated rate through the end of January 2015. After peaking at $107.95 a barrel on June 20, 2014, petroleum prices plunged to $44.08 a barrel by January 28, 2015, a drop of 59.2 percent in a little over 7 months.7 Not surprisingly, the sharp drop in petroleum prices also affected the price of petroleum imports into the United States.
As seen in table 2, crude petroleum import prices decreased 1.3 percent in July, 4.3 percent in August, and 4.2 percent in September.
| Month | Monthly percent change |
|---|---|
| July | -1.3 |
| August | -4.3 |
| September | -4.2 |
| October | -6.7 |
| November | -10.1 |
| December | -18.9 |
| January | -21.5 |
| Source: U.S. Bureau of Labor Statistics. | |
In the final quarter of 2014, an oversupply of petroleum on the world market led to an acceleration in the drop in overall prices. U.S. import prices decreased a further 6.7 percent in October, 10.1 percent in November, and 18.9 percent in December. By the end of the year, prices declined 31.9 percent in 2014 despite increasing over the first 6 months of the year. Prices for import crude petroleum fell 51.7 percent from June to January. The decrease, although significant, was still less than the overall drop in the WTI price of oil. Part of this is timing. Petroleum prices peaked in the middle of June 2014, while the lowest price occurred in late January 2015. When measuring crude petroleum prices, the BLS price indexes measure the average price of all import transactions in one month compared to the average price of all import transactions the previous month.8 Using a similar measure for the average daily price for WTI over the entire month, WTI declined 55.4 percent from June 2014 to January 2015. Another reason is that many import transaction prices are set by contract, and, as such, have price movements that lag behind overall market prices.
The fundamental reason for the decline in world petroleum prices in 2014 was an oversupply of petroleum compared to demand. World supply has risen over the past couple of years, largely spurred on by a growth in production from the United States. Since peaking in 2005, U.S. dependency on foreign petroleum has declined. U.S. production rose to a 24-year high in 2013, keeping petroleum prices stable despite strong demand and geopolitical uncertainties.9 Domestic production increased by 1.0 million barrels a day in 2013 from 2012 and exceeded U.S. imports for the first time in 20 years.10 Strong U.S. production continued in 2014. The breakneck pace of increased domestic petroleum production has resulted from advances in hydraulic fracturing and horizontal drilling technologies that continue to improve the process of removing petroleum from shale reserves.11,12 The Energy Information Administration has projected that U.S. petroleum production will increase to an average of 9.3 million barrels a day in 2015.13
Another factor leading to strong global supplies is increased production coming from the Organization of Petroleum Producing Countries (OPEC), notably from Saudi Arabia. At the end of November OPEC met to debate cutting production levels in light of declining prices. The subsequent decision to hold production at current levels surprised the petroleum markets, pushing prices down even further following the meeting.14 Several OPEC members—including Venezuela, Ecuador, and Iran—appealed for production cuts and called for special consultations to address declining prices, fearing the threat of financial strain on their economies.15 However, Saudi Arabia maintained that OPEC should allow the market to stabilize and ensure that the cartel protects market share against non-OPEC producers.16
One effect of the increased availability of oil, especially from the United States, is that geopolitical factors have less impact on prices than in the past. Petroleum prices continued to fall despite the facts that sanctions against both Iran and Russia reduced the supply of petroleum coming from those countries and there continued to be instability in and around a number of petroleum producing countries.
Increased supply is only part of the story. Reduced demand in the second half of 2014 was also a major factor that had not been the case during the previous 2 years of advancing petroleum supplies. An overall weakening of global demand for petroleum began in May, particularly from China and Europe. In light of the economic slowdown in a number of world economies, EIA revised the 2015 projection for global demand down 0.2 million barrels a day.17 The drop in demand was not just because of an economic slowdown, but also resulted from structural changes in recent years to promote energy efficiencies and support activities that are less energy intensive. Household and industrial production fuel consumption have become more fuel efficient and utilize alternative fuels such as natural gas. Transportation vehicles, including automobiles and airplanes, are also more fuel efficient than they were at the peak of petroleum consumption in 2007.18
Another factor related to demand is the value of the U.S. dollar. Petroleum on the world market is priced mostly in dollars, so the price for petroleum will also depend on the movements of other currencies relative to the dollar. As the relative value of the dollar increases, producers will tend to lower the price of petroleum rather than passing the entire price increase on to foreign buyers. From June 2014 to January 2015, the dollar’s value rose 14.3 percent compared to an average of currencies from major trading partners of the United States.19 The increase in the value of the dollar was even greater against select currencies. The value of the dollar advanced 15.9 percent, compared with the yen and 19.3 percent, compared with the euro.20 That meant that the price of petroleum did not change as much in Asia and Europe as in the United States. If the WTI price of petroleum declined from an average price of $105.79 a barrel in June 2014 to $47.22 a barrel in January 2015, then the WTI price in euros went from an average price of €77.82 in June 2014 to €41.44 in June 2015. Although still a sizable drop, the price of petroleum only fell 46.7 percent in terms of euros as compared with the dollar decrease of 55.4 percent.
After hitting a daily low of $44.08 a barrel on January 28, 2015, the WTI price of petroleum recovered 19.5 percent by the end of the second week of February.21 The main impetus was a reduction in drilling by American petroleum producers in hopes of salvaging investments.22 The horizontal drilling technique now being utilized in the United States and Canada gives access to previously unattainable sources of oil. However, horizontal drilling is more expensive than the traditional vertical techniques, and is therefore not profitable at lower price levels. According to EIA, the number of onshore drilling rigs in the lower 48 states declined approximately 16 percent between the end of October 2014 and the end of January 2015.23
Whether the recent decline represents the bottom of the price trough is debatable. Market jitters can still lead to price volatility in the short term, even when market fundamentals, such as a drop in U.S. petroleum rigs, support price increases. What is certain, however, is that crude petroleum price indicators will continue to be followed closely throughout the rest of 2015 as markets try to ascertain the new equilibrium.
This Beyond the Numbers article was prepared by David Mead and Porscha Stiger, Economists in the Division of International Prices, Office of Prices and Living Conditions, Email: mead.david@bls.gov, Telephone: (202) 691-7101.
Information in this article will be made available to sensory-impaired individuals upon request. Voice phone: (202) 691-5200. Federal Relay Service: 1-800-877-8339. This article is in the public domain and may be reproduced without permission.
Dave Mead and Porscha Stiger, “The 2014 plunge in import petroleum prices: What happened? ,” Beyond the Numbers: Global Economy, vol. 4 / no. 9 (U.S. Bureau of Labor Statistics, May 2015), https://www.bls.gov/opub/btn/volume-4/the-2014-plunge-in-import-petroleum-prices-what-happened.htm
Publish Date: Wednesday, May 27, 2015