An official website of the United States government
An official website of the United States government
The .gov means it's official.
Federal government websites often end in .gov or .mil. Before sharing sensitive information,
make sure you're on a federal government site.
The site is secure.
The
https:// ensures that you are connecting to the official website and that any
information you provide is encrypted and transmitted securely.
Consumer expenditure vary by age
Movies, music and sports entertainment spending
Income and spending patterns among Black households
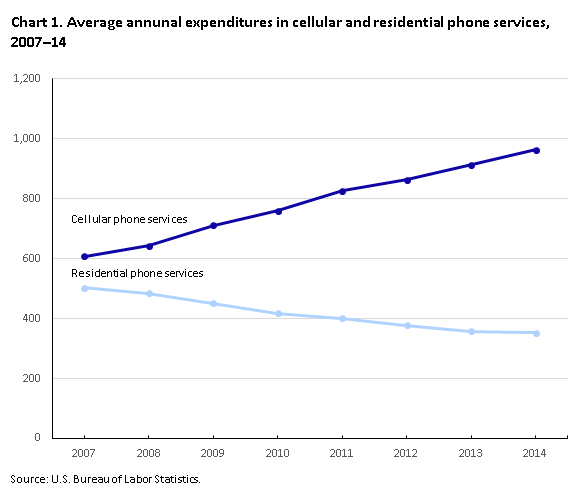
In 2007, U.S. consumers spent more on cellular phone service than they did on residential landline phone services for the first time.1 Data from the Bureau of Labor Statistics’ Consumer Expenditure Survey (CE) show that expenditures on cellular phone services continue to rise rapidly. This Beyond the Numbers article updates the 2001 through 2007 cell phone spending research published as “Spending on Cell Phone Services Has Exceeded Spending on Residential Phone Services.” Building on that original research, this article compares cellular and residential phone service expenditures by age group, income quintile, and size of consumer unit, from 2007 to 2014.
Annual expenditures for cellular phone services increased from $608 per consumer unit in 2007 to $963 in 2014—an increase of 58.4 percent. (See chart 1.) During the same period, the Consumer Price Index for All Urban Consumers (CPI-U) for wireless telephone services declined by 10.9 percent. In contrast to cellular phone service spending, expenditures for residential phone services decreased from $502 per consumer unit to $353, a decrease of 29.7 percent over the same time period. CE separates out Internet services from both cellular and residential telephone service. The amount gets mapped to the classification “Computer Information Services.”
Table 1 shows the average annual expenditures and percentage distribution for telephone, cellular phone and residential phone services from 2007 to 2014. In 2007, spending on cellular phone services as a share of total phone service spending was approximately 55 percent, while residential phone service spending made up the remaining 45 percent. However, in 2014, the ratio of cellular phone service expenditures to residential phone service expenditures was almost 3 to 1 (73.2 percent to 26.8 percent). In 2001, the opposite was true: the ratio was greater than 3 to 1 (77 percent to 23 percent) for residential phones compared to cellular phones.2 Clearly, chart 1 illustrates the trend that cellular phone services expenditures have risen while residential phone expenditures have fallen.
| Year | Telephone services | Cellular phone service | Residential phone service | |||
|---|---|---|---|---|---|---|
| Expenditure | Total | Expenditure | Percentage of total | Expenditure | Percentage of total | |
|
2007 |
$1,110 | 100.0 | $608 | 54.8 | $502 | 45.2 |
|
2008 |
1,127 | 100.0 | 643 | 57.1 | 484 | 42.9 |
|
2009 |
1,162 | 100.0 | 712 | 61.3 | 450 | 38.7 |
|
2010 |
1,178 | 100.0 | 760 | 64.5 | 418 | 35.5 |
|
2011 |
1,226 | 100.0 | 826 | 67.4 | 401 | 32.7 |
|
2012 |
1,239 | 100.0 | 862 | 69.6 | 377 | 30.4 |
|
2013 |
1,271 | 100.0 | 913 | 71.8 | 358 | 28.2 |
|
2014 |
1,315 | 100.0 | 963 | 73.2 | 353 | 26.8 |
|
Source: U.S. Bureau of Labor Statistics. |
||||||
From 2007 to 2014, the oldest age group had the highest percentage change in cellular phone service expenditures. (See table 2.) Cellular phone service expenditures for reference persons (one of the persons in the consumer unit who owns or rents the unit’s home)3 65 years and older increased by 102.3 percent from 2007 to 2014. This includes an increase of 135.1 percent for reference persons age 75 years and older. However, the 75-years-and-older age group is the only age group for which the share of cellular phone service expenditures to total telephone service expenditures was below 50 percent. Reference persons under 25 years had the highest percentage share allocated to expenditures on cellular phone services in 2007 and in 2014 (75.3 percent and 89.9 percent respectively). However, at 20.9 percent they had the lowest percentage increase in average annual cellular phone service expenditures from 2007 to 2014. Interestingly, in 2014, the percentage of reference persons under age 25 that reported cellular phone expenditures but no residential phone expenditures was 54.1 percent. This is compared with 27.7 percent for reference persons age 65 years and older.
With reference to age, spending on cellular phone services as a share of total telephone services consistently falls with increasing age: from 89.9 percent for the under-25-age group and dropping to 38.6 percent for the 75-and-older group. At the same time, the percentage change in dollars spent on cellular phone services from 2007 to 2014 consistently increases by age group. Table 2. Average annual expenditures (AAE) on cellular phone service spending, as a share of telephone expenditures, and percentage change from 2007 to 2014 by age group.
| Age group | 2007 | 2014 | Change | |||
|---|---|---|---|---|---|---|
| Expenditure | Percent share | Expenditure | Percent share | Dollar | Percent in dollars | |
|
Under 25 years |
$560 | 75.3 | $677 | 89.9 | $117 | 20.9 |
|
25-34 years |
728 | 66.5 | 1,048 | 87.8 | 320 | 44.0 |
|
35-44 years |
757 | 58.5 | 1,250 | 80.7 | 493 | 65.1 |
|
45-54 years |
753 | 56.6 | 1,248 | 76.6 | 495 | 65.7 |
|
55-64 years |
546 | 48.1 | 970 | 69.1 | 424 | 77.7 |
|
65 years and older |
264 | 32.8 | 534 | 50.1 | 270 | 102.3 |
|
65-74 years |
374 | 39.5 | 675 | 56.9 | 301 | 80.5 |
|
75 years and older |
148 | 22.5 | 348 | 38.6 | 200 | 135.1 |
|
Source: U.S. Bureau of Labor Statistics. |
||||||
Cellular phone service expenditures increased across all income quintiles, from a range of 49.6 percent for the second income quintile to 62.2 percent for the fourth income quintile from 2007 through 2014.4 (See table 3.) In terms of share of overall phone service expenditures, in 2007, the highest income quintile had the largest share of cellular phone service expenditures, compared with telephone service expenditures (58.9 percent), and in 2014, the fourth income quintile had the highest percentage share (77.2 percent). The fourth income quintile had the biggest increase in cellular phone share as well.
| Income quintile | 2007 | 2014 | Change | |||
|---|---|---|---|---|---|---|
| Expenditure | Percent share | Expenditure | Percent share | Dollar | Percent in dollars | |
|
Lowest 20 percent |
$278 | 43.4 | $445 | 62.8 | $167 | 60.1 |
|
Second 20 percent |
462 | 51.2 | 691 | 68.3 | 229 | 49.6 |
|
Third 20 percent |
602 | 54.7 | 939 | 73.5 | 337 | 56.0 |
|
Fourth 20 percent |
762 | 57.7 | 1,236 | 77.2 | 474 | 62.2 |
|
Highest 20 percent |
933 | 58.9 | 1,503 | 76.1 | 570 | 61.1 |
|
Source: U.S. Bureau of Labor Statistics. |
||||||
From 2007 to 2014, expenditures for cellular phone services increased from a range of 38.7 percent for one-person consumer units to 70.9 percent for consumer units of 5 or more persons. (See table 4.) One-person consumer units have the lowest share of cellular expenditures compared with telephone service expenditures for all household size groups, but the share increased from 49 percent in 2007 to 64.3 percent in 2014.5 Reference person’s age 75 and older made up 17.5 percent of all single consumer units as of as of 2014. Consumer units with four persons had the highest share (58.8 percent) of telephone service expenditures on cellular phone services in 2007, but consumer units with five or more persons had the highest share (79.5 percent) in 2014.
| Consumer unit size | 2007 | 2014 | Change | |||
|---|---|---|---|---|---|---|
| Expenditure | Percent share | Expenditures | Percent share | Dollar | Percent in dollars | |
|
One person |
$346 | 49.0 | $480 | 64.3 | $134 | 38.7 |
|
Two or more persons |
718 | 56.1 | 1,168 | 75.0 | 450 | 62.7 |
|
Two persons |
581 | 52.6 | 938 | 69.9 | 357 | 61.4 |
|
Three persons |
781 | 58.2 | 1,260 | 76.7 | 479 | 61.3 |
|
Four persons |
858 | 58.8 | 1,400 | 79.4 | 542 | 63.2 |
|
Five or more persons |
876 | 57.9 | 1,497 | 79.5 | 621 | 70.9 |
|
Source: U.S. Bureau of Labor Statistics. |
||||||
Over the past 8 years, consumer units in all age groups, income quintiles and household size groups continued to increase their spending on cell phones. The under-25-age group now makes almost 90 percent of their total telephone expenditures for cellular phone services, closely followed by the 25- to-34-year-old group at 88 percent. However, the growth rate in their expenditures has slowed over time for these two age groups. In 2014, the highest income quintile as well as households with five or more people now spend an average of approximately $1,500 per year on cellular phone services. A single person spends almost $500 per year on average. The shift of consumer expenditures on telephone services from increasing cellular services and decreasing residential services has been drastic. The data continued to point towards a decline in consumers’ spending on residential phone services that started as far back as 2001.
This Beyond the Numbers article was prepared by Brett Creech, economist in Office of Prices and Living Conditions, U.S. Bureau of Labor Statistics. E-mail:creech.brett@bls.gov; telephone: (202) 691-6900.
Information in this article will be made available to sensory-impaired individuals upon request. Voice phone: (202) 691-5200. Federal Relay Service: 1-800-877-8339. This article is in the public domain and may be reproduced without permission.
Brett Creech, “Expenditures on cellular phone services have increased significantly since 2007,” Beyond the Numbers: Prices & Spending, vol. 5, no. 1 (U.S. Bureau of Labor Statistics, February 2016), https://www.bls.gov/opub/btn/volume-5/expenditures-on-celluar-phone-services-have-increased-significantly-since-2007.htm
[1]The 2007 residential phone service expenditures from this article are slightly different from the linked article due to combining residential phone services and other services (phone cards, pager services, and VoIP services). Data on expenditures for cellular and residential telephone services for 2013 and 2014 are available as published tables from the Consumer Expenditure Survey. These tables are available on the CE webpage at https://www.bls.gov/cex/tables.htm. Data prior to 2013 are from unpublished components of telephone expenditures and are available upon request. Data for 2014 were released on September 3, 2015 and to learn more please visit Consumer Expenditures in 2014. For information regarding the 2001–2007 data please visit, “Spending on Cell Phone Services Has Exceeded Spending on Residential Phone Services,” Consumer Expenditure Survey (U.S. Labor Bureau of Statistics, January 14, 2009), https://www.bls.gov/cex/cellphones2007.htm.
[2]Brett Creech, “Spending on Telephone Services,” Consumer Expenditure Anthology, 2008 (U.S. Bureau of Labor Statistics, September 2008), pp. 74–77, https://www.bls.gov/cex/anthology08/csxanth9.pdf.
[3]The reference person is the first household member mentioned by the CE respondent when asked to “Start with the name of the person, or one of the persons, who owns or rents the home.” It is with respect to this person that the relationship of the other consumer unit members is determined. For more information, see BLS Handbook of Methods, Chapter 16,” Consumer Expenditures and Income,” https://www.bls.gov/opub/hom/pdf/homch16.pdf.
[4]For more details on income quintiles, see “Table 1101. Quintiles of income before taxes: Annual expenditure means, shares, standard errors, and coefficients of variation, Consumer Expenditure Survey, 2014,” September 2015, https://www.bls.gov/cex/2014/combined/quintile.pdf.
[5]See table 3600, Consumer units of one person by age of reference person: Average annual expenditures and characteristics, Consumer Expenditure Survey, 2013–2014, https://www.bls.gov/cex/2014/CrossTabs/sizbyage/aone.pdf.
Publish Date: Wednesday, February 3, 2016