
An official website of the United States government
An official website of the United States government
The .gov means it's official.
Federal government websites often end in .gov or .mil. Before sharing sensitive information,
make sure you're on a federal government site.
The site is secure.
The
https:// ensures that you are connecting to the official website and that any
information you provide is encrypted and transmitted securely.

More BLS articles and information related to consumer spending are available at the following links:
Household spending increases to $51,442 in 2012, surpassing prerecession levels
Retirement expenditures for Whites, Blacks, and persons of Hispanic origin
Household spending data can offer great insight on how households choose and prioritize their wants and needs. In addition, changes in the household spending market basket help to determine Social Security’s general benefit increases, based on cost of living, as measured by the Consumer Price Index.1 Moreover, such information is widely used by policymakers and researchers to study the impact of inflation and government economic policy.2
Data from the U.S. Bureau of Labor Statistics (BLS) Consumer Expenditure (CE) Survey provide information on annual household spending. From these aggregated data, analysts, in government, business, labor, and academia, can generalize about consumer behavior in the U.S. population. However, looking at demographic subgroups of the population can give us a deeper understanding of consumption preferences and spending behavior for a particular group. Using data from the CE Survey, this article looks at the household spending and the income distribution of all Black households.3 It then compares and contrasts the spending patterns of low-income Black households to their high-income counterparts. Findings show that the average amount of pretax income for Black households is about 70 percent of the national average. In addition, the analysis based on income shows that tobacco and smoking supplies were the only expenditure category in which high-income Black households did not outspend low-income Black households.
Blacks, not including those of more than one race, made up 13.1 percent of the total United States population, with over 39 million people.4 The CE provides data on both large and small purchases by American households. This article is based on data from the Consumer Expenditure Quarterly Interview survey using data from 2010, 2011, and 2012.5 The sample used in this study is composed of 11,000 interviews in which reference persons self-identified their race as Black.6 This article analyzed the income distribution and spending patterns of all the Black households identified in the data. This sample was then partitioned based upon the 20th and 80th percentiles of Black households’ income before taxes to make comparisons between high and low income groups.
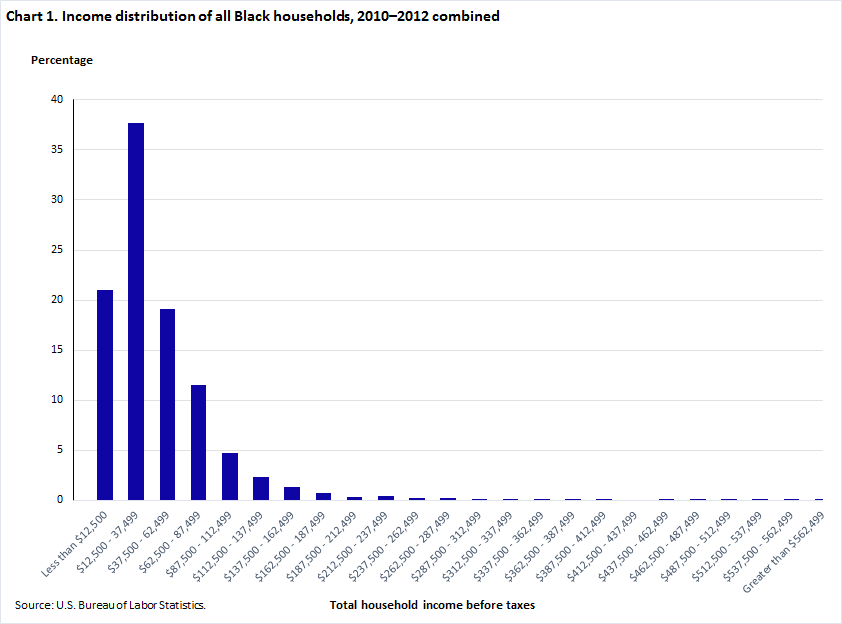
Based on CE data, combined from 2010 to 2012, the average pretax income for the total U.S. population was $63,935, annually.7 However, Black households within the same reference period reported average pretax income of $45,287. The distribution of Black household pretax income is skewed; most households sampled are on the lower end of the income continuum. In fact, more than 35 percent of Black households’ pretax income fall between $12,500 and $37,499. (See chart 1.)
| Total household income | Percentage of Black households |
|---|---|
| Less than $12,500 | 21.01 |
| $12,500 - 37,499 | 37.67 |
| $37,500 - 62,499 | 19.13 |
| $62,500 - 87,499 | 11.47 |
| $87,500 - 112,499 | 4.73 |
| $112,500 - 137,499 | 2.3 |
| $137,500 - 162,499 | 1.33 |
| $162,500 - 187,499 | 0.73 |
| $187,500 - 212,499 | 0.34 |
| $212,500 - 237,499 | 0.4 |
| $237,500 - 262,499 | 0.18 |
| $262,500 - 287,499 | 0.22 |
| $287,500 - 312,499 | 0.13 |
| $312,500 - 337,499 | 0.08 |
| $337,500 - 362,499 | 0.06 |
| $362,500 - 387,499 | 0.05 |
| $387,500 - 412,499 | 0.03 |
| $412,500 - 437,499 | 0 |
| $437,500 - 462,499 | 0.05 |
| $462,500 - 487,499 | 0.01 |
| $487,500 - 512,499 | 0.04 |
| $512,500 - 537,499 | 0.03 |
| $537,500 - 562,499 | 0.02 |
| Greater than $562,499 | 0.02 |
The average Black household contains 2.57 persons. In addition, Black households averaged 1.25 owned vehicles. Most of these households were renters, living in apartments or flats.8 Their dwellings averaged 5.45 rooms (including finished living areas and excluding all baths) and 1.49 bathrooms. Black households’ annual expenditures averaged $36,149, which was 79.8 percent of their average income before taxes. The amount spent on housing ($13,530) consumed the biggest portion of annual expenditures, accounting for more than one-third of the total. This was followed by transportation ($5,946) and food ($5,825). The remaining expenditures made up roughly 30 percent of total spending: personal insurance and pensions, healthcare, entertainment, cash contributions, apparel, and education, in addition to personal care, tobacco, alcohol, reading, and miscellaneous expenditures. (See chart 2.)
| Category | Expenditures | Percentage |
|---|---|---|
| Total annual expenditures | $36,149.00 | … |
| Total food | $5,825.34 | 16.1% |
| Alcoholic beverages | $168.09 | 0.5% |
| Housing | $13,529.96 | 37.4% |
| Apparel and services | $1,000.48 | 2.8% |
| Transportation | $5,945.94 | 16.4% |
| Healthcare | $1,794.27 | 5.0% |
| Entertainment | $1,362.24 | 3.8% |
| Personal care | $318.71 | 0.9% |
| Reading | $45.22 | 0.1% |
| Education | $503.25 | 1.4% |
| Tobacco and smoking supplies | $239.06 | 0.7% |
| Miscellaneous expenditure | $390.37 | 1.1% |
| Cash contributions | $1,347.50 | 3.7% |
| Personal insurance and pensions | $3,678.55 | 10.2% |
Before comparing low-income and high-income Black households, these groups needed to be defined. In the sample, the lowest 20th percentile contained approximately 2,200 Black households that made less than $12,001 in pretax income per year from all sources of income. This coincided with the poverty threshold for one person under the age of 65 ($11,945).9 This lowest quintile group will be referred to as the “low-income” Black households.
The highest 20th percentile is made up of roughly 2,200 Black households that made more than $66,549 in pretax income per year from all sources of income. Their mean income was roughly $112,000. Comparatively, the highest 20th percentile of the national sample in the same period had a lower bound of approximately $94,000 and a mean income of approximately $162,000.10 Nonetheless, the Black households with income greater than or equal to $66,550 are the highest quintile group in their sample, and will be referred to as the “high-income” Black households.
Low-income Black households in the sample averaged $6,342 in pretax income, compared with an average $112,307 in pretax income for high-income Black households.11 Among Black households, the average age of the reference person (47 years) did not differ significantly in the low- and high-income Black households. However, the size of the family differed by approximately 1.4 persons. The low-income Black households contained 1.9 persons on average, and the high-income Black households averaged 3.3 persons. In addition, high-income Blacks owned 2.1 vehicles versus 0.5 vehicles for the low-income Black households. Moreover, most low-income Blacks rented their living quarters. In contrast, high-income Blacks tended to own a single family detached home, with an average 2.3 more rooms and a mortgage.12 (See table 1.)
| Category | Pretax income | Age of reference person | Family size | Number of vehicles | Number of bathrooms in unit | Number of rooms in unit |
|---|---|---|---|---|---|---|
| All United States (1) | 63,934.98 | 49.7 | 2.5 | 1.9 | (2) | n.a. |
| All U.S. Black households | $45,286.80 | 47.4 | 2.6 | 1.3 | 1.5 | 5.5 |
| High-income Black households | $112,306.56 | 46.5 | 3.3 | 2.1 | 1.9 | 6.9 |
| Low-income Black households | $6,342.43 | 47.3 | 1.9 | 0.5 | 1.2 | 4.6 |
| (1) The All U.S.-household tabulations were approximated as the average for the 3-year average for the 3 years, weighted by their respective proportional populations. (2) Statistics on average number of rooms and bathrooms not listed on publication tables. Source: U.S. Bureau of Labor Statistics. | ||||||
Here are highlights of the spending patterns of low-income versus high-income Black households:

| Category | High-income Black households | Low-income Black households |
|---|---|---|
| Tobacco and smoking supplies | 0.3% | 1% |
| Housing | 34.2% | 46% |
| Total food | 12.7% | 24% |
| Transportation | 17.1% | 12% |
| Personal insurance and pensions | 15.0% | 2% |
| Cash contributions | 4.6% | 2% |
| Healthcare | 4.8% | 4% |
| Apparel and services | 2.8% | 3% |
| Education | 2.0% | 1% |
| Entertainment | 3.7% | 4% |
| Personal care | 1.0% | 1% |
| Reading | 0.1% | 0% |
| Alcoholic beverages | 0.5% | 1% |
| Miscellaneous expenditure | 1.1% | 1% |
| Total annual expenditures | … | … |
For low-income Black households, the top five aggregate expenditure share categories were housing (45.5 percent), total food (23.5 percent), transportation (11.5 percent), healthcare (4.1 percent), and entertainment (3.8 percent). In comparison, the top five aggregate expenditure share categories for high-income Black households were housing (34.2 percent), transportation (17.1 percent), personal insurance and pensions (15.0 percent), total food (12.7 percent), and healthcare (4.8 percent).
In terms of dollars spent, high-income Black households spend about three times as much on housing and twice as much on food when compared with low-income Black households. In addition, high-income Black households spend approximately six times as much on transportation, five times as much on healthcare, and four times as much on entertainment than their low-income counterparts. Personal insurance and pensions displayed the biggest contrast, with high-income Black households spending more than 30 times as much as the low-income Black households. (See table 2.)
| Category | All Black households | High-income Black households | Low-income Black households |
|---|---|---|---|
| Total average annual expenditures | $36,148.98 | $67,114.17 | $16,627.29 |
| Tobacco and smoking supplies | $239.06 | $218.26 | $248.34 |
| Housing | $13,529.96 | $22,956.40 | $7,569.19 |
| Total food | $5,825.34 | $8,514.41 | $3,910.12 |
| Transportation | $5,945.94 | $11,469.17 | $1,915.35 |
| Personal insurance and pensions | $3,678.55 | $10,043.75 | $315.33 |
| Cash contributions | $1,347.50 | $3,081.13 | $349.31 |
| Healthcare | $1,794.27 | $3,240.21 | $689.57 |
| Apparel and services | $1,000.48 | $1,907.43 | $474.05 |
| Education | $503.25 | $1,354.23 | $190.31 |
| Entertainment | $1,362.24 | $2,485.95 | $635.57 |
| Personal care | $318.71 | $645.89 | $117.30 |
| Reading | $45.22 | $97.22 | $12.86 |
| Alcoholic beverages | $168.09 | $329.53 | $95.40 |
| Miscellaneous expenditure | $390.37 | $770.58 | $104.60 |
In conclusion, the data supports the fact that Black households’ pretax income is substantially lower than the national average. When comparing low-income and high-income Black households, the larger expenditure categories showed substantial differences in the expenditure share, with personal insurance and pensions displaying the biggest contrast. There were many similar spending patterns, however, when it came to shares allocated to the smaller expenditure categories. Moreover, in terms of nominal dollars spent, high-income Black households outspent low-income Black households in almost every category. The only category which low-income Black households were not outspent was tobacco and smoking supplies. This particular statistic supports the phenomenon that tobacco tends to be a higher share of total expenditures for those with lower income as compared to those with higher income.14 Nevertheless, household spending data can tell stories about the population; when analyzed from income, race, or any other demographic characteristics, the data can tell us a bit more.
This Beyond the Numbers article was prepared by Reginald A. Noël, economist in the Office of Prices and Living Conditions, U.S. Bureau of Labor Statistics. Email: noel.reginald@bls.gov. Telephone: (202) 691-5135.
Information in this article will be made available to sensory-impaired individuals upon request. Voice phone: (202) 691-5200. Federal Relay Service: 1-800-877-8339. This article is in the public domain and may be reproduced without permission.
Reginald A. Noël, “Income and spending patterns among Black households ,” Beyond the Numbers: Prices & Spending, vol. 3 / no. 24 (U.S. Bureau of Labor Statistics, November 2014), https://www.bls.gov/opub/btn/volume-3/income-and-spending-patterns-among-black-households.htm
1 “Cost-Of-Living Adjustment (COLA)” http://www.ssa.gov/OACT/cola/colasummary.html.
2 “Frequently Asked Questions (FAQs): Question: How is the Consumer Price Index (CPI) used?” https://www.bls.gov/cpi/questions-and-answers.htm#Question_5.
3 The Black population is defined by people who indicated in the CE survey that they are “Black or African American.” This includes people who are Sub-Saharan African (e.g., Kenyan and Nigerian) or Afro-Caribbean (such as Haitian and Jamaican).
4 “Black or African American Populations” http://www.cdc.gov/minorityhealth/populations/remp/Black.html.
5 In 2012, the CE survey changed the way that nonrespondents were assigned to a race category by using the racial proportions observed in the latest Decennial Census instead of CE respondents for the probabilities; using racial proportions at the county level instead of at the regional level; and adding tenure information to the county-level proportions. Source: https://www.bls.gov/osmr/research-papers/2013/st130230.htm.
6 Households in which the reference person identified as mixed-race were not included. Also, note that although the reference person has identified as Black, it is possible that spouse, children, and other family members can be of a different or additional race.
7 Table 2100. Race of reference person: Annual expenditure means, shares, standard errors, and coefficient of variation, Consumer Expenditure Survey, 2012. https://www.bls.gov/cex/2012/combined/race.pdf.
Also see Table 2100. Race of reference person: annual means, standard errors and coefficient of variation, Consumer Expenditure Survey, 2011. https://www.bls.gov/cex/2011/stnderror/race.pdf.
See also Table 2100. Race of reference person: annual means, standard errors and coefficient of variation, Consumer Expenditure Survey, 2010. https://www.bls.gov/cex/2010/stnderror/race.pdf.
8 This also includes a unit that could be located in the basement, attic, second floor, or over the garage of a single-family detached unit. Interview Data Dictionary, P77. August 30, 2013.
9 Poverty thresholds for 2012 by size of family and number of related children under 18 years: U.S. Census Bureau.
10 Lower bounds and means for the All United States-household tabulations were approximated as the average for the 3 years, weighted by their respective proportional populations. Sources: Table 1101. Quintiles of income before taxes: Annual expenditure means, shares, standard errors, and coefficient of variation, Consumer Expenditure Survey, 2012. https://www.bls.gov/cex/2012/combined/quintile.pdf.
Also see Table 1101. Quintiles of income before taxes: annual means, standard errors and coefficient of variation, Consumer Expenditure Survey, 2011 https://www.bls.gov/cex/2011/stnderror/quintile.pdf.
See also Table 1101. Quintiles of income before taxes: annual means, standard errors and coefficient of variation, Consumer Expenditure Survey, 2010 https://www.bls.gov/cex/2010/stnderror/quintile.pdf.
11 All of the dollar comparisons between the low-income and high-income Black households in the sample were statistically significant except for the difference in the Tobacco and smoking supplies expenditures.
12 A detached home is defined as a structure with only one primary residence; however, the structure could include a rental unit(s) in the basement, attic, etc.) Interview Data Dictionary. P77. August 30, 2013.
13 The difference in these real values is not statistically significant.
14 Based on an article from the World Health Organization, the poor spend a larger proportion of their income on tobacco than do richer households.“Tobacco and Poverty: A Vicious Circle” http://www.who.int/tobacco/communications/events/wntd/2004/en/wntd2004_brochure_en.pdf.
Publish Date: Wednesday, November 05, 2014