
An official website of the United States government
An official website of the United States government
The .gov means it's official.
Federal government websites often end in .gov or .mil. Before sharing sensitive information,
make sure you're on a federal government site.
The site is secure.
The
https:// ensures that you are connecting to the official website and that any
information you provide is encrypted and transmitted securely.
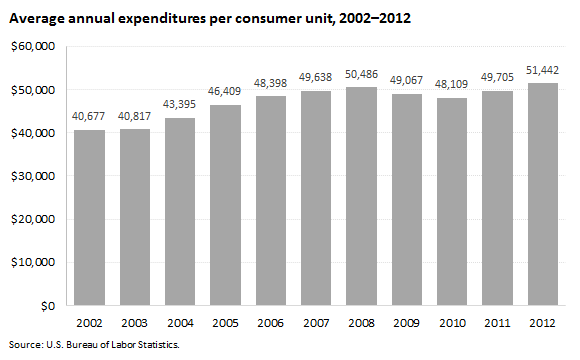
Average expenditures per consumer unit in 2012 were $51,442, an increase of 3.5 percent from 2011 levels. The 2012 level surpassed the spending peak recorded in 2008, after which the effects of the 2007–2009 recession led to a low of $48,109 in 2010.
| Year | Expenditures |
|---|---|
2002 | $40,677 |
2003 | 40,817 |
2004 | 43,395 |
2005 | 46,409 |
2006 | 48,398 |
2007 | 49,638 |
2008 | 50,486 |
2009 | 49,067 |
2010 | 48,109 |
2011 | 49,705 |
2012 | 51,442 |
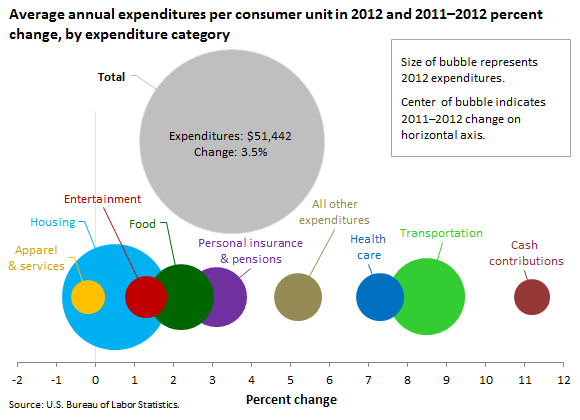
Since overall expenditures began to increase again in 2011, cash contributions, transportation, and health care have had the largest percentage increases of all the major expenditure items. All but one of the other major components of household spending also increased in 2012, with apparel and services being the lone exception.
| Category | Expenditures | Percent change |
|---|---|---|
Total | $51,442 | 3.5% |
Apparel and services | 1,736 | -0.2 |
Housing | 16,887 | 0.5 |
Entertainment | 2,605 | 1.3 |
Food | 6,599 | 2.2 |
Personal insurance and pensions | 5,591 | 3.1 |
Health care | 3,556 | 7.3 |
Transportation | 8,998 | 8.5 |
Cash contributions | 1,913 | 11.2 |
All other expenditures | 3,557 | 5.2 |
The 11.2-percent rise in cash contributions (which includes payments for support of college students, alimony and child support, and giving to charities and religious organizations) was the largest percentage increase among all major components; average cash contributions totaled $1,913 in 2012. The increase in cash contributions since 2011 can largely be attributed to an increase in cash contributions to churches and religious organizations.
Overall spending on transportation ($8,998) and health care ($3,556) rose significantly (+8.5 percent and +7.3 percent, respectively) in 2012, while spending on housing ($16,887) and entertainment ($2,605) only increased modestly (+0.5 percent and +1.3 percent, respectively).
Expenditures on food increased 2.2 percent (to $6,599), while spending on personal insurance and pensions increased 3.1 percent increase (to $5,591).
These data come from the Consumer Expenditure Survey. To learn more, see "Consumer Expenditures — 2012" (HTML) (PDF), news release USDL-13-1833. Consumer units include families, single persons living alone or sharing a household with others but who are financially independent, or two or more persons living together who share expenses.
Bureau of Labor Statistics, U.S. Department of Labor, The Economics Daily, Household spending increases to $51,442 in 2012, surpassing prerecession levels at https://www.bls.gov/opub/ted/2013/ted_20130912.htm (visited August 02, 2026).
