An official website of the United States government
 United States Department of Labor
The Bureau of Labor Statistics (BLS) National Compensation Survey (NCS) is the key source of data on the pay and benefits of workers in the United States. The NCS uses data on employer costs for a variety of compensation components to produce the Employer Cost Index (ECI) and Employer Cost of Employee Compensation (ECEC) on a quarterly basis. The ECI provides an index of changes in the employer’s cost of wages and compensation from the prior quarter and prior year. The ECEC provides estimates of wages and salaries as well as average cost of benefits per hour worked, shown in dollars and cents. On an annual basis, the NCS produces information on the availability of a suite of benefits, including health, retirement, insurance, and leave as part of the Employee Benefits Survey (EBS).
This Beyond the Numbers article examines pay and benefits by job level to provide additional context to the nature of compensation among private sector workers in the United States.
BLS staff collect NCS data from a sample of establishments, designed to yield nationally representative estimates by industry, geography, private sector, and state and local government.1 BLS staff also collect job characteristics information—such as, collective bargaining agreement coverage, full- or part-time work; and time- or incentive-based pay—from a sample of jobs within an establishment. In addition, for each job, BLS staff perform a “leveling” analysis, which assesses the work duties of the job across four factors: knowledge, job controls and complexity, contacts, and physical environment. Points are allocated across the four factors totaled, and used to assign a level to each job, ranging from 1 (the most simple jobs) to 15 (complex jobs requiring high levels of knowledge).2
The job levels are used by the President’s Pay Agent to evaluate the pay for federal workers, though they also provide a useful metric for understanding pay and benefits in jobs.3
Tabular output for the NCS presents estimates of pay and benefits by job characteristics of the civilian workforce (for example, union or nonunion status and full-time or part-time work) and by broad occupation and industry groups. It is not possible to produce estimates of pay and benefits for detailed occupations because of the relatively limited sample size of the NCS. The estimates by broad occupational grouping can be important for understanding pay and benefits, however these occupational groups contain diverse jobs that may have very different skill requirements. As an example, service workers is an occupational grouping that includes both firefighters and dishwashers. One way of overcoming the aggregation across skill levels inherent in occupational groupings is to provide estimates by job level. This approach aggregates across a more diverse set of occupations, but separates jobs by the knowledge and complexity required to perform the tasks associated with them.
To provide estimates of pay and benefits by job level, we use two of the datasets produced by the NCS—the levels of pay from the ECEC microdata and benefits microdata from the EBS. The microdata used are from the 2016 EBS and the March 2016 ECEC. Although NCS data include state and local government data, we restrict our analysis to the private sector.
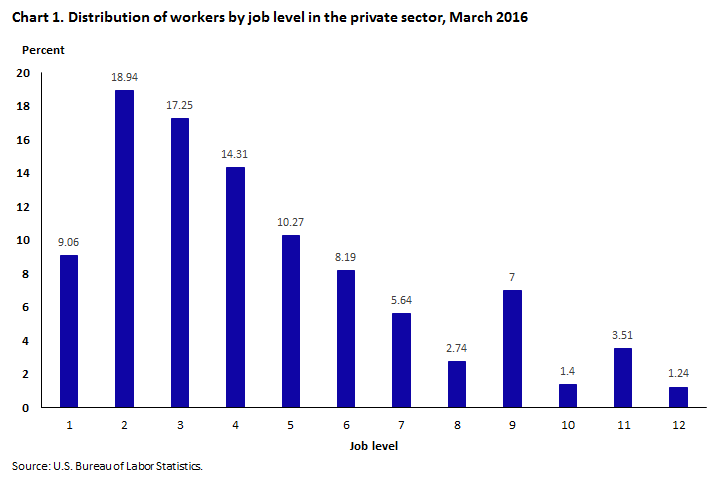
| Level | Quotes | Proportion (in percent) | Standard error |
|---|---|---|---|
| 1 | 1137 | 9.06 | 0.0041 |
| 2 | 2859 | 18.94 | 0.0053 |
| 3 | 3185 | 17.25 | 0.0049 |
| 4 | 3138 | 14.31 | 0.0044 |
| 5 | 2594 | 10.27 | 0.0033 |
| 6 | 2295 | 8.19 | 0.0034 |
| 7 | 1508 | 5.64 | 0.0026 |
| 8 | 880 | 2.74 | 0.0018 |
| 9 | 2006 | 7 | 0.0026 |
| 10 | 539 | 1.4 | 0.001 |
| 11 | 1244 | 3.51 | 0.002 |
| 12 | 516 | 1.24 | 0.0011 |
| 13 | 165 | 0.3 | 0.0004 |
| 14 | 57 | 0.12 | 0.0003 |
| 15 | 12 | 0.028 | 0.00013 |
| Source: U.S. Bureau of Labor Statistics. | |||
Chart 1 presents the distribution of private sector workers among 12 job levels. Occupations that are common (but not necessarily exclusive) to level 1 include cashiers and stock clerks. In level 5, some common occupations include bookkeeping clerks, licensed vocational nurses, and customer service representatives. Registered nurses are associated most commonly with level 9, and among level 12 jobs, one finds software developers, financial managers, and post-secondary teachers. More than two-thirds of workers (69.9 percent) are in levels 1 through 5. Roughly 5 percent of workers are in levels 11 and 12. Although the NCS job leveling scale goes up to level 15, there is not a large share of jobs in the highest levels, so this analysis focuses on levels 1 to 12.
As the knowledge and complexity required in a job rises, average hourly pay also rises.4 (See chart 2.) The average hourly wage for workers in level 1 jobs is $9.16, and this steadily rises with each level, reaching $20.14 a t level 5, $37.44 at level 9, and $74.80 per hour at level 12.
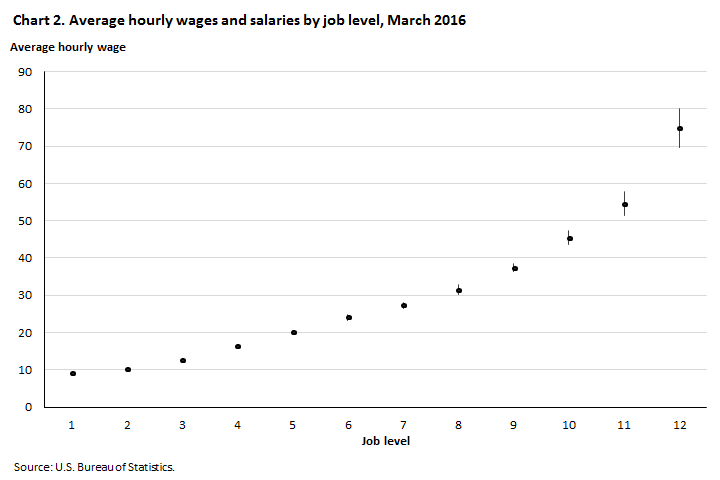
| Confidence interval | Work level | |||||||||||
|---|---|---|---|---|---|---|---|---|---|---|---|---|
| 1 | 2 | 3 | 4 | 5 | 6 | 7 | 8 | 9 | 10 | 11 | 12 | |
| Upper 95% CI | 8.95 | 10.16 | 12.50 | 15.92 | 19.80 | 23.22 | 26.53 | 30.18 | 36.29 | 43.52 | 51.41 | 69.60 |
| Lower 95% CI | 9.38 | 10.52 | 12.94 | 16.63 | 20.49 | 24.97 | 28.09 | 32.83 | 38.58 | 47.29 | 57.70 | 79.99 |
| Mean | 9.16 | 10.34 | 12.72 | 16.28 | 20.14 | 24.09 | 27.31 | 31.51 | 37.44 | 45.41 | 54.56 | 74.80 |
| Source: U.S. Bureau of Labor Statistics. | ||||||||||||
The EBS measures both access to and participation in different types of benefit plans. For the purpose of our analysis, we restrict ourselves to whether the workers in the job have access to the plan, rather than looking at plan participation, as there are many reasons why workers may not participate in a plan (for example, a worker might be covered by their spouse’s insurance plan). We combine access to defined benefit (such as a traditional pension) and defined contribution (such as a 401k) plans in our measure of access to at least one retirement plan.
We next show access to a subset of benefits by job level, beginning with health and retirement. (See charts 3 and 4, respectively.)
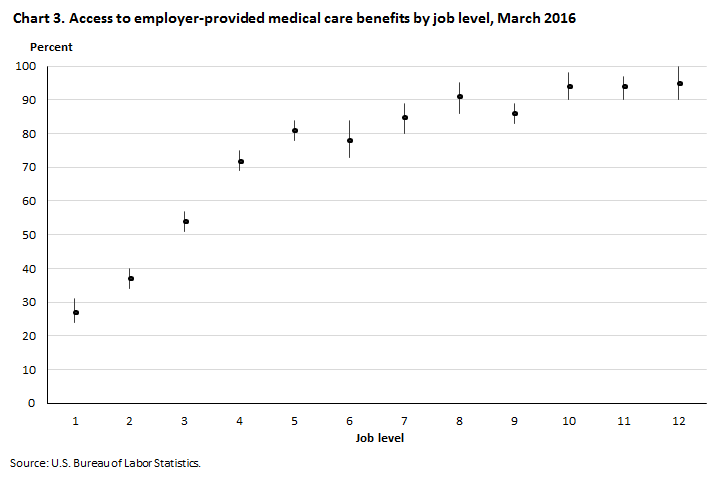
| Confidence interval | Work level | |||||||||||
|---|---|---|---|---|---|---|---|---|---|---|---|---|
| 1 | 2 | 3 | 4 | 5 | 6 | 7 | 8 | 9 | 10 | 11 | 12 | |
| Upper 95% CI | 31 | 40 | 57 | 75 | 84 | 84 | 89 | 95 | 89 | 98 | 97 | 100 |
| Lower 95% CI | 24 | 34 | 51 | 69 | 78 | 73 | 80 | 86 | 83 | 90 | 90 | 90 |
| Mean | 27 | 37 | 54 | 72 | 81 | 78 | 85 | 91 | 86 | 94 | 94 | 95 |
| Source: U.S. Bureau of Labor Statistics. | ||||||||||||
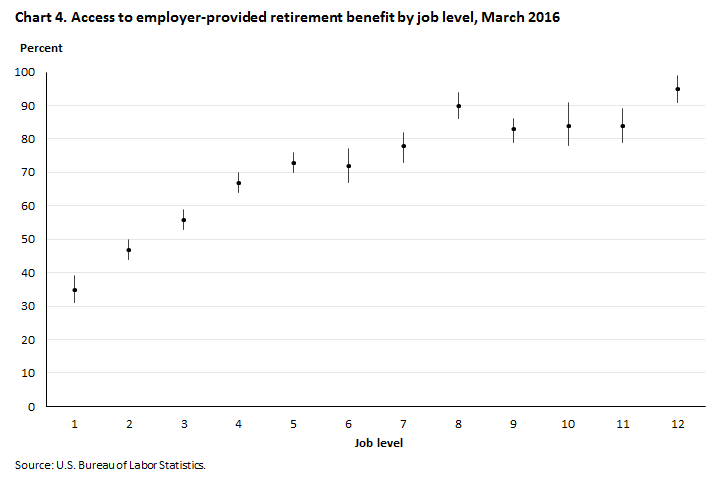
| Confidence interval | Work level | |||||||||||
|---|---|---|---|---|---|---|---|---|---|---|---|---|
| 1 | 2 | 3 | 4 | 5 | 6 | 7 | 8 | 9 | 10 | 11 | 12 | |
| Upper 95% CI | 39 | 50 | 59 | 70 | 76 | 77 | 82 | 94 | 86 | 91 | 89 | 99 |
| Lower 95% CI | 31 | 44 | 53 | 64 | 70 | 67 | 73 | 86 | 79 | 78 | 79 | 91 |
| Mean | 35 | 47 | 56 | 67 | 73 | 72 | 78 | 90 | 83 | 84 | 84 | 95 |
| Source: U.S. Bureau of Labor Statistics. | ||||||||||||
Charts 3 and 4 demonstrate similar patterns in access to medical and retirement benefits by job level. Access to these benefits tends to rise in statistically significant increments until level 5, for which the access numbers flatten out. In both cases, however, workers in level 12 have significantly higher access rates than those in level 5. Ninety-five percent of level 12 workers have access to a medical plan and the same percentage have access to a retirement plan. At the other end of the spectrum, a significantly smaller share of level 1 and 2 workers have access to medical (27 percent and 37 percent, respectively) and retirement benefits (35 percent and 47 percent, respectively).
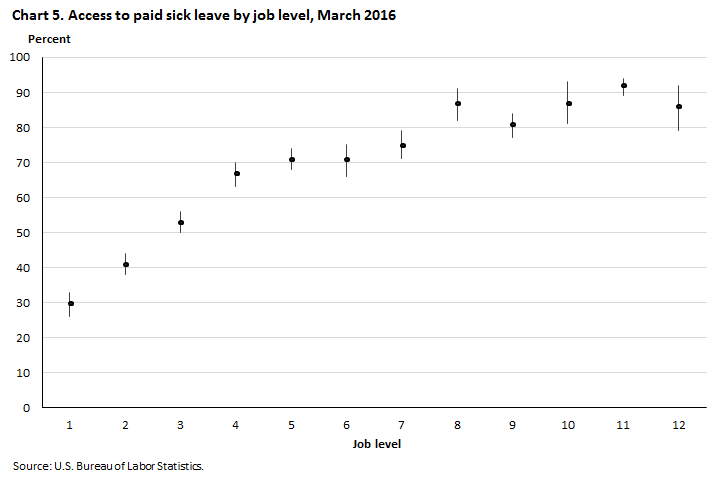
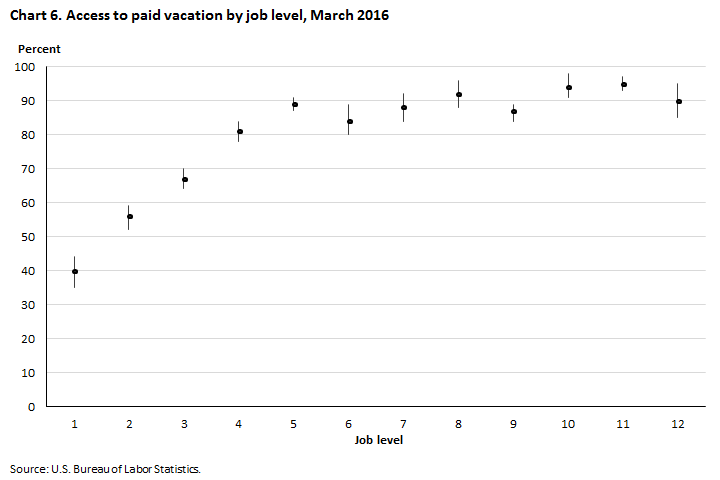
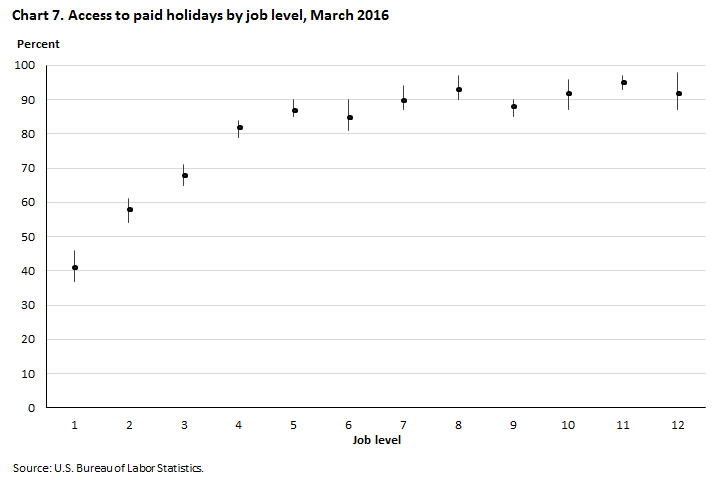
Currently, six states, the District of Columbia and several counties and cities mandate sick leave for workers. A wide swath of the labor force, however, lacks access to paid leave, including sick leave, vacation, and holidays. There is a clear pattern of access to these benefits by job level, as displayed in charts 5, 6, and 7.
| Confidence interval | Work level | |||||||||||
|---|---|---|---|---|---|---|---|---|---|---|---|---|
| 1 | 2 | 3 | 4 | 5 | 6 | 7 | 8 | 9 | 10 | 11 | 12 | |
| Upper 95% CI | 33 | 44 | 56 | 70 | 74 | 75 | 79 | 91 | 84 | 93 | 94 | 92 |
| Lower 95% CI | 26 | 38 | 50 | 63 | 68 | 66 | 71 | 82 | 77 | 81 | 89 | 79 |
| Mean | 30 | 41 | 53 | 67 | 71 | 71 | 75 | 87 | 81 | 87 | 92 | 86 |
| Source: U.S. Bureau of Labor Statistics. | ||||||||||||
A minority of workers in job levels 1 and 2 have access to paid sick leave. Roughly three-quarters of workers in job level 7 have access, and access peaks at levels 8 to 12, with access varying between 81 and 92 percent.
| Confidence interval | Work level | |||||||||||
|---|---|---|---|---|---|---|---|---|---|---|---|---|
| 1 | 2 | 3 | 4 | 5 | 6 | 7 | 8 | 9 | 10 | 11 | 12 | |
| Upper 95% CI | 44 | 59 | 70 | 84 | 91 | 89 | 92 | 96 | 89 | 98 | 97 | 95 |
| Lower 95% CI | 35 | 52 | 64 | 78 | 87 | 80 | 84 | 88 | 84 | 91 | 93 | 85 |
| Mean | 40 | 56 | 67 | 81 | 89 | 84 | 88 | 92 | 87 | 94 | 95 | 90 |
| Source: U.S. Bureau of Labor Statistics. | ||||||||||||
Paid vacation displays a similar pattern to paid sick leave. These access rates increase quickly with job level initially, rising from 40 percent at level 1 to 81 percent at level 4, and then vary between the middle 80s to middle 90s for higher job levels.
| Confidence interval | Work level | |||||||||||
|---|---|---|---|---|---|---|---|---|---|---|---|---|
| 1 | 2 | 3 | 4 | 5 | 6 | 7 | 8 | 9 | 10 | 11 | 12 | |
| Upper 95% CI | 46 | 61 | 71 | 84 | 90 | 90 | 94 | 97 | 90 | 96 | 97 | 98 |
| Lower 95% CI | 37 | 54 | 65 | 79 | 85 | 81 | 87 | 90 | 85 | 87 | 93 | 87 |
| Mean | 41 | 58 | 68 | 82 | 87 | 85 | 90 | 93 | 88 | 92 | 95 | 92 |
| Source: U.S. Bureau of Labor Statistics. | ||||||||||||
Chart 7 displays a pattern of access to paid holidays which is very similar to paid vacation. The majority of workers in job levels 2 through 12 have access to paid holidays, with access varying from 85 percent at level 6 to 95 percent at level 11.
Similar to the rates of access to healthcare and retirement benefits, the rates of access across the three types of paid leave benefits rise steadily from levels 1 to 5 and then flatten out. Sick leave is the least prevalent of the three, with 30 percent of level 1 workers offered paid sick leave, 40 percent offered paid vacation, and 41 percent offered paid holidays. Among level 5 workers, 71 percent have access to sick leave, 89 percent have access to vacation and 87 percent have access to holidays. At higher job levels, however, access to the paid leave programs are statistically similar.
The National Compensation Survey routinely publishes information on pay and benefits by broad occupational groupings, but an alternative way to present these estimates is by job level. Grouping by the knowledge and complexity inherent in the job rather than grouping by the Standard Occupational Classification reveals a clear pattern in the pay and benefits of jobs. Hourly wages and salaries tend to increase steadily with job level, whereas benefit access tends to increase quickly at low job levels and then flatten out at higher job levels. Workers at low-level jobs have low pay and less access to benefits; however, benefit access increases by level in a statistically significant way through level 5 and then tends to fluctuate from levels 5 through 12.
This Beyond the Numbers article was prepared by Kristen Monaco, Associate Commissioner in the Office of Compensation and Working Conditions, Email: monaco.kristen@bls.gov, Telephone: (202) 691-7527.
Information in this article will be made available upon request to individuals with sensory impairments. Voice phone: (202) 691-5200. Federal Relay Service: 1-800-877-8339. This article is in the public domain and may be reproduced without permission.
Kristen Monaco, “How pay and benefits change as job level rises: data from the National Compensation Survey ,” Beyond the Numbers: Pay & Benefits, vol. 6 / no. 8 (U.S. Bureau of Labor Statistics, June 2017), https://www.bls.gov/opub/btn/volume-6/how-pay-and-benefits-change-as-job-level-rises-data-from-the-national-compensation-survey.htm
1 Federal workers are excluded from this calculation. The combination of private and state and local government workers is termed “civilian” workers.
2 For more details on the leveling process, see “National Compensation Survey: Guide for evaluating your firm’s jobs and pay,” May 2013, https://www.bls.gov/ncs/ocs/sp/ncbr0004.pdf.
3 For more information on federal pay setting, see https://www.opm.gov/policy-data-oversight/pay-leave/salaries-wages/fact-sheets/#url=BLS-Data.
4 All figures include weighted point estimates as well as lines representing the 95 percent confidence interval. The standard errors computed for this analysis differ slightly from official Employer Cost of Employee Compensation estimates of standard errors because the full survey design was not incorporated in our calculation.
Publish Date: Friday, June 23, 2017