
An official website of the United States government
An official website of the United States government
The .gov means it's official.
Federal government websites often end in .gov or .mil. Before sharing sensitive information,
make sure you're on a federal government site.
The site is secure.
The
https:// ensures that you are connecting to the official website and that any
information you provide is encrypted and transmitted securely.
This is an archived page. To see the latest version, please visit Quarterly Census of Employment and Wages: History.
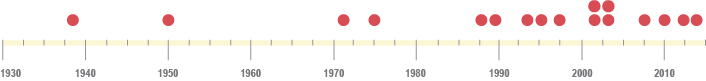
The Quarterly Census of Employment and Wages (QCEW) is an administrative dataset guided by unemployment insurance (UI) coverage laws.1 These laws vary across states. They have evolved over time and continue to do so from state to state and year to year. The following time line presents important events in the history of the QCEW programs:
| Year | Event |
|---|---|
| 1938 | The Federal Unemployment Tax Act (FUTA) becomes effective. Administered by U.S. Department of Labor (DOL) Manpower Administration. |
| 1950 | Employment and Wages is first issued as a semiannual report. |
| 1972 | The Bureau of Labor Statistics (BLS) assumes responsibility for publication of the now quarterly Employment and Wages. |
| 1975 | Employment and Wages becomes an annual publication. |
| 1988–91 | Business Establishment List Improvement project moves from data collection on a reporting unit basis to a worksite basis. |
| 1989 | States begin providing data to the Quarterly Census of Employment and Wages (QCEW) at the business establishment level. |
| 1994–97 | The Microdata/Macrodata (MIC/MAC) project creates a single file that combines the microdata and macrodata. |
| 1995 | The Electronic Data Interchange (EDI) Collection Center is established. |
| 1997 | The North American Industry Classification System (NAICS) is developed to replace the Standard Industrial Classification (SIC) system. |
| 2002 | QCEW data are published under NAICS 2002 codes. |
| 2002 | QCEW program begins publishing data quarterly. |
| 2003 | The Business Employment Dynamics (BED) program publishes first quarterly release using QCEW establishment data. |
| 2003 | BLS begins releasing fully detailed industry data at the county, Metropolitan Statistical Area (MSA), state, and national levels. |
| 2007 | QCEW data are published under revised NAICS 2007 codes. |
| 2010 | Last printed edition of Employment and Wages, Annual Averages is published. |
| 2012 | QCEW data are published under revised NAICS 2012 codes. |
| 2014 | QCEW data are made available publicly as an open data product. |
The QCEW program was initially named Employment Security Report 202, after the form on which data were collected. In 1998, to give some context to what the program produced, the name was changed to Covered Employment and Wages (CEW). The program became known as the Quarterly Census of Employment and Wages in 2002, to describe the mission more accurately.
The Standard Industrial Classification system (SIC) was used by the QCEW program to code establishments by industry until the fall of 2002, when the North American Industry Classification System (NAICS) was utilized in the publication of 2001 data.
In the late 1970s and early 1980s, special extracts and aggregations were provided via mainframe computer tape and, later, on floppy disks. Alternatively, special print tables were produced with the information, as requested by customers. Data were subject to basic disclosure limitation procedures.
Following the early 1980s and into the late 1990s, a similar pattern occurred, but with more sophisticated disclosure limitation procedures. Some data requests were filled via CD, while more complicated requests required that BLS be reimbursed. During this timeframe, QCEW established subscription agreements with some of the larger private data companies. These companies would get updated files when they were available. Although data were scheduled to be released quarterly, they were actually released irregularly. On occasion, there were delays that pushed back file creation until more than one added quarter of data could be released at once.
From the late 1990s forward, requests that required reimbursement slowed and then ceased. More sophisticated disclosure limitation procedures were used. Early online tools offered annual average data for 1997 forward. In the early 2000s, a small number of downloadable files were posted on the BLS File Transfer Protocol site.
In 2014, QCEW data were made available as an open data product via comma-separated values (CSV) files on the program’s web page. Open data, as described in OMB memorandum M-13-13 (PDF), refers to publicly available data structured in a way that enables the data to be fully discoverable and usable by end users. The CSV files are designed to allow third-party programmers, developers, and organizations to retrieve published QCEW data in CSV format. QCEW CSV files are organized by industry, by area, and by establishment size class.
The QCEW program has undertaken several major projects in its brief history.
Business Establishment List. The Business Establishment List (BEL) Improvement project was initiated to obtain information on multiple-establishment employers on a quarterly basis. Under the project, the collection of data on employment and wages for multiple-establishment employers was changed from a reporting unit (county or industry total) basis to an individual worksite (establishment) basis. As part of this change, the size criterion used to define multiple-establishment employers was lowered to include smaller employers. As a result, both the number of establishments and the number of multiple-establishment employers increased. The State Statistical Supplement forms that were previously used to collect county and industry summary-level data on multiple-establishment employers were replaced by the Multiple Worksite Report (MWR), a standardized form for use in all states.
The project began in late 1988, using the Annual Refiling Survey (ARS). The survey obtained worksite identification information for existing multiple-establishment employers and identified those multiple-establishment employers which were previously categorized as single-unit employers. To capture ARS physical location address information for single-unit employers, the SIC Refiling Control System (SRCS) was modified in mid-1988 and the new version was provided to the states. The new, standardized MWR received OMB clearance and was mandated for state use beginning with data for the first quarter of 1991. (Note that, although state use of the form was mandatory, depending on state UI laws, it was not mandatory that all employers in the state use the form.) The MWR was intended to collect quarterly information on employment and wages from multiple-establishment employers.
MWR. The MWR was a major component of the BEL improvement project launched in 1989. The BEL moved the BLS sampling frame from a reporting-unit to an establishment basis. The Longitudinal Data Base was established and later became part of the popular Business Employment Dynamics (BED) program. As mentioned earlier, the MWR replaced State Statistical Supplement forms. Several states had already collected establishment-level data, and their forms served as a model for the MWR. The initial quarter during which MWR establishment-level data were collected was the first quarter of 1991. The MWR enabled the QCEW program to be the first in BLS to develop a standardized magnetic-media reporting format. The MWR was implemented in September 1992, 3 years prior to the opening of the Electronic Data Interchange (EDI) Collection Center in Chicago.
In 1995, BLS established the EDI Collection Center to improve and to expedite the MWR collection process. Employers who complete the MWR for multiple-location businesses submit information on employment and wages via an electronic medium directly to the collection center, instead of submitting separate forms or files to each individual state agency. The collection center then edits the employers’ data and forwards the data to the appropriate state agency. The EDI Collection Center is geared toward firms that meet certain size thresholds.
Electronic and web-based filing has reduced costs considerably for large and midsized employers. MWR web data collection started with data for the first quarter of 2007. The MWR electronic-reporting format is now routinely included in the products of prominent payroll- and tax-reporting software developers. Since 2012, BLS has successfully worked with a contractor to print, mail, receive and scan returned MWR forms to state agencies, substantially reducing their workloads.
It is useful to examine some recent statistics regarding overall MWR data collection. In that regard, the numbers in the following tabulation, for the fourth quarter of 2014, exhibit a stable pattern that has come to be seen as the usual pattern for MWR statistics:
| Fourth quarter 2014 (initial enhanced quarterly Unemployment Insurance file) | Number or percentage of employers |
|---|---|
| Percentage of employers filing the MWR | 1.42 |
| Percentage of national worksites | 17.35 |
| Percentage of national employment | 41.03 |
As the table shows, approximately 1.4 percent of employers completed the MWR for about 17 percent of national worksites and more than 41 percent of national employment. Moreover, nearly 49 percent of all MWR employment came electronically, from either the EDI Center or MWRweb. Of this 49 percent, the EDI Center collected 20 percent of total MWR employment while MWRweb accounted for almost 29 percent.
Microdata/Macrodata (MIC/MAC) Project. Prior to 1989, states submitted only an enhanced file containing macrolevel employment and wage data. That meant that the highest level of detail received by the QCEW program was aggregate data cells made up of a combination of industry, county, and ownership codes.
In the first quarter of 1989, states began delivering a quarterly microdata file that included individual business establishment data. At the time, states were submitting nine separate deliverables per year: four quarterly microdata files, four quarterly macrodata files, and the annual Control File, providing Code Change Supplement data.
Development of the MIC/MAC project began in 1994. Teams consisting of BLS staff from both the national office and regional offices, as well as state staff members, were established to define the new processing requirements and deliverable standards. State and BLS systems were updated to reflect these major operational changes. The mission was to create a single quarterly file that would make possible the creation of macrolevel totals from the microdata. The project would promote more efficiency by eliminating duplication of work in reviewing and correcting the micro- and macrodata files. The project would also create uniformity in the micro- and macrolevel totals, as well as in the editing standards for the states and BLS. The first MIC/MAC files were submitted to BLS in the third quarter of 1997, providing for a more efficient work process and producing higher quality data.
SIC-to-NAICS conversion. The SIC system was established in the 1930s in order to classify establishments by their primary type of activity. The system was updated multiple times in its history of being utilized by the QCEW (formerly, ES-202) program; significant changes were made in 1967, 1972, and 1987. In July 1992, the Office of Management and Budget (OMB) established the Economic Classification Policy Committee, chaired by the Bureau of Economic Analysis (BEA) of the U.S. Department of Commerce, with representatives from the U.S. Bureau of the Census (now the U.S. Census Bureau) of the U.S. Department of Commerce and from BLS. The OMB charged the committee with conducting a “fresh slate” examination of economic classifications for statistical purposes and determining the desirability of developing a new industry classification system for the United States that would be based on a single economic concept. In 1997, NAICS was introduced, the product of a cooperative effort on the part of the official statistical agencies of the United States, Canada, and Mexico.
In the fall of 2002, the QCEW program published its 2001 data using NAICS 2002 classified industry data for the first time. Over several years prior to that milestone, state agencies had worked to convert more than 8 million establishments to NAICS. Along with the initial 1997 version of NAICS and the 2002 update, versions were released in 2007 and 2012 also, to reflect changes to the economy.
One of the major changes to industry coding that was introduced by NAICS was the sector called information (NAICS 51), which includes establishments producing and distributing information and cultural products, establishments providing the means to transmit or distribute these products, and establishments providing data or communications services, including data processing. Another new sector introduced by NAICS was management of companies and enterprises (NAICS 55).
The BLS conversion to NAICS was notable for its detail. An example may be seen in the construction (NAICS 23) sector. Within the specialty trade contractors (NAICS 238) subsector in the BLS implementation of NAICS, each base group in specialty trade contractors—for example, masonry contractors (NAICS 23814) or roofing contractors (NAICS 23816)—is further divided, on the basis of whether the establishment’s predominant activity is in residential construction or nonresidential construction.2
Early BEA finance data. BEA is responsible for producing quarterly estimates of gross domestic product (GDP) and personal income (PI). A key component of the GDP and PI numbers is data on wages, from the QCEW program. Prior to 2008, BEA had difficulty estimating wages in a number of industries. The most difficult industry was finance (NAICS 52), because wage levels for that industry are greatly affected by irregular payments (for example, bonuses and stock options). These irregular payments are usually made in either the fourth or first quarter. In 2008, at BEA’s request, BLS agreed to deliver first-quarter macrodata earlier than is customary, in order to enable BEA to adjust its estimates by means of QCEW total wage levels.
In early July of 2008, the 10 states with the largest proportion of national aggregate wages in the finance industry participated in a pilot test of accelerated macrodata delivery to BEA. The early-delivery pilot proved to be highly successful with major national users, such as the U.S. Department of the Treasury and the Council of Economic Advisers, which noted a decrease in revisions. On the basis of this success, BEA asked the QCEW program to provide early macrodata as a deliverable each first quarter, beginning with the first quarter of 2009. The BEA wage estimates that are being improved with QCEW data are national, not state, metro, or local, estimates.
The Business Employment Dynamics (BED) program uses QCEW establishment data to produce a quarterly series of gross job gains and gross job losses for the entire economy. The program published its first release in 2003. The data covered the period from 1992 through 2002, with subsequent quarterly updates published since then. (For more on BED, see “Business Employment Dynamics” in the BLS Handbook of Methods.