
An official website of the United States government
An official website of the United States government
The .gov means it's official.
Federal government websites often end in .gov or .mil. Before sharing sensitive information,
make sure you're on a federal government site.
The site is secure.
The
https:// ensures that you are connecting to the official website and that any
information you provide is encrypted and transmitted securely.

Crossref 0
How Are SNAP Benefits Spent? Evidence from a Retail Panel, American Economic Review, 2018.
How Does the Supplemental Nutrition Assistance Program Affect the U.S. Economy?, Agricultural and Resource Economics Review, 2015.
How are SNAP Benefits Spent? Evidence from a Retail Panel, SSRN Electronic Journal , 2018.
Eat (and Drink) Better Tonight: Food Stamp Benefit Timing and Drunk Driving Fatalities, SSRN Electronic Journal, 2015.
Using Consumer Expenditure Survey data for the period 2004–2010, this article examines spending on food by Supplemental Nutrition Assistance Program (SNAP) participants, whether this spending changed over time, whether participants spent more on food than did program nonparticipants, and whether spending on nonfood goods and services differed between participants and nonparticipants. The article found that spending on food at home increased since 2006 by a greater amount for SNAP participants than it did for eligible nonparticipants, with participants’ spending eventually surpassing nonparticipants’ spending by 2010. As the largest share of total spending, housing expenditures increased steadily for both participants and nonparticipants, with SNAP participants spending amounts similar to those spent by eligible nonparticipants.
As the largest federal nutrition assistance program, the Supplemental Nutrition Assistance Program (SNAP) ensures that low-income Americans have adequate access to food by providing them with an in-kind benefit to be spent on food each month. With nearly 44.5 million individuals participating in SNAP in an average month in fiscal year 2011 and with $71.8 billion spent on benefits in fiscal year 2011, it is important to assess how much SNAP participants spend on food each month, whether this spending amount has changed over time, and whether SNAP participants spend more on food than do nonparticipants.1
The amount a household spends on food is not decided in isolation, but as part of a decision how to best allocate resources (income) across various goods and services, including rent or mortgage payments; utilities bills, such as electric and telephone services; transportation; and education. Although extensive research has been conducted on how households distribute their resources across broad groups of goods and services,2 little research has focused on how these distributions differ across groups of low-income households. This is especially true for households participating in, eligible for, or nearly eligible for SNAP.
This article uses data from the Consumer Expenditure Survey (CE) for the period 2004–2010 to examine trends in expenditures on major budget categories of goods and services for SNAP participants, program-eligible nonparticipants, and higher income nonparticipants. The analysis is repeated by looking at expenditure shares, defined as the percentage of total expenditures spent on each category of goods and services. Next, the article compares expenditures in 2010, the most recent year for which data are available, on specific (minor) budget categories across the three participation and eligibility groups.
The analysis relies on CE data for the period 2004–2010. The CE, which has been conducted for the Bureau of Labor Statistics (BLS) since 1980, collects data on consumer expenditures for goods and services used in day-to-day living. It also collects information on demographic characteristics and annual household income. The survey allows data users to relate the expenditures and income of consumers to the demographic characteristics of those consumers.
The CE consists of two separate surveys: the weekly Diary Survey and the Quarterly Interview Survey (henceforth referred to as CE Interview). The samples for the two surveys are drawn separately, and each survey has its own data collection technique. The data are released annually, with a 1-year lag from data collection to release. For example, the reference period of the 2005 CE data covers the four quarters of 2005 and the first quarter of 2006 for the CE Interview and the four quarters of 2005 for the Diary Survey. The findings in this article are based solely on estimates that use the CE Interview.
The CE Interview collects information from about 7,500 to 8,000 consumer units (families and single consumers) once every 3 months over five consecutive quarters, resulting in 38,000 to 39,000 records in the dataset.3 The survey is designed to collect information on expenditures that respondents can remember for a period of 3 months or longer. These expenditures include large purchases, such as property, automobiles, or major appliances; recurring expenditures, such as rent, utility bills, or insurance premiums; continuing expenses, such as apparel, food, and educational supplies; and other expenses, such as those related to employment and travel or vacations. The survey excludes nonprescription drugs, housekeeping supplies, and personal care products.
The purpose of first-quarter data collection is to obtain demographic information and an inventory of household goods. Some first-quarter data on expenses are also collected, but these data are not included in the analysis files. The second through fifth quarterly interviews collect the expenditure information. In addition, the second and fifth surveys collect information on annual income, employment, and credit liabilities. The income amount includes the value of SNAP benefits received. The fifth, and final, survey also collects information on asset balances, changes to asset balances in the previous 12 months, and finance charges on credit liabilities.
All analyses are conducted for consumer units. The CE defines a consumer unit as (1) occupants related by blood, marriage, adoption, or some other legal arrangement; (2) a single person living alone or sharing a household with others, but who is financially independent; or (3) two or more persons living together who share responsibility for at least two out of three major types of expenses—food, housing, and other expenses. Students living in university-sponsored housing also are included in the sample as separate consumer units.
The CE describes consumer units’ spending on a diverse set of goods and services. To minimize the bias associated with respondents recalling expenditures over longer periods, the expenditure information is collected on a quarterly basis. Other household characteristics, such as income and SNAP participation, are available as 12-month measures.
The CE data include information about the total amount of SNAP benefits received by consumer-unit members in the previous 12 months, indicating which consumer units are receiving benefits. The data analysis points to a range of 6.5 million to 11.3 million consumer units who participated in the program during the 2004–2010 period. As shown in table 1, the annual SNAP receipt in CE data is, on average, 62 percent lower than the monthly receipt identified in official administrative counts.4
| Year | Consumer Expenditure Survey, annual number of consumer units in calendar year (in thousands) | SNAP Quality Control data, average monthly number of SNAP units (in thousands) |
|---|---|---|
| 2004 | 6,525 | 10,069 |
| 2005 | 6,926 | 10,852 |
| 2006 | 7,185 | 11,313 |
| 2007 | 6,398 | 11,561 |
| 2008 | 7,519 | 12,464 |
| 2009 | 9,634 | 14,981 |
| 2010 | 11,283 | 18,369 |
| Sources: U.S. Bureau of Labor Statistics, Consumer Expenditure Interview Survey, 2004–2010, calendar year totals; U.S. Department of Agriculture, SNAP Quality Control sample data, fiscal years 2004–2010. | ||
The underreporting of SNAP benefits in the CE data suggests that a nontrivial number of SNAP participants are categorized as nonparticipants in the analysis. As a result, the investigation may identify fewer spending differences between SNAP participants and eligible nonparticipants than it would find if SNAP participation were not as underreported. Therefore, all findings should be interpreted with this in mind.
This article focuses on differences in spending patterns among SNAP participants and other low-income consumer units. Two consumer groups in the latter category are defined for comparison purposes: eligible nonparticipants and higher income nonparticipants. Eligible nonparticipants are consumer units whose 12-month income is either at or under 130 percent of poverty (the federal gross income limit for SNAP eligibility), but who are not identified as SNAP participants. The CE data do not contain sufficient information to determine if consumer units would pass an asset test that is part of the SNAP eligibility determination. Nor does the analysis account for whether consumer units need to pass a net income test, which reflects income deductions for medical, shelter, dependent care, and earnings expenses. The analysis also does not attempt to account for higher income units who could be eligible for the program through categorical eligibility rules.5 Higher income nonparticipants—the second comparison group—are identified as consumer units who do not participate in SNAP and whose income is greater than 130 percent of poverty but less than 300 percent of poverty.
Many consumer units take out loans for the purchase of homes and vehicles, and their monthly payment is split between principal and interest on the loan. Although the CE definition of expenditures includes the interest component of these payments, it excludes the principal component. This exclusion can cause expenditure totals for homeowners and vehicle owners to be downward biased. In a similar analysis of spending patterns that focused only on 2005, Laura Castner and James Mabli examined outlays, which include the principal and interest components of loan payments instead of expenditures, and found that the results were robust to the exclusion of these payments.6
Mean expenditures are estimated for each calendar year with the use of the methodology described in the CE-Interview documentation and the programs provided by BLS.7 Expenditure shares are estimated by dividing the mean expenditures for a specific category of goods and services by the mean total expenditures spent on all goods and services. All estimates are weighted on the basis of a survey weight for the total sample, called FINLWT21. Standard errors are calculated with the use of replicate weights provided by BLS. All estimates are adjusted to 2010 dollars with the use of annual values of the Consumer Price Index for All Urban Consumers.
The analysis estimates mean annual expenditures and expenditure shares for each of the three SNAP participation and eligibility groups. When interpreting findings, readers should consider the compositional differences among the three groups. For example, the average sizes of consumer units for SNAP participants, eligible nonparticipants, and higher income nonparticipants are 3.2, 2.1, and 2.5, respectively; the percentages of consumer units with children within these groups are 59 percent, 26 percent, and 33 percent, respectively.
The analysis accounts for differences in the size and composition of consumer units in two ways. First, because total expenditures are likely affected by size and composition, the analysis provides shares of total expenditures (in addition to absolute expenditures) when presenting expenditures on major budget categories of goods and services over time by participation and eligibility group. Second, when statistically comparing 2010 spending patterns across groups, the analysis presents findings according to whether consumer units contain children (age 17 and under).8 Some selected analyses also compare differences in expenditures across the three groups according to whether consumer units contain elderly members (age 65 and older) and according to whether consumer units rent or own the dwellings in which they live.
Figures 1 through 8 present annual total expenditures and annual shares of total expenditures spent on each major budget category by SNAP participants, eligible nonparticipants, and higher income nonparticipants. Budget categories include food, housing, apparel, healthcare, transportation, and other goods and services. Given that food expenditures are an important outcome measure for SNAP, the analysis divides them into spending on food at home and spending on food away from home and regards these components as separate major categories of goods and services.
| Participation and eligibility status | 2004 | 2005 | 2006 | 2007 | 2008 | 2009 | 2010 |
|---|---|---|---|---|---|---|---|
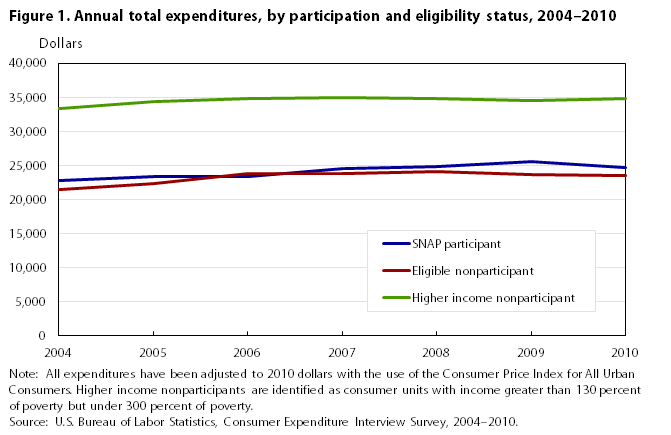
| SNAP participant | $22,706 | $23,360 | $23,380 | $24,585 | $24,856 | $25,540 | $24,758 |
| Eligible nonparticipant | 21,404 | 22,297 | 23,743 | 23,780 | 24,155 | 23,656 | 23,459 |
| Higher income nonparticipant | 33,317 | 34,405 | 34,870 | 35,029 | 34,836 | 34,467 | 34,832 |
Note: All expenditures have been adjusted to 2010 dollars with the use of the Consumer Price Index for All Urban Consumers. Higher income nonparticipants are identified as consumer units with income greater than 130 percent of poverty but under 300 percent of poverty. Source: U.S. Bureau of Labor Statistics, Consumer Expenditure Interview Survey, 2004–2010. | |||||||
Total expenditures. The three participation and eligibility groups exhibited different trends in total expenditures over the study period. (See figure 1.) Total expenditures by SNAP participants increased by $674 from 2004 to 2006, increased more sharply from 2006 to 2009, and decreased slightly from 2009 to 2010. The total increase was $2,052. By comparison, expenditures by eligible nonparticipants increased by $2,339 from 2004 to 2006, increased less sharply from 2006 to 2008, and decreased slightly from 2008 to 2010, for a total increase of $2,056. Higher income nonparticipants exhibited the smallest increase in expenditures over time—$1,514 from 2004 to 2010—with most of this increase occurring from 2004 to 2006. By 2010, total expenditures by SNAP participants exceeded expenditures by eligible nonparticipants by about $1,300; yet, total spending for both groups was markedly (about $10,000) lower than that for higher income nonparticipants.
| Annual expenditures | |||||||
|---|---|---|---|---|---|---|---|
| Participation and eligibility status | 2004 | 2005 | 2006 | 2007 | 2008 | 2009 | 2010 |
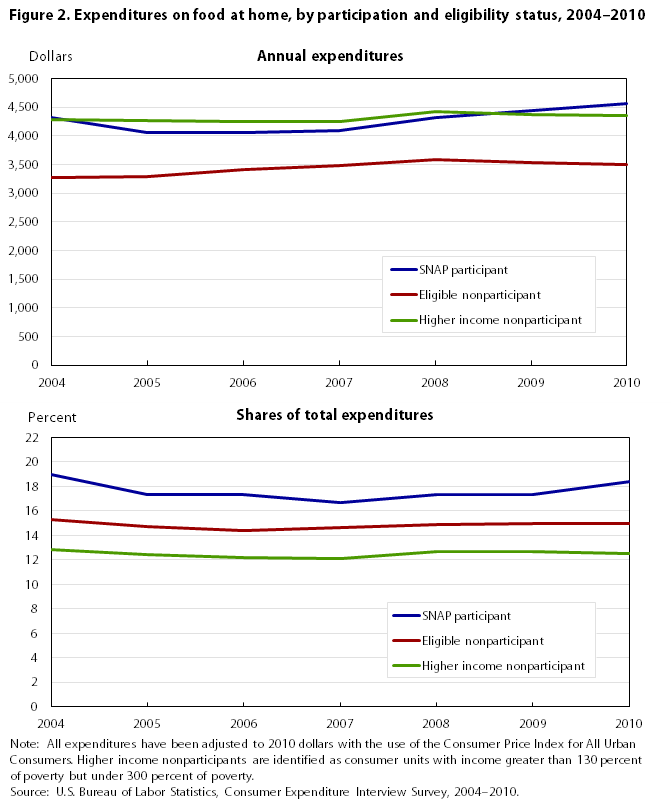
| SNAP participant | $4,317 | $4,050 | $4,057 | $4,094 | $4,311 | $4,436 | $4,559 |
| Eligible nonparticipant | 3,276 | 3,284 | 3,409 | 3,483 | 3,589 | 3,542 | 3,502 |
| Higher income nonparticipant | 4,280 | 4,273 | 4,255 | 4,255 | 4,427 | 4,372 | 4,360 |
| Percent shares of total expenditures | |||||||
| Participation and eligibility status | 2004 | 2005 | 2006 | 2007 | 2008 | 2009 | 2010 |
| SNAP participant | 19.01 | 17.34 | 17.35 | 16.65 | 17.34 | 17.37 | 18.42 |
| Eligible nonparticipant | 15.31 | 14.73 | 14.36 | 14.64 | 14.86 | 14.97 | 14.93 |
| Higher income nonparticipant | 12.85 | 12.42 | 12.20 | 12.15 | 12.71 | 12.68 | 12.52 |
Note: All expenditures have been adjusted to 2010 dollars with the use of the Consumer Price Index for All Urban Consumers. Higher income nonparticipants are identified as consumer units with income greater than 130 percent of poverty but under 300 percent of poverty. Source: U.S. Bureau of Labor Statistics, Consumer Expenditure Interview Survey, 2004–2010. | |||||||
Expenditures on food at home. SNAP participants’ spending on food at home decreased between 2004 and 2005 and then increased sharply between 2006 and 2010 (from about $4,000 to more than $4,500 per year). (See figure 2.) This dynamic differs from the change in spending on food at home by eligible nonparticipants and higher income nonparticipants; for both groups, expenditures in this category increased until 2008 and then decreased between 2008 and 2010. These diverging trends have resulted in SNAP participants having the highest annual spending on food at home in 2010 across the three groups. This finding does not simply reflect an increase in total expenditures, because, from 2007 to 2010, the share of total expenditures spent on food at home increased the most for SNAP participants (by close to 2 percentage points, with little change in the shares of the nonparticipant groups). In 2010, SNAP participants continued to maintain the highest expenditure share among the three groups, at about 18 percent. By comparison, the shares for eligible nonparticipants and higher income nonparticipants were 15 percent and about 13 percent, respectively.
| Annual expenditures | |||||||
|---|---|---|---|---|---|---|---|
| Participation and eligibility status | 2004 | 2005 | 2006 | 2007 | 2008 | 2009 | 2010 |
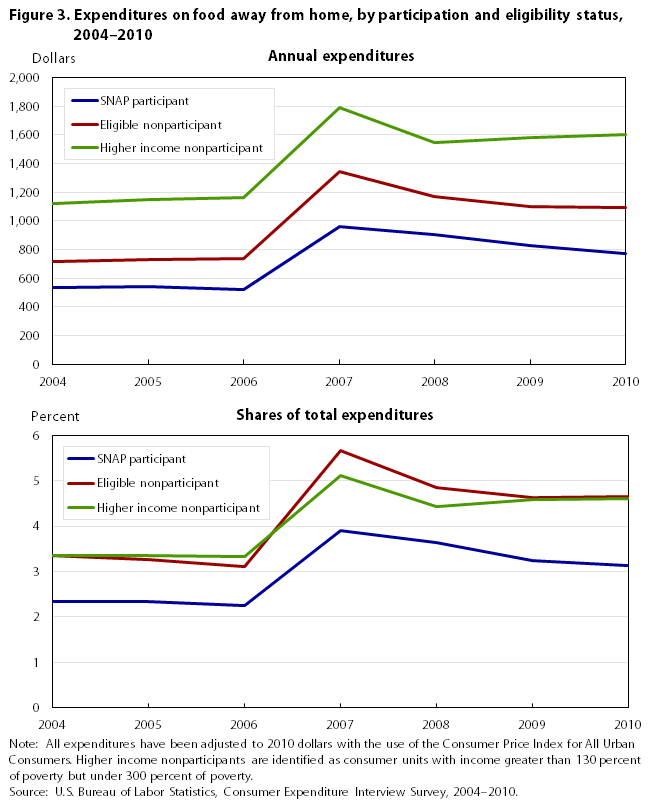
| SNAP participant | $532 | $546 | $524 | $962 | $902 | $828 | $774 |
| Eligible nonparticipant | 717 | 729 | 738 | 1,347 | 1,171 | 1,098 | 1,091 |
| Higher income nonparticipant | 1,121 | 1,150 | 1,165 | 1,792 | 1,544 | 1,581 | 1,603 |
| Percent shares of total expenditures | |||||||
| Participation and eligibility status | 2004 | 2005 | 2006 | 2007 | 2008 | 2009 | 2010 |
| SNAP participant | 2.34 | 2.34 | 2.24 | 3.91 | 3.63 | 3.24 | 3.13 |
| Eligible nonparticipant | 3.35 | 3.27 | 3.11 | 5.67 | 4.85 | 4.64 | 4.65 |
| Higher income nonparticipant | 3.36 | 3.34 | 3.34 | 5.12 | 4.43 | 4.59 | 4.60 |
Note: All expenditures have been adjusted to 2010 dollars with the use of the Consumer Price Index for All Urban Consumers. Higher income nonparticipants are identified as consumer units with income greater than 130 percent of poverty but under 300 percent of poverty. Source: U.S. Bureau of Labor Statistics, Consumer Expenditure Interview Survey, 2004–2010. | |||||||
Expenditures on food away from home. All three consumer groups had relatively flat profiles of spending on food away from home from 2004 to 2006, followed by sharp increases (between $400 and $650, depending on group) in 2007. (See figure 3.) Spending by SNAP participants and eligible nonparticipants then gradually declined through 2010. Higher income nonparticipants, however, exhibited a small decrease in spending from 2007 to 2008, and then a gradual increase beginning in 2008. Each year, SNAP participants spent the least on food away from home relative to the nonparticipant groups: about $260 and $698 less per year, on average, than did eligible nonparticipants and higher income nonparticipants, respectively. They also spent the smallest share of total expenditures on food away from home, a share that has been decreasing since 2007.
| Annual expenditures | |||||||
|---|---|---|---|---|---|---|---|
| Participation and eligibility status | 2004 | 2005 | 2006 | 2007 | 2008 | 2009 | 2010 |
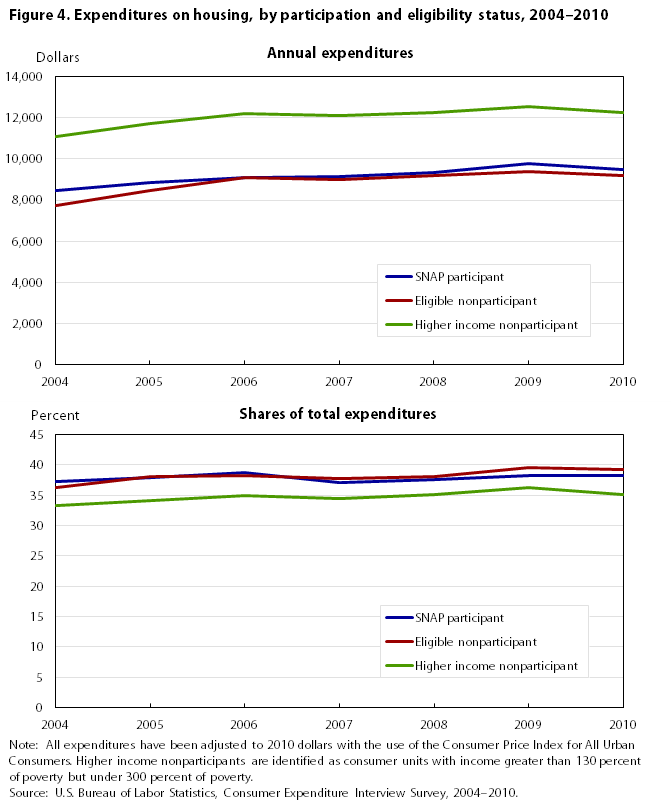
| SNAP participant | $8,459 | $8,864 | $9,073 | $9,120 | $9,326 | $9,780 | $9,485 |
| Eligible nonparticipant | 7,755 | 8,474 | 9,076 | 8,975 | 9,197 | 9,366 | 9,207 |
| Higher income nonparticipant | 11,076 | 11,714 | 12,188 | 12,088 | 12,238 | 12,518 | 12,254 |
| Percent shares of total expenditures | |||||||
| Participation and eligibility status | 2004 | 2005 | 2006 | 2007 | 2008 | 2009 | 2010 |
| SNAP participant | 37.26 | 37.94 | 38.80 | 37.10 | 37.52 | 38.29 | 38.31 |
| Eligible nonparticipant | 36.23 | 38.00 | 38.23 | 37.74 | 38.07 | 39.59 | 39.25 |
| Higher income nonparticipant | 33.24 | 34.05 | 34.95 | 34.51 | 35.13 | 36.32 | 35.18 |
Note: All expenditures have been adjusted to 2010 dollars with the use of the Consumer Price Index for All Urban Consumers. Higher income nonparticipants are identified as consumer units with income greater than 130 percent of poverty but under 300 percent of poverty. Source: U.S. Bureau of Labor Statistics, Consumer Expenditure Interview Survey, 2004–2010. | |||||||
Housing expenditures. Over the study period, spending on housing increased for all three groups. The increase for SNAP participants was the smallest, at $1,026, compared with $1,452 for eligible nonparticipants and $1,178 for higher income nonparticipants. (See figure 4.) Each year, participants and eligible nonparticipants spent less on housing than did higher income nonparticipants; however, these households spent a greater share of total expenditures on housing.
| Annual expenditures | |||||||
|---|---|---|---|---|---|---|---|
| Participation and eligibility status | 2004 | 2005 | 2006 | 2007 | 2008 | 2009 | 2010 |
| SNAP participant | $874 | $853 | $808 | $801 | $829 | $878 | $753 |
| Eligible nonparticipant | 677 | 676 | 691 | 657 | 633 | 595 | 530 |
| Higher income nonparticipant | 926 | 940 | 882 | 807 | 792 | 775 | 735 |
| Percent shares of total expenditures | |||||||
| Participation and eligibility status | 2004 | 2005 | 2006 | 2007 | 2008 | 2009 | 2010 |
| SNAP participant | 3.85 | 3.65 | 3.46 | 3.26 | 3.34 | 3.44 | 3.04 |
| Eligible nonparticipant | 3.16 | 3.03 | 2.91 | 2.76 | 2.62 | 2.51 | 2.26 |
| Higher income nonparticipant | 2.78 | 2.73 | 2.53 | 2.30 | 2.27 | 2.25 | 2.11 |
Note: All expenditures have been adjusted to 2010 dollars with the use of the Consumer Price Index for All Urban Consumers. Higher income nonparticipants are identified as consumer units with income greater than 130 percent of poverty but under 300 percent of poverty. Source: U.S. Bureau of Labor Statistics, Consumer Expenditure Interview Survey, 2004–2010. | |||||||
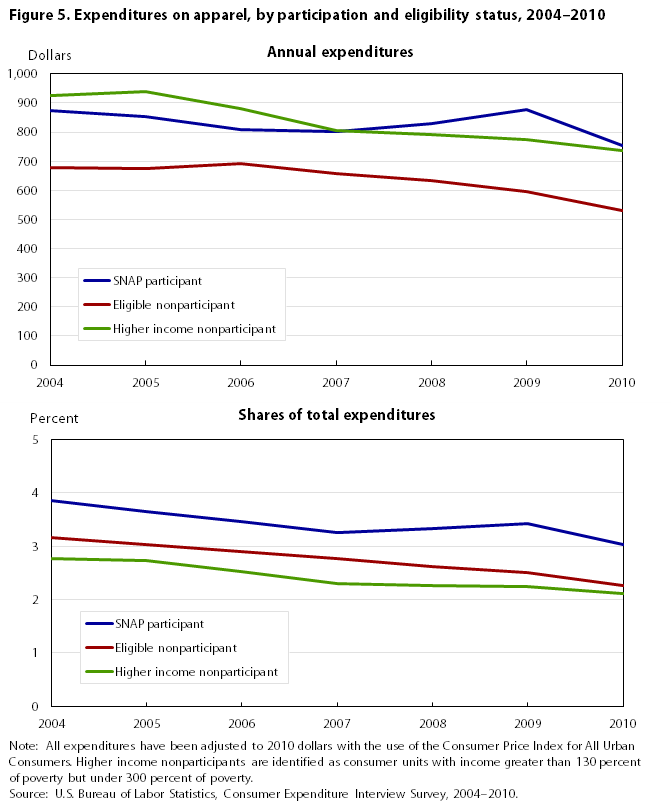
Apparel expenditures. From 2006 to 2010, expenditures on apparel decreased for both eligible nonparticipants and higher income nonparticipants—by $161 and $147, respectively. (See figure 5.) SNAP participants, however, exhibited a slightly different trend, with a spending increase of nearly $70 from 2006 to 2009 and a sharp decrease of $125 from 2009 to 2010. For each group of consumer units, the trend in the share of total expenditures spent on apparel was fairly similar to the trend in absolute apparel expenditures.
| Annual expenditures | |||||||
|---|---|---|---|---|---|---|---|
| Participation and eligibility status | 2004 | 2005 | 2006 | 2007 | 2008 | 2009 | 2010 |
| SNAP participant | $817 | $823 | $815 | $823 | $956 | $917 | $919 |
| Eligible nonparticipant | 1,519 | 1,557 | 1,492 | 1,468 | 1,560 | 1,619 | 1,604 |
| Higher income nonparticipant | 2,635 | 2,686 | 2,717 | 2,714 | 2,605 | 2,812 | 2,914 |
| Percent shares of total expenditures | |||||||
| Participation and eligibility status | 2004 | 2005 | 2006 | 2007 | 2008 | 2009 | 2010 |
| SNAP participant | 3.60 | 3.52 | 3.48 | 3.35 | 3.85 | 3.59 | 3.71 |
| Eligible nonparticipant | 7.10 | 6.98 | 6.29 | 6.17 | 6.46 | 6.85 | 6.84 |
| Higher income nonparticipant | 7.91 | 7.81 | 7.79 | 7.75 | 7.48 | 8.16 | 8.37 |
Note: All expenditures have been adjusted to 2010 dollars with the use of the Consumer Price Index for All Urban Consumers. Higher income nonparticipants are identified as consumer units with income greater than 130 percent of poverty but under 300 percent of poverty. Source: U.S. Bureau of Labor Statistics, Consumer Expenditure Interview Survey, 2004–2010. | |||||||
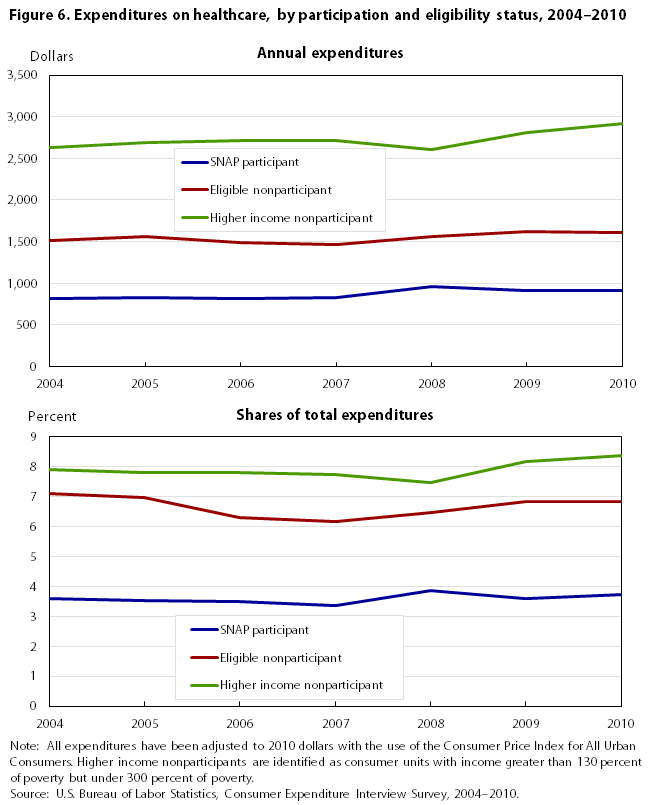
Healthcare expenditures. Each year, SNAP participants spent the least on healthcare among the three groups, maintaining about a $650 difference from eligible nonparticipants and close to a $2,000 difference from higher income nonparticipants. (See figure 6.) Spending by participants increased by $133 from 2007 to 2008 and remained fairly stable from 2008 to 2010. Spending by eligible nonparticipants exhibited a more gradual increase over the 2007–2010 period, whereas spending by higher income nonparticipants jumped by more than $300 from 2008 to 2010. For all groups, the trends in the share of total expenditures spent on healthcare were similar to the trends in absolute healthcare expenditures.
| Annual expenditures | |||||||
|---|---|---|---|---|---|---|---|
| Participation and eligibility status | 2004 | 2005 | 2006 | 2007 | 2008 | 2009 | 2010 |
| SNAP participant | $3,592 | $4,133 | $4,274 | $4,611 | $4,127 | $4,061 | $3,898 |
| Eligible nonparticipant | 3,661 | 3,599 | 4,044 | 3,684 | 3,903 | 3,317 | 3,388 |
| Higher income nonparticipant | 6,472 | 6,674 | 6,696 | 6,644 | 6,478 | 5,409 | 5,938 |
| Percent shares of total expenditures | |||||||
| Participation and eligibility status | 2004 | 2005 | 2006 | 2007 | 2008 | 2009 | 2010 |
| SNAP participant | 15.82 | 17.69 | 18.28 | 18.75 | 16.60 | 15.90 | 15.74 |
| Eligible nonparticipant | 17.10 | 16.14 | 17.03 | 15.49 | 16.16 | 14.02 | 14.44 |
| Higher income nonparticipant | 19.43 | 19.40 | 19.20 | 18.97 | 18.59 | 15.69 | 17.05 |
Note: All expenditures have been adjusted to 2010 dollars with the use of the Consumer Price Index for All Urban Consumers. Higher income nonparticipants are identified as consumer units with income greater than 130 percent of poverty but under 300 percent of poverty. Source: U.S. Bureau of Labor Statistics, Consumer Expenditure Interview Survey, 2004–2010. | |||||||
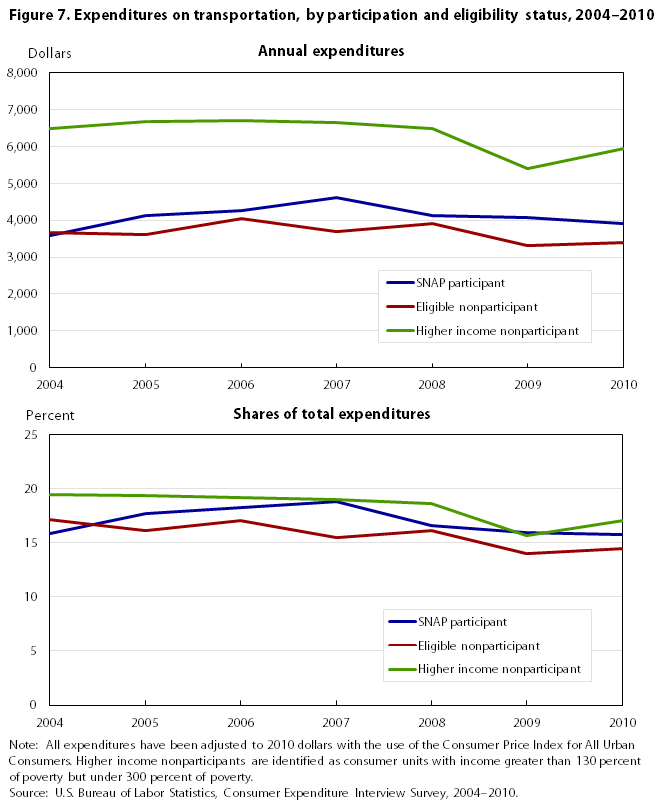
Transportation expenditures. From 2005 to 2010, SNAP participants spent more on transportation than did eligible nonparticipants. (See figure 7.) The expenditure differential between the two groups was the largest in 2007 ($927 difference) but has diminished in subsequent years ($510 difference in 2010). Each year, spending on transportation has consistently been much greater for higher income nonparticipants than it has been for SNAP participants and eligible nonparticipants. For SNAP participants, the share of total expenditures spent on transportation increased between 2004 and 2007 and decreased between 2007 and 2010. By contrast, the spending share of eligible nonparticipants, while more erratic, has generally experienced a decreasing trend.
| Annual expenditures | |||||||
|---|---|---|---|---|---|---|---|
| Participation and eligibility status | 2004 | 2005 | 2006 | 2007 | 2008 | 2009 | 2010 |
| SNAP participant | $4,114 | $4,091 | $3,829 | $4,174 | $4,405 | $4,640 | $4,370 |
| Eligible nonparticipant | 3,800 | 3,978 | 4,292 | 4,166 | 4,102 | 4,120 | 4,137 |
| Higher income nonparticipant | 6,808 | 6,969 | 6,968 | 6,730 | 6,752 | 7,000 | 7,028 |
| Percent shares of total expenditures | |||||||
| Participation and eligibility status | 2004 | 2005 | 2006 | 2007 | 2008 | 2009 | 2010 |
| SNAP participant | 18.12 | 17.51 | 16.38 | 16.98 | 17.72 | 18.17 | 17.65 |
| Eligible nonparticipant | 17.75 | 17.84 | 18.08 | 17.52 | 16.98 | 17.41 | 17.63 |
| Higher income nonparticipant | 20.44 | 20.26 | 19.98 | 19.21 | 19.38 | 20.31 | 20.18 |
Note: All expenditures have been adjusted to 2010 dollars with the use of the Consumer Price Index for All Urban Consumers. Higher income nonparticipants are identified as consumer units with income greater than 130 percent of poverty but under 300 percent of poverty. Source: U.S. Bureau of Labor Statistics, Consumer Expenditure Interview Survey, 2004–2010. | |||||||
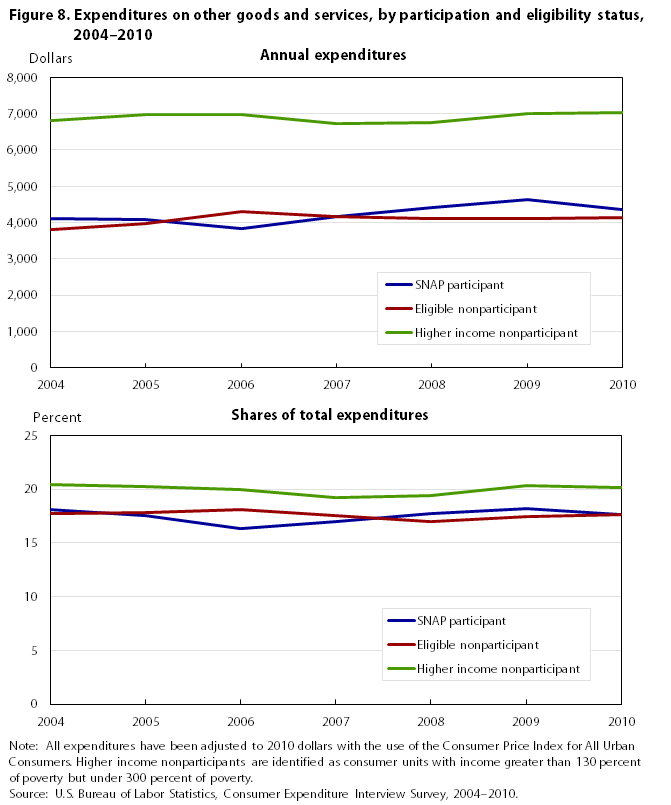
Other expenditures. The major budget category of “other” expenditures includes spending on entertainment, personal care, reading and education, tobacco, cash contributions, personal insurance and pensions, and miscellaneous goods and services. Although spending in this category exhibited little change over time for higher income nonparticipants and eligible nonparticipants, it increased by $810 for SNAP participants from 2006 to 2009, and then fell slightly. (See figure 8.) The share of total expenditures for SNAP participants also climbed over the 2006–2009 period.
Thus far, the article has presented trends in expenditures on goods and services that have been aggregated into major budget categories. It is also useful to examine differences in consumer spending across more narrowly defined subcategories within each of these major categories. This approach can reveal whether certain subcategories of expenditures are driving the aggregate results. More important, the approach brings into focus subcategories that are policy relevant. For example, by disaggregating the housing category into its components, one can compare distributions of expenditures on utilities, rent, and other shelter expenses across the three participation and eligibility groups.
The analysis in this section uses 2010 data and discusses expenditure differences that are statistically significant at the 0.10, 0.05, or 0.01 level. For each major budget category, spending differences are examined across participation and eligibility groups among all consumer units and according to whether consumer units have children. For selected major budget categories, findings are examined separately by presence of elderly household members and according to whether consumer units rent or own their dwellings.
Components of food expenditures. SNAP participants spent more on food in 2010 than did eligible nonparticipants. (See table 2.) SNAP participants spent $4,559 on food at home, whereas eligible nonparticipants spent $3,502—a difference of $1,057. Higher income nonparticipants spent $4,360 on food at home, but their overall spending on food exceeded that of SNAP participants and eligible nonparticipants. For spending on food away from home, SNAP participants spent less relative to eligible nonparticipants; in 2010, participants spent $774 and eligible nonparticipants spent $1,091—a difference of $317.
| Category | SNAP participants | Eligible nonparticipants | Higher income nonparticipants |
|---|---|---|---|
| Food | $5,334 | $4,593(1) | $5,962(1) |
| Food at home | 4,559 | 3,502(1) | 4,360(2) |
| Food away from home | 774 | 1,091(1) | 1,603(1) |
| Food away, excluding meals as pay | 756 | 1,060(1) | 1,573(1) |
| Meals as pay | 19 | 31 | 30 |
| Notes: (1) Statistically different from zero at the 0.01 level, two-tailed test. (2) Statistically different from zero at the 0.05 level, two-tailed test. Note: Higher income nonparticipants are identified as consumer units with income greater than 130 percent of poverty but under 300 percent of poverty. Component expenditures may not add to totals because of rounding. Source: U.S. Bureau of Labor Statistics, Consumer Expenditure Interview Survey, 2010. | |||
The analysis found statistically significant differences between SNAP participants and eligible nonparticipants in expenditures on food at home for consumer units without children, but not for units with children. (See table 3.) SNAP participants with children and eligible nonparticipants with children spent about the same on food at home—$5,499 and $5,575, respectively. Among consumer units without children, participants spent $3,229 on food at home, or $442 more than did eligible nonparticipants. For spending on food away from home, participants spent less than nonparticipants did, regardless of the presence of children in the unit, although the difference was larger for units without children.
A separate examination of food spending patterns according to whether consumer units contained elderly members produced findings similar to those for all consumer units. (See table 3.) For both units with and units without elderly members, SNAP participants spent more on food at home and less on food away from home than did eligible nonparticipants.
| Category | Consumer units with children | Consumer units without children | ||||
|---|---|---|---|---|---|---|
| SNAP participants | Eligible nonparticipants | Higher income nonparticipants | SNAP participants | Eligible nonparticipants | Higher income nonparticipants | |
| Food | $6,493 | $6,847 | $7,752(1) | $3,694 | $3,816 | $5,082(1) |
| Food at home | 5,499 | 5,575 | 5,802(2) | 3,229 | 2,787(1) | 3,650(1) |
| Food away from home | 993 | 1,272(1) | 1,949(1) | 465 | 1,029(1) | 1,432(1) |
| Food away, excluding meals as pay | 967 | 1,250(1) | 1,919(1) | 457 | 995(1) | 1,403(1) |
| Meals as pay | 26 | 21 | 30 | 8 | 34(2) | 29(1) |
| Category | Consumer units with elderly | Consumer units without elderly | ||||
| SNAP participants | Eligible nonparticipants | Higher income nonparticipants | SNAP participants | Eligible nonparticipants | Higher income nonparticipants | |
| Food | 4,369 | 4,087 | 5,132(1) | 5,493 | 4,822(1) | 6,380(1) |
| Food at home | 3,859 | 3,250(1) | 3,832 | 4,675 | 3,616(1) | 4,625 |
| Food away from home | 509 | 837(1) | 1,299(1) | 818 | 1,206(1) | 1,755(1) |
| Food away, excluding meals as pay | 500 | 832(1) | 1,288(1) | 798 | 1,164(1) | 1,717(1) |
| Meals as pay | 9 | 5 | 12 | 20 | 42(3) | 39(1) |
| Notes: (1) Statistically different from zero at the 0.01 level, two-tailed test. (2) Statistically different from zero at the 0.05 level, two-tailed test. (3) Statistically different from zero at the 0.10 level, two-tailed test. Note: Higher income nonparticipants are identified as consumer units with income greater than 130 percent of poverty but under 300 percent of poverty. Component expenditures may not add to totals because of rounding. Source: U.S. Bureau of Labor Statistics, Consumer Expenditure Interview Survey, 2010. | ||||||
Components of housing expenditures. Although SNAP participants and eligible nonparticipants spent similar amounts on housing overall in 2010 (the difference between their respective spending amounts of $9,485 and $9,207 was not statistically significant at the 0.05 level), they exhibited more sizable differences in some shelter and utilities expenditures, and to a lesser extent in spending on household furnishings and equipment. (See table 4.) SNAP participants spent $829 less on owned dwellings, $766 more on rented dwellings, and $172 less on “other lodging,” which includes lodging away from home. Relative to higher income nonparticipants, SNAP participants also spent considerably less on owned dwellings and considerably more on rented dwellings.
| Category | SNAP participants | Eligible nonparticipants | Higher income nonparticipants |
|---|---|---|---|
| Housing | $9,485 | $9,207 | $12,254(1) |
| Shelter | 5,598 | 5,833 | 7,458(1) |
| Owned dwellings | 1,397 | 2,226(1) | 4,174(1) |
| Mortgage interest | 786 | 1,016(1) | 2,010(1) |
| Property taxes | 339 | 716(1) | 1,310(1) |
| Maintenance, repairs, insurance, and other | 272 | 493(1) | 854(1) |
| Rented dwellings | 4,146 | 3,380(1) | 3,021(1) |
| Rent, excluding rent as pay | 3,795 | 3,233(1) | 2,959(1) |
| Rent as pay | 352 | 147(1) | 62(1) |
| Other lodging | 55 | 227(1) | 263(1) |
| Utilities, fuels, and public services | 2,904 | 2,442(1) | 3,412(1) |
| Natural gas | 300 | 265(2) | 402(1) |
| Electricity | 1,259 | 1,044(1) | 1,350(2) |
| Fuel oil and other fuel | 61 | 81 | 142(1) |
| Fuel oil | 27 | 38 | 77(1) |
| Other fuels | 34 | 44 | 64(1) |
| Telephone | 946 | 736(1) | 1,079(1) |
| Water and other public services | 339 | 316 | 438(1) |
| Household operations | 432 | 441 | 649(1) |
| Domestic services | 219 | 239 | 325(1) |
| Domestic services, excluding childcare | 41 | 156(1) | 157(1) |
| Babysitting and daycare | 178 | 82(1) | 168 |
| Other household expenses | 214 | 202 | 324(1) |
| House furnishings and equipment | 550 | 491(3) | 734(1) |
| Household textiles | 47 | 41 | 58(2) |
| Furniture | 187 | 144 | 208 |
| Floor coverings | 5 | 5 | 17(1) |
| Major appliances | 96 | 75 | 134(2) |
| Small appliances and miscellaneous housewares | 35 | 34 | 49(1) |
| Miscellaneous household equipment | 180 | 193 | 269(1) |
| Notes: (1) Statistically different from zero at the 0.01 level, two-tailed test. (2) Statistically different from zero at the 0.05 level, two-tailed test. (3) Statistically different from zero at the 0.10 level, two-tailed test. Note: Higher income nonparticipants are identified as consumer units with income greater than 130 percent of poverty but under 300 percent of poverty. Component expenditures may not add to totals because of rounding. Source: U.S. Bureau of Labor Statistics, Consumer Expenditure Interview Survey, 2010. | |||
In 2010, spending on utilities, fuels, and public services was $2,904 for SNAP participants, $2,442 for eligible nonparticipants, and $3,412 for higher income nonparticipants. Thus, SNAP participants spent $462 more on this category than did eligible nonparticipants and $508 less than did higher income nonparticipants. Electricity and telephone expenditures account for most of the spending differences between participants and eligible nonparticipants.
According to CE data, household operations include domestic services, such as housekeeping, gardening, babysitting, and daycare; pest control; moving, storage, and freight services; repair of household appliances; and other services. Although SNAP participants spent nearly the same amount on household operations as did eligible nonparticipants, the two groups differed more considerably in their spending on domestic services. Participants spent $115 less on domestic services, excluding childcare, and $96 more on babysitting and daycare. Both participants and eligible nonparticipants spent less on household operations than did higher income nonparticipants.
Similarities in overall spending on housing by SNAP participants and eligible nonparticipants mask spending variations that reflect compositional differences between the two groups. (See table 5.) A separate examination of consumer units with children and consumer units without children reveals that SNAP participants spent less on housing than did eligible nonparticipants; the difference was $1,458 for units with children and $752 for units without children. For units with children, participants and eligible nonparticipants spent statistically similar amounts on (1) rent and (2) utilities, fuels, and public services; for units without children, however, participants spent more on both sets of goods and services than did eligible nonparticipants.
| Category | Consumer units with children | Consumer units without children | ||||
|---|---|---|---|---|---|---|
| SNAP participants | Eligible nonparticipants | Higher income nonparticipants | SNAP participants | Eligible nonparticipants | Higher income nonparticipants | |
| Housing | $11,007 | $12,465(1) | $15,944(1) | $7,332 | $8,084(2) | $10,438(1) |
| Shelter | 6,359 | 7,621(1) | 9,778(1) | 4,522 | 5,217(1) | 6,317(1) |
| Owned dwellings | 1,612 | 2,807(1) | 5,817(1) | 1,093 | 2,026(1) | 3,366(1) |
| Mortgage interest | 968 | 1,677(1) | 3,744(1) | 528 | 789(1) | 1,157(1) |
| Property taxes | 371 | 747(1) | 1,426(1) | 294 | 706(1) | 1,254(1) |
| Maintenance, repairs, insurance, and other | 273 | 383 | 647(1) | 271 | 531(1) | 956(1) |
| Rented dwellings | 4,677 | 4,601 | 3,713(1) | 3,395 | 2,959(2) | 2,680(1) |
| Rent, excluding rent as pay | 4,273 | 4,382 | 3,632(2) | 3,117 | 2,837 | 2,628(2) |
| Rent as pay | 404 | 218(2) | 81(1) | 278 | 122(1) | 52(1) |
| Other lodging | 70 | 213 | 248(1) | 35 | 232(1) | 271(1) |
| Utilities, fuels, and public services | 3,348 | 3,462 | 4,202(1) | 2,276 | 2,091(3) | 3,024(1) |
| Natural gas | 337 | 362 | 470(1) | 247 | 231 | 369(1) |
| Electricity | 1,445 | 1,495 | 1,658(1) | 995 | 889(3) | 1,199(1) |
| Fuel oil and other fuel | 52 | 63 | 119(1) | 75 | 88 | 153(1) |
| Fuel oil | 20 | 19 | 56(1) | 38 | 44 | 88(2) |
| Other fuels | 32 | 44 | 63(2) | 36 | 43 | 65(2) |
| Telephone | 1,123 | 1,113 | 1,413(1) | 696 | 606(2) | 915(1) |
| Water and other public services | 391 | 428 | 542(1) | 264 | 277 | 387(1) |
| Household operations | 606 | 627 | 1,033(1) | 187 | 377(1) | 460(1) |
| Domestic services | 348 | 364 | 594(1) | 36 | 195(1) | 192(1) |
| Domestic services, excluding childcare | 46 | 63 | 105(1) | 34 | 188(1) | 183(1) |
| Babysitting and daycare | 302 | 301 | 489(1) | 3 | 7 | 10(3) |
| Other household expenses | 258 | 262 | 439(1) | 150 | 181 | 267(1) |
| House furnishings and equipment | 694 | 756 | 931(1) | 347 | 400 | 638(1) |
| Household textiles | 61 | 60 | 74 | 28 | 34 | 50(1) |
| Furniture | 234 | 228 | 282 | 120 | 115 | 171 |
| Floor coverings | 7 | 13 | 31(1) | 2 | 3 | 11(1) |
| Major appliances | 117 | 135 | 171(2) | 68 | 54 | 116(1) |
| Small appliances and miscellaneous housewares | 40 | 39 | 56(2) | 28 | 32 | 45(2) |
| Miscellaneous household equipment | 236 | 282 | 318(2) | 101 | 162(1) | 245(1) |
| Notes: (1) Statistically different from zero at the 0.01 level, two-tailed test. (2) Statistically different from zero at the 0.05 level, two-tailed test. (3) Statistically different from zero at the 0.10 level, two-tailed test. Note: Higher income nonparticipants are identified as consumer units with income greater than 130 percent of poverty but under 300 percent of poverty. Component expenditures may not add to totals because of rounding. Source: U.S. Bureau of Labor Statistics, Consumer Expenditure Interview Survey, 2010. | ||||||
When utilities are included in consumer units’ rental payments, expenditures on utilities are typically reflected in expenditures on rented dwellings. Table 6 reveals whether the differences in expenditures on housing and housing components between participants and eligible nonparticipants can be explained by differences in the propensity of these groups to rent or own. For both consumer units who rent and units who own, SNAP participants spent less on shelter and more on utilities, fuels, and public services than did eligible nonparticipants.
| Category | Consumer units who rent the dwelling in which they live | Consumer units who own the dwelling in which they live | ||||
|---|---|---|---|---|---|---|
| SNAP participants | Eligible nonparticipants | Higher income nonparticipants | SNAP participants | Eligible nonparticipants | Higher income nonparticipants | |
| Housing | $9,593 | $9,219 | $12,517(1) | $9,906 | $10,204 | $12,260(1) |
| Shelter | 6,188 | 6,705(3) | 8,794(1) | 4,788 | 5,545(2) | 6,858(1) |
| Owned dwellings | 8 | 36 | 98(1) | 4,620 | 5,079(3) | 6,484(1) |
| Mortgage interest | 2 | 22(3) | 58(2) | 2,606 | 2,312 | 3,117(3) |
| Property taxes | 4 | 11 | 25(2) | 1,117 | 1,632(1) | 2,038(1) |
| Maintenance, repairs, insurance, and other | 3 | 2 | 15(3) | 897 | 1,135 | 1,328(1) |
| Rented dwellings | 6,154 | 6,595 | 8,599(1) | 41 | 90 | 19 |
| Rent, excluding rent as pay | 5,689 | 6,391(2) | 8,511(1) | 41 | 90 | 19 |
| Rent as pay | 464 | 204(1) | 89(1) | 0 | 0 | 0 |
| Other lodging | 26 | 74(2) | 96(1) | 126 | 376(2) | 355(1) |
| Utilities, fuels, and public services | 2,457 | 1,809(1) | 2,526 | 4,022 | 3,430(1) | 3,922 |
| Natural gas | 251 | 179(1) | 247 | 428 | 394 | 492 |
| Electricity | 1,067 | 798(1) | 989(3) | 1,726 | 1,457(1) | 1,559(2) |
| Fuel oil and other fuel | 32 | 17 | 37 | 126 | 161 | 202(2) |
| Fuel oil | 19 | 5(3) | 10 | 44 | 79 | 116(1) |
| Other fuels | 13 | 12 | 27 | 81 | 82 | 86 |
| Telephone | 873 | 657(1) | 1,025(1) | 1,156 | 887(1) | 1,112 |
| Water and other public services | 235 | 159(1) | 227 | 586 | 531 | 558 |
| Household operations | 421 | 284(1) | 567(1) | 471 | 665(2) | 694(1) |
| Domestic services | 226 | 111(1) | 253 | 208 | 413(2) | 365(2) |
| Domestic services, excluding childcare | 30 | 33 | 49(1) | 66 | 320(1) | 218(1) |
| Babysitting and daycare | 195 | 78(1) | 204 | 142 | 93 | 146 |
| Other household expenses | 196 | 172 | 314(1) | 263 | 253 | 329(1) |
| House furnishings and equipment | 527 | 421(2) | 630(3) | 624 | 564 | 786(3) |
| Household textiles | 45 | 39 | 53 | 52 | 45 | 60 |
| Furniture | 199 | 135(2) | 214 | 163 | 167 | 205 |
| Floor coverings | 5 | 3 | 9(3) | 5 | 8 | 22(1) |
| Major appliances | 79 | 37(1) | 83 | 144 | 125 | 164 |
| Small appliances and miscellaneous housewares | 34 | 28 | 41(3) | 35 | 41 | 53(2) |
| Miscellaneous household equipment | 165 | 178 | 230(1) | 225 | 178 | 282 |
| Notes: (1) Statistically different from zero at the 0.01 level, two-tailed test. (2) Statistically different from zero at the 0.05 level, two-tailed test. (3) Statistically different from zero at the 0.10 level, two-tailed test. Note: Higher income nonparticipants are identified as consumer units with income greater than 130 percent of poverty but under 300 percent of poverty. Component expenditures may not add to totals because of rounding. Source: U.S. Bureau of Labor Statistics, Consumer Expenditure Interview Survey, 2010. | ||||||
Components of apparel expenditures. In 2010, SNAP participants spent $223 more on apparel than did eligible nonparticipants, whereas participants and higher income nonparticipants spent similar amounts. (See table 7.) Examining the component categories of apparel shows that, compared with eligible nonparticipants, participants spent more on apparel for children ages 15 and under and less on adult clothing for men. Participants also spent more on footwear than did eligible nonparticipants. Many of these differences reflect the presence of children in consumer units. Separately examining consumer units with children and consumer units without children shows that apparel spending was similar for participants and eligible nonparticipants, although, for units with children, participants generally spent more on children’s apparel.
| Category | All consumer units | ||
|---|---|---|---|
| SNAP participants | Eligible nonparticipants | Higher income nonparticipants | |
| Apparel and services | $753 | $530(1) | $735 |
| Men's and boys' apparel | 147 | 115(1) | 180(1) |
| Men, 16 years and over | 64 | 89(1) | 127(1) |
| Boys, 2 to 15 years | 83 | 26(1) | 53(1) |
| Women's and girls' apparel | 236 | 201(2) | 271(2) |
| Women, 16 years and over | 140 | 158 | 212(1) |
| Girls, 2 to 15 years | 96 | 42(1) | 60(1) |
| Apparel for children, under 2 years | 127 | 45(1) | 53(1) |
| Footwear | 109 | 81(1) | 108 |
| Other apparel products and services | 133 | 89(1) | 123 |
| Category | Consumer units with children | ||
| SNAP participants | Eligible nonparticipants | Higher income nonparticipants | |
| Apparel and services | 1,030 | 932 | 1,136 |
| Men's and boys' apparel | 200 | 186 | 298(1) |
| Men, 16 years and over | 61 | 91(2) | 157(1) |
| Boys, 2 to 15 years | 139 | 95(1) | 141 |
| Women's and girls' apparel | 321 | 335 | 406(1) |
| Women, 16 years and over | 162 | 179 | 248(1) |
| Girls, 2 to 15 years | 159 | 156 | 158 |
| Apparel for children, under 2 years | 201 | 137(1) | 123(1) |
| Footwear | 153 | 161 | 175(3) |
| Other apparel products and services | 154 | 113(2) | 134 |
| Category | Consumer units without children | ||
| SNAP participants | Eligible nonparticipants | Higher income nonparticipants | |
| Apparel and services | 360 | 392 | 538(1) |
| Men's and boys' apparel | 73 | 91 | 122(1) |
| Men, 16 years and over | 68 | 88 | 112(1) |
| Boys, 2 to 15 years | 5 | 3 | 10(1) |
| Women's and girls' apparel | 117 | 154(3) | 205(1) |
| Women, 16 years and over | 109 | 151(2) | 194(1) |
| Girls, 2 to 15 years | 7 | 3 | 11 |
| Apparel for children, under 2 years | 21 | 13 | 18 |
| Footwear | 47 | 53 | 75(1) |
| Other apparel products and services | 103 | 80(2) | 118 |
| Notes: (1) Statistically different from zero at the 0.01 level, two-tailed test. (2) Statistically different from zero at the 0.05 level, two-tailed test. (3) Statistically different from zero at the 0.10 level, two-tailed test. Note: Higher income nonparticipants are identified as consumer units with income greater than 130 percent of poverty but under 300 percent of poverty. Component expenditures may not add to totals because of rounding. Source: U.S. Bureau of Labor Statistics, Consumer Expenditure Interview Survey, 2010. | |||
Components of transportation expenditures. In 2010, participants spent $510 more on transportation than did eligible nonparticipants and $2,040 less than did higher income nonparticipants. (See table 8.) The difference in spending between participants and eligible nonparticipants was due primarily to spending on used cars and trucks as well as on gasoline and motor oil. Participants spent almost twice as much on local public transportation (excluding on trips) as did eligible nonparticipants. Separately examining consumer units with children and consumer units without children shows that overall spending on transportation was similar for participants and eligible nonparticipants, although participants in each group spent more on local transportation than did eligible nonparticipants in each group.
| Category | All consumer units | ||
|---|---|---|---|
| SNAP participants | Eligible nonparticipants | Higher income nonparticipants | |
| Transportation | $3,898 | $3,388(3) | $5,938(1) |
| Cars and trucks, new | 143 | 308 | 769(1) |
| Cars and trucks, used | 1,087 | 606(1) | 1,160 |
| Other vehicles | 43 | 3(3) | 17 |
| Gasoline and motor oil | 1,385 | 1,278(3) | 1,917(1) |
| Vehicle finance charges | 81 | 77 | 192(1) |
| Maintenance and repairs | 382 | 350 | 571(1) |
| Vehicle insurance | 457 | 454 | 797(1) |
| Vehicle rental, licenses, and other charges | 134 | 156 | 264(1) |
| Public transportation | 187 | 156 | 252(3) |
| Public transportation on trips | 81 | 99 | 194(1) |
| Local public transportation, excluding on trips | 106 | 57(1) | 58(1) |
| Category | Consumer units with children | ||
| SNAP participants | Eligible nonparticipants | Higher income nonparticipants | |
| Transportation | 4,992 | 5,505 | 7,808(1) |
| Cars and trucks, new | 244 | 753 | 930(1) |
| Cars and trucks, used | 1,389 | 1,137 | 1,573 |
| Other vehicles | 74 | 0(3) | 30 |
| Gasoline and motor oil | 1,735 | 2,012(1) | 2,684(1) |
| Vehicle finance charges | 105 | 129 | 314(1) |
| Maintenance and repairs | 480 | 477 | 687(1) |
| Vehicle insurance | 571 | 667(3) | 998(1) |
| Vehicle rental, licenses, and other charges | 170 | 179 | 345(1) |
| Public transportation | 223 | 152 | 246 |
| Public transportation on trips | 104 | 77 | 194(2) |
| Local public transportation, excluding on trips | 118 | 75(2) | 53(1) |
| Category | Consumer units without children | ||
| SNAP participants | Eligible nonparticipants | Higher income nonparticipants | |
| Transportation | 2,350 | 2,659 | 5,019(1) |
| Cars and trucks, new | 0 | 154(1) | 689(1) |
| Cars and trucks, used | 659 | 423 | 957 |
| Other vehicles | 0 | 4 | 10 |
| Gasoline and motor oil | 890 | 1,025(3) | 1,540(1) |
| Vehicle finance charges | 46 | 59 | 131(1) |
| Maintenance and repairs | 242 | 307(3) | 514(1) |
| Vehicle insurance | 294 | 380(2) | 699(1) |
| Vehicle rental, licenses, and other charges | 82 | 149(1) | 224(1) |
| Public transportation | 136 | 157 | 255(1) |
| Public transportation on trips | 48 | 107(1) | 194(1) |
| Local public transportation, excluding on trips | 88 | 50(2) | 61 |
| Notes: (1) Statistically different from zero at the 0.01 level, two-tailed test. (2) Statistically different from zero at the 0.05 level, two-tailed test. (3) Statistically different from zero at the 0.10 level, two-tailed test. Note: Higher income nonparticipants are identified as consumer units with income greater than 130 percent of poverty but under 300 percent of poverty. Component expenditures may not add to totals because of rounding. Source: U.S. Bureau of Labor Statistics, Consumer Expenditure Interview Survey, 2010. | |||
Components of healthcare expenditures. Healthcare expenditures by SNAP participants ($919) were much lower than those by eligible nonparticipants ($1,604) and higher income nonparticipants ($2,914). (See table 9.) Relative to eligible nonparticipants, SNAP participants spent $685 less on health insurance, $465 less on medical services, and $141 less on prescription drugs and medical supplies. These spending differences remained statistically significant when accounting for the presence of children or elderly in the consumer unit, except for expenditures on prescription drugs and medical supplies. Group differences in the latter category were not statistically significant for units without children and units without elderly. (See table 10.)
| Category | SNAP participants | Eligible nonparticipants | Higher income nonparticipants |
|---|---|---|---|
| Healthcare | $919 | $1,604(1) | $2,914(1) |
| Health insurance | 535 | 999(1) | 1,851(1) |
| Medical services | 183 | 325(1) | 624(1) |
| Prescription drugs and medical supplies | 172 | 250(2) | 366(1) |
| Medical supplies | 29 | 30 | 73(1) |
| Notes: (1) Statistically different from zero at the 0.01 level, two-tailed test. (2) Statistically different from zero at the 0.05 level, two-tailed test. Note: Higher income nonparticipants are identified as consumer units with income greater than 130 percent of poverty but under 300 percent of poverty. Component expenditures may not add to totals because of rounding. Source: U.S. Bureau of Labor Statistics, Consumer Expenditure Interview Survey, 2010. | |||
| Category | Consumer units with children | Consumer units without children | ||||
|---|---|---|---|---|---|---|
| SNAP participants | Eligible nonparticipants | Higher income nonparticipants | SNAP participants | Eligible nonparticipants | Higher income nonparticipants | |
| Healthcare | $825 | $1,357(1) | $2,532(1) | $1,051 | $1,689(1) | $3,102(1) |
| Health insurance | 448 | 719(1) | 1,571(1) | 657 | 1,096(1) | 1,989(1) |
| Medical services | 201 | 419(1) | 680(1) | 158 | 292(1) | 596(1) |
| Prescription drugs and medical supplies | 144 | 193(2) | 215(1) | 212 | 269 | 440(1) |
| Medical supplies | 32 | 26 | 66(1) | 24 | 32 | 77(1) |
| Category | Consumer units with elderly | Consumer units without elderly | ||||
| SNAP participants | Eligible nonparticipants | Higher income nonparticipants | SNAP participants | Eligible nonparticipants | Higher income nonparticipants | |
| Healthcare | 1,645 | 2,882(1) | 4,413(1) | 799 | 1,024(1) | 2,160(1) |
| Health insurance | 1,243 | 1,980(1) | 3,046(1) | 417 | 554(1) | 1,250(1) |
| Medical services | 142 | 390(1) | 638(1) | 190 | 295(2) | 617(1) |
| Prescription drugs and medical supplies | 220 | 459(2) | 613(1) | 164 | 155 | 242(1) |
| Medical supplies | 41 | 52 | 116(1) | 27 | 20 | 52(1) |
| Notes: (1) Statistically different from zero at the 0.01 level, two-tailed test. (2) Statistically different from zero at the 0.05 level, two-tailed test. Note: Higher income nonparticipants are identified as consumer units with income greater than 130 percent of poverty but under 300 percent of poverty. Component expenditures may not add to totals because of rounding. Source: U.S. Bureau of Labor Statistics, Consumer Expenditure Interview Survey, 2010. | ||||||
Components of other expenditures. SNAP participants and eligible nonparticipants spent statistically similar amounts on entertainment in 2010, but participants spent $559 less on education, $322 more on tobacco and smoking supplies, and $545 more on personal insurance and pensions. (See table 11.) Much of the difference in personal insurance and pension expenditures comes from spending on retirement, pensions, and social security. The differences in expenditures on entertainment, tobacco, and personal insurance and pensions between the two groups remained when accounting for the presence of children. However, relative to eligible nonparticipants, participants spent similar amounts on education among consumer units with children and relatively less on education among units without children.
| Category | All consumer units | ||
|---|---|---|---|
| SNAP participants | Eligible nonparticipants | Higher income nonparticipants | |
| Entertainment | $1,072 | $1,002 | $1,524(1) |
| Fees and admission | 107 | 149(2) | 280(1) |
| Television, radios, and sound equipment | 625 | 553(1) | 788(1) |
| Other equipment and services | 339 | 299 | 455(1) |
| Pets, toys, and playground equipment | 263 | 205(2) | 309(3) |
| Other entertainment equipment and services | 76 | 94 | 146(2) |
| Personal care | 120 | 123 | 206(1) |
| Reading | 27 | 44(1) | 71(1) |
| Education | 239 | 798(1) | 433(1) |
| Tobacco and smoking supplies | 610 | 288(1) | 369(1) |
| Miscellaneous | 388 | 358 | 546(1) |
| Cash contributions | 483 | 606 | 1,169(1) |
| Personal insurance and pensions | 1,305 | 759(1) | 2,515(1) |
| Life and other personal insurance | 80 | 101 | 205(1) |
| Retirement, pensions, and social security | 1,225 | 658(1) | 2,311(1) |
| Category | Consumer units with children | ||
| SNAP participants | Eligible nonparticipants | Higher income nonparticipants | |
| Entertainment | 1,266 | 1,276 | 2,035(1) |
| Fees and admission | 141 | 190 | 403(1) |
| Television, radios, and sound equipment | 709 | 688 | 959(1) |
| Other equipment and services | 416 | 398 | 673(1) |
| Pets, toys, and playground equipment | 307 | 292 | 409(1) |
| Other entertainment equipment and services | 109 | 106 | 264(3) |
| Personal care | 147 | 132 | 23(1) |
| Reading | 25 | 28 | 48(1) |
| Education | 281 | 383 | 527(1) |
| Tobacco and smoking supplies | 597 | 341(1) | 408(1) |
| Miscellaneous | 408 | 277(3) | 600(2) |
| Cash contributions | 468 | 516 | 1,132(1) |
| Personal insurance and pensions | 1,686 | 1,500(2) | 4,306(1) |
| Life and other personal insurance | 66 | 77 | 239(1) |
| Retirement, pensions, and social security | 1,621 | 1,424(2) | 4,066(1) |
| Category | Consumer units without children | ||
| SNAP participants | Eligible nonparticipants | Higher income nonparticipants | |
| Entertainment | 797 | 908 | 1,273(1) |
| Fees and admission | 60 | 136(1) | 220(1) |
| Television, radios, and sound equipment | 507 | 507 | 704(1) |
| Other equipment and services | 231 | 265 | 348(1) |
| Pets, toys, and playground equipment | 201 | 175 | 260 |
| Other entertainment equipment and services | 30 | 90(3) | 88(1) |
| Personal care | 81 | 120(1) | 191(1) |
| Reading | 29 | 49(1) | 83(1) |
| Education | 179 | 941(1) | 387(2) |
| Tobacco and smoking supplies | 629 | 270(1) | 350(1) |
| Miscellaneous | 359 | 385 | 519(3) |
| Cash contributions | 506 | 637 | 1,187(1) |
| Personal insurance and pensions | 764 | 504(1) | 1,635(1) |
| Life and other personal insurance | 100 | 110 | 188(1) |
| Retirement, pensions, and social security | 664 | 395(1) | 1,447(1) |
| Notes: (1) Statistically different from zero at the 0.01 level, two-tailed test. (2) Statistically different from zero at the 0.05 level, two-tailed test. (3) Statistically different from zero at the 0.10 level, two-tailed test. Note: Higher income nonparticipants are identified as consumer units with income greater than 130 percent of poverty but under 300 percent of poverty. Component expenditures may not add to totals because of rounding. Source: U.S. Bureau of Labor Statistics, Consumer Expenditure Interview Survey, 2010. | |||
This article examined recent spending patterns for SNAP participants, eligible nonparticipants, and higher income nonparticipants. The aim was to determine how much SNAP participants spent on food, whether this spending amount changed over time, whether participants spent more on food than did nonparticipants, and whether spending on nonfood goods and services differed between program participants and nonparticipants. The differences in 2010 in absolute spending amounts and types of goods and services purchased, along with the changes in these measures over the 2004–2010 period, suggest that SNAP participants, eligible nonparticipants, and higher income nonparticipants make different spending decisions.
The article found that total expenditures, adjusted for inflation, increased over the study period by about $2,000 for SNAP participants and eligible nonparticipants and by about $1,500 for higher income nonparticipants. Examining spending on major budget categories, the analysis found that spending on food at home increased since 2006 by a greater amount for SNAP participants than it did for eligible nonparticipants, with participants’ spending eventually surpassing nonparticipants’ spending by 2010. In addition, housing expenditures have increased steadily for each participation and eligibility group, with SNAP participants spending amounts similar to those spent by nonparticipants. Finally, transportation expenditures have remained fairly stable over the study period for both SNAP participants and eligible nonparticipants.
Focusing on 2010, the analysis statistically compared expenditures on specific (minor) budget categories of goods and services across the participation and eligibility groups. Relative to eligible nonparticipants, SNAP participants spent over $1,000 more on food at home and over $300 less on food away from home. Participants with children and eligible nonparticipants with children spent similar amounts on food at home, whereas participants without children spent more on food at home than did eligible nonparticipants without children. Participants spent less on food away from home than did eligible nonparticipants, regardless of whether these two groups had children.
There were notable differences in housing spending as well. Relative to eligible nonparticipants, SNAP participants spent $829 less on owned dwellings, $766 more on rented dwellings, and $462 more on utilities, fuels, and public services. For consumer units with children, participants and eligible nonparticipants spent statistically similar amounts on (1) rent and (2) utilities, fuels, and public services; for units without children, however, participants spent more on both sets of goods and services than did eligible nonparticipants.
Spending on transportation was similar for participants and eligible nonparticipants when examining consumer units with children and consumer units without children separately, although participants spent more on local transportation than did eligible nonparticipants. Finally, healthcare spending was over $900 lower for SNAP participants than it was for eligible nonparticipants.
!--?pagebreak?-->!--?pagebreak?-->!--?pagebreak?-->!--?pagebreak?-->!--?pagebreak?-->!--?pagebreak?-->!--?pagebreak?-->!--?pagebreak?-->James Mabli, and Rosalie Malsberger, "Recent trends in spending patterns of Supplemental Nutrition Assistance Program participants and other low-income Americans," Monthly Labor Review, U.S. Bureau of Labor Statistics, September 2013, https://doi.org/10.21916/mlr.2013.30
1 Data on participation rates and benefit costs were obtained at https://www.fns.usda.gov.
2 Laura Castner and James Mabli, Low-income household spending patterns and measures of poverty (U.S. Department of Agriculture, Food and Nutrition Service, 2010); Jennifer Ward-Batts, “Out of the wallet and into the purse: using micro data to test income pooling,” Journal of Human Resources 43, no. 2, 2008, pp. 325–351; Geoffrey D. Paulin and Yoon G. Lee, “Expenditures of single parents: how does gender figure in?” Monthly Labor Review, July 2002, pp. 16–37; Deanna L. Sharpe and Abdel-Ghany Mohamed, “Identifying the poor and their consumption patterns,” Family Economics and Nutrition Review 12, no. 2, 1999, pp. 15–25; Mark Lino, “Income and spending of poor households with children,” Family Economics and Nutrition Review 9, no. 1, 1996, pp. 2–13.
3 Besides containing up to four records for each of the 7,500 to 8,000 households added to the survey each year, the CE Interview contains records from the previous year for households whose survey periods extended into the beginning of the calendar year.
4 Annual measures indicate the number of consumer units who participated in SNAP at some point during the year. Average monthly measures indicate the number of units participating in a month, averaged over the year. The annual measures are larger than the average monthly measures because some individuals who participated during the year (and who were thus reflected in the annual count) did not participate in every month. Administrative counts of annual participation are not available.
5 In this article, higher income nonparticipants are defined as consumer units with 12-month incomes greater than 130 percent of poverty. Some participating consumer units also have incomes greater than this threshold. These consumer units may be eligible through a categorical eligibility rule, or the actual income of the SNAP unit may differ from the consumer-unit income.
6 Castner and Mabli, Low-income household spending patterns.
7 For the 2005 CE data, see 2005 Consumer Expenditure Interview Survey public use microdata documentation (Bureau of Labor Statistics, February 2007). See related documentation for other survey years.
8 The average sizes of consumer units with children for SNAP participants, eligible nonparticipants, and higher income nonparticipants are 4.3, 4.3, and 4.2, respectively; for consumer units without children, the sizes are 1.7, 1.4, and 1.7, respectively.