An official website of the United States government
An official website of the United States government
The .gov means it's official.
Federal government websites often end in .gov or .mil. Before sharing sensitive information,
make sure you're on a federal government site.
The site is secure.
The
https:// ensures that you are connecting to the official website and that any
information you provide is encrypted and transmitted securely.
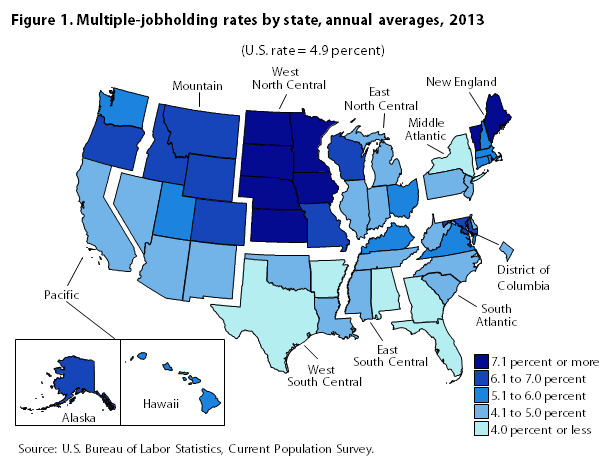
Multiple-jobholding rates at the state and regional levels vary considerably from the national average.
In 2013, the multiple-jobholding rate1 (the percentage of individuals who hold more than one job) in individual states continued to vary considerably from the national average of 4.9 percent, a rate that has been unchanged since 2010. (See figure 1 and table 1.) Twenty-three states had multiple-jobholding rates significantly higher than the national average, 8 states had significantly lower rates, and 19 states and the District of Columbia had rates that were not significantly different from the U.S. average.
| U.S. Census region and division | 2012 | 2013 | ||
|---|---|---|---|---|
| Rate | Rate | Error at 90-percent confidence | Significantly different than the U.S. | |
United States | 4.9 | 4.9 | ±0.1 | — |
Northeast region | 4.8 | 4.8 | ±0.3 | — |
New England division | 6.0 | 6.0 | ±0.5 | higher |
Connecticut | 5.8 | 5.6 | ±0.8 | — |
Maine | 8.1 | 8.6 | ±1.0 | higher |
Massachusetts | 5.4 | 5.4 | ±0.9 | — |
New Hampshire | 6.0 | 5.9 | ±0.7 | higher |
Rhode Island | 5.6 | 5.7 | ±0.7 | higher |
Vermont | 8.6 | 8.8 | ±1.0 | higher |
Middle Atlantic division | 4.4 | 4.3 | ±0.3 | lower |
New Jersey | 4.5 | 4.3 | ±0.6 | lower |
New York | 3.9 | 3.9 | ±0.5 | lower |
Pennsylvania | 5.0 | 5.0 | ±0.5 | — |
South region | 4.2 | 4.3 | ±0.2 | lower |
South Atlantic division | 4.2 | 4.3 | ±0.3 | lower |
Delaware | 4.9 | 4.4 | ±0.7 | — |
District of Columbia | 4.3 | 4.7 | ±0.7 | — |
Florida | 3.4 | 3.4 | ±0.5 | lower |
Georgia | 3.9 | 3.5 | ±0.6 | lower |
Maryland | 5.4 | 6.1 | ±0.7 | higher |
North Carolina | 5.1 | 4.9 | ±0.7 | — |
South Carolina | 3.7 | 4.3 | ±0.8 | — |
Virginia | 4.4 | 5.2 | ±0.8 | — |
West Virginia | 4.3 | 4.9 | ±1.2 | — |
East South Central division | 4.5 | 4.5 | ±0.5 | — |
Alabama | 4.0 | 3.7 | ±0.9 | lower |
Kentucky | 5.4 | 5.3 | ±1.1 | — |
Mississippi | 5.0 | 4.3 | ±1.1 | — |
Tennessee | 4.1 | 4.5 | ±0.9 | — |
West South Central division | 4.0 | 4.1 | ±0.4 | lower |
Arkansas | 4.7 | 4.0 | ±0.9 | lower |
Louisiana | 3.8 | 4.9 | ±1.0 | — |
Oklahoma | 4.2 | 4.1 | ±0.9 | — |
Texas | 4.0 | 3.9 | ±0.5 | lower |
Midwest region | 6.0 | 6.0 | ±0.3 | higher |
East North Central division | 5.4 | 5.2 | ±0.3 | — |
Illinois | 5.1 | 4.8 | ±0.6 | — |
Indiana | 4.6 | 4.7 | ±0.8 | — |
Michigan | 4.4 | 4.7 | ±0.7 | — |
Ohio | 6.1 | 5.8 | ±0.8 | higher |
Wisconsin | 6.9 | 6.3 | ±1.0 | higher |
West North Central division | 7.3 | 7.5 | ±0.4 | higher |
Iowa | 7.3 | 7.6 | ±0.9 | higher |
Kansas | 8.2 | 7.5 | ±1.0 | higher |
Minnesota | 8.1 | 8.0 | ±0.9 | higher |
Missouri | 5.3 | 6.5 | ±1.0 | higher |
Nebraska | 8.5 | 7.9 | ±0.9 | higher |
North Dakota | 8.0 | 7.9 | ±1.3 | higher |
South Dakota | 9.5 | 8.9 | ±1.1 | higher |
West region | 4.9 | 4.8 | ±0.2 | — |
Mountain division | 5.3 | 5.4 | ±0.4 | higher |
Arizona | 4.8 | 4.9 | ±1.0 | — |
Colorado | 5.7 | 6.2 | ±1.0 | higher |
Idaho | 6.0 | 6.1 | ±1.1 | higher |
Montana | 7.5 | 6.9 | ±1.3 | higher |
Nevada | 4.5 | 4.2 | ±0.8 | — |
New Mexico | 4.0 | 4.1 | ±1.0 | — |
Utah | 6.0 | 6.0 | ±1.0 | higher |
Wyoming | 7.0 | 6.6 | ±1.1 | higher |
Pacific division | 4.7 | 4.6 | ±0.2 | lower |
Alaska | 6.1 | 6.7 | ±1.4 | higher |
California | 4.2 | 4.1 | ±0.3 | lower |
Hawaii | 6.2 | 5.8 | ±0.8 | higher |
Oregon | 6.7 | 6.2 | ±0.9 | higher |
Washington | 5.7 | 5.9 | ±0.7 | higher |
Source: Current Population Survey, Bureau of Labor Statistics. | ||||
Multiple-jobholding rates tended to vary by region. As in past years, northern states generally had higher rates than southern states. All states in the West North Central Census division had multiple-jobholding rates significantly higher than the U.S. average. All but one of the states in the Pacific division, and all but two states in the New England division, had rates significantly higher than the national average. Five of the eight states with multiple-jobholding rates significantly below the national average were located in the South region.2
Most of the states with high multiple-jobholding rates in 2013 have had consistently high rates since estimates became available in 1994. South Dakota recorded the highest multiple-jobholding rate of any state, 8.9 percent. Vermont and Maine followed with rates of 8.8 percent and 8.6 percent, respectively. Five additional states had multiple-jobholding rates of 7.5 percent or above.
Florida had the lowest multiple-jobholding rate of any state in 2013, 3.4 percent. Four other states recorded rates below 4.0 percent. Missouri (+1.2 percentage points) and Louisiana (+1.1 points) had the only statistically significant changes in their multiple-jobholding rates from 2012.
The U.S. multiple-jobholding rate has declined gradually or remained flat each year since peaking at 6.2 percent in 1996. Among the states, 47 states and the District of Columbia had lower multiple-jobholding rates in 2013 than in 1996. The remaining 3 states had rates that were only marginally higher over that 17-year span. The largest declines from 1996 to 2013 occurred in Hawaii and Wisconsin (-3.6 percentage points each), Idaho (-3.4 points), and Montana (-3.3 points).
Susan Campolongo, "Multiple jobholding in states in 2013," Monthly Labor Review, U.S. Bureau of Labor Statistics, August 2014, https://doi.org/10.21916/mlr.2014.29
1 Data for this report are derived from the Current Population Survey (CPS), a survey of about 60,000 households selected to represent the U.S. population 16 years and older. The survey is conducted monthly by the Census Bureau for the Bureau of Labor Statistics. Multiple jobholders are those persons who report, in the reference week of the survey, that they are wage or salary workers who hold two or more jobs, self-employed workers who also hold a wage or salary job, or unpaid family workers who also hold a wage or salary job.
2 The South region is composed of the East South Central, South Atlantic, and West South Central divisions.