
An official website of the United States government
An official website of the United States government
The .gov means it's official.
Federal government websites often end in .gov or .mil. Before sharing sensitive information,
make sure you're on a federal government site.
The site is secure.
The
https:// ensures that you are connecting to the official website and that any
information you provide is encrypted and transmitted securely.

Crossref 0
A Timely Redux for Personal Unemployment Insurance Savings Accounts, SSRN Electronic Journal , 2020.
This article uses data from the recently compiled Public Workforce System Dataset to assess the response of selected federal workforce programs to the 2007–2009 recession. The analysis indicates that these programs responded quickly to the economic downturn, providing timely relief for a large number of unemployed workers. Supplemental funding secured through the American Recovery and Reinvestment Act also enabled federal workforce programs and state agencies to pay benefits for longer durations and to offer expanded training and reemployment services to program participants.
This article examines the operations of federally funded public workforce programs during the Great Recession of 2007–2009. More workers lost their jobs during the recession than in any previous economic downturn since World War II. As a result, a record number of job seekers participated in federal workforce programs. Unemployed workers seeking reemployment relied heavily on unemployment insurance (UI), labor exchange and other reemployment services, and job training. The U.S. Department of Labor (DOL), in partnership with states and local entities, provides these services through the UI system, the Wagner–Peyser Act Employment Service, and the Workforce Investment Act (WIA) programs.
The UI system offers eligible unemployed workers cash assistance for up to 26 weeks in normal times and longer during economic downturns. The Employment Service provides job matching and job referral services, as well as other reemployment services, such as help searching for jobs, writing resumes, and honing interviewing skills. The WIA adult programs provide more intensive job search assistance and job training to dislocated workers and economically disadvantaged adults. Additional federally funded programs—including WIA Youth and Job Corps for young people, Trade Adjustment Assistance programs for workers displaced by foreign competition, and the Senior Community Service Employment Program for low-income workers age 55 and over—offer employment assistance, but these programs are not included in the analysis.
DOL has statutory authority to collect data for each of its major public workforce programs. As a condition of receiving grants from DOL, each state (plus the District of Columbia and certain U.S. territories) is required to submit reports on a regular basis. Program reports have generally been used by individual programs, primarily for program management and program performance purposes. Only recently has DOL attempted to compile these reports in one place for analytical and research purposes. In 2009, DOL created the Public Workforce System Dataset (PWSD), which assembled data back to 1995 for the federal programs described above.1 For the analysis in this article, the original database was updated to the third quarter of 2011 for the UI and Employment Service programs and to the first quarter of 2011 for the WIA adult programs; the update captured the most recent data available at the time.
Reporting requirements vary by workforce program. Of the programs considered here, the UI program requires states to submit the greatest number of federal reports on a wide variety of program-related benefit and tax issues. States submit UI reports to the Employment and Training Administration (ETA), part of DOL, at different frequencies—weekly, monthly, quarterly, and annually. The data used here are from the monthly ETA 5159 and ETA 9048 reports, which collect information on UI claimants and reemployment services activity. The primary Employment Service report, used for the Labor Exchange Reporting System, is the ETA 9002 report, which states submit quarterly. State workforce agencies participating in the WIA programs submit individual participant-level data through the quarterly (and annual) ETA 9090 and ETA 9091 reports, called Workforce Investment Act Standardized Report Data. States also submit a number of financial reports to DOL. The PWSD assembles these data on a quarterly basis. All figures in this article are based on quarterly PWSD data, while the tables are based on annual data from multiple sources.2
Before the Great Recession, the Employment Service and WIA programs had been funded at fairly steady levels, with little excess capacity to accommodate a sizable influx of new participants. When the recession began, these programs had neither the staff nor the funds to adequately handle the enormous increase in program participants. Financing the UI program is different from funding the Employment Service and WIA programs. According to federal budgeting rules, the UI program is an entitlement program, which means that the regular UI program is obligated to pay all eligible workers up to 26 weeks of benefits, with extended benefit programs offering additional weeks of cash assistance, regardless of program cost.3 However, despite the prospective availability of UI funds at the onset of the recession, it was not clear whether existing staff capacity was sufficient for the expeditious processing of additional claims.
As part of the American Recovery and Reinvestment Act (ARRA)—the $787 billion stimulus package that Congress enacted in February 2009—the public workforce system received almost $12 billion to accommodate the increased number of program participants who had already enrolled in the programs. Table 1 lists the amounts of ARRA funds received by various programs. In addition to these funds, starting in June 2008, Congress separately funded enhancements and extensions of the UI program and continued funding these programs for several years, with some supplemental funding continuing through December 2012.
| ARRA funding category | Funding amount (billion dollars) |
|---|---|
| UI Administration | 0.500 |
| UI Modernization | 7.000 |
| Wagner–Peyser Act grants to states | .150 |
| Wagner–Peyser Act reemployment services | .250 |
| WIA Adult | .500 |
| WIA Dislocated Worker | 1.250 |
| WIA Dislocated Worker National Reserve | .200 |
| High Growth and Emerging Industry grants | .750 |
| WIA Youth | 1.200 |
| Job Corps | .250 |
| YouthBuild | .050 |
| Senior Community Service Employment Program | .120 |
| Source: David H. Bradley and Ann Lordeman, Funding for workforce development in the American Recovery and Reinvestment Act (ARRA), CRS report for Congress R40182 (Congressional Research Service, 2009). | |
The UI program pays benefits to unemployed workers who have a sufficiently long work history and who have lost their jobs through no fault of their own. In most states, regular UI benefits are generally paid for up to 26 weeks. By providing cash assistance to displaced workers during an economic downturn, the UI program operates as an automatic stabilizer of the U.S. economy. In an economic downturn, the amount of benefits paid out increases automatically, because the UI program is a budgetary entitlement not subject to budget appropriations either at the state or federal level. As the U.S. economy entered the recent recession, unemployment rates—as measured both by the Bureau of Labor Statistics Current Population Survey (CPS) and by insured unemployment program enumerations—more than doubled in the period between the cyclical unemployment low in 2007 and the cyclical unemployment highs in 2009 and 2010.
State UI agencies responded quickly to the recession, succeeding in determining program eligibility and making payments to a greatly increased flow of UI claimants. As a result, the number of unemployed workers receiving first payments under the regular UI program nearly doubled between 2006 and 2009. Because of longer durations of insured unemployment, the total amount of regular UI benefits paid out increased by 250 percent during this period. (See table 2.)
| Category | 2005 | 2006 | 2007 | 2008 | 2009 | 2010 | 2011 |
|---|---|---|---|---|---|---|---|
| Unemployment rates (percent) | |||||||
| CPS civilian | 5.20 | 4.80 | 4.60 | 5.30 | 8.60 | 9.80 | 9.20 |
| UI | 2.10 | 2.00 | 1.90 | 2.20 | 4.10 | 3.70 | 3.00 |
| Program activity (millions) | |||||||
| First payments | 8.00 | 7.40 | 7.50 | 8.80 | 14.40 | 11.30 | 9.70 |
| Regular exhaustions | 3.00 | 2.70 | 2.60 | 3.10 | 6.40 | 7.00 | 5.10 |
| Payments (billion dollars) | |||||||
| Regular benefits | 31.22 | 30.15 | 31.41 | 38.14 | 75.34 | 63.04 | 48.52 |
| Extended benefits | .00 | .02 | .02 | .02 | 4.12 | 8.00 | 11.92 |
| EUC08 (1) | .00 | .00 | .00 | 3.55 | 32.66 | 72.09 | 52.66 |
| Federal Additional Compensation | .00 | .00 | .00 | .00 | 6.48 | 11.71 | 1.92 |
| 1.38 | 1.31 | 1.30 | 1.36 | 1.09 | 1.52 | 1.58 | |
| All UI program payments (billion dollars) | 32.61 | 31.46 | 32.70 | 43.05 | 119.69 | 156.37 | 116.80 |
| State tax collections (billion dollars) | 35.08 | 35.94 | 33.71 | 32.22 | 31.14 | 38.28 | 49.27 |
| Notes: (1) EUC08 = Emergency Unemployment Compensation 2008. (2) UCFE = Unemployment Compensation for Federal Employees. (3) UCX = Unemployment Compensation for Ex-servicemembers. Note: Payments for individual UI programs may not add to totals because of rounding. Source: UI Outlook, President's Budget FY 2013 (U.S. Department of Labor, Office of Unemployment Insurance, March 2012). | |||||||
During the recession, media attention was focused on the enormous increase in the number of long-term unemployed workers, or those defined in the CPS as unemployed for more than 26 weeks. Because most states extend regular UI benefits for 26 weeks, the CPS definition of long-term unemployment corresponds largely to those UI recipients who have exhausted their entitlement to regular benefits. Between 2007 and 2010, the number of UI beneficiaries who exhausted their regular benefits increased from 2.6 million to 7.0 million.
The regular UI program is considered adequate when the economy is not in a recession and unemployment rates are at low levels, commensurate with full employment. Starting in the 1950s, however, Congress found the regular program inadequate in times of high unemployment rates, when more workers exhaust their basic 26-week entitlement. In responding to recessions in 1958 and 1961, Congress enacted temporary extended benefit programs to meet the short-term need for additional UI benefits. In 1970, Congress enacted a permanent Extended Benefits program designed to eliminate the need for temporary extensions by setting targets that automatically trigger extended benefits when unemployment rates exceed prespecified levels. In fact, the permanent Extended Benefits program became a second-tier program, and Congress enacted additional temporary third-tier programs in response to recessions in 1971, 1974, 1982, 1991, 2002, and 2008. The temporary recessionary extensions that began in 1971 resulted in much longer potential durations of benefits, but, until 2009, the total potential duration of regular UI, Extended Benefits, and temporary emergency extensions was never greater than 72 weeks and, frequently, not greater than 52 weeks.4
In 2008, Congress took a series of actions that eventually led to the possibility of UI recipients receiving a maximum of 99 weeks of benefits. In response to the surge in long-term unemployment, Congress created a temporary third-tier UI program—the Emergency Unemployment Compensation program. In a further unprecedented step, it liberalized the permanent Extended Benefits program by extending access to, and the duration of, benefits. Congress also temporarily transferred Extended Benefits funding from the Unemployment Trust Fund to general revenue, fully relieving state UI trust fund accounts of any financial responsibility for the program. Between November 2009 and September 2012, the combination of the three UI programs yielded an unprecedented duration of potential benefits that reached up to 99 weeks.
Although state UI accounts in the Unemployment Trust Fund are supposed to build up during nonrecessionary periods (so that they can fund state regular UI benefits during recessions), between 2005 and 2007, state UI tax collections barely exceeded the regular UI benefit payments; thus, fund balances were not building up for the next recession. As the increase in the number of worker layoffs accelerated during the first few months of the recession, regular UI benefits surged, reaching $75 billion in fiscal year 2009, while state UI tax collections responded slowly. In fiscal year 2011, regular UI benefit payments were two-and-a-half times the amount of state collections. As a result, by the end of fiscal year 2011, states had borrowed massively from the federal loan account in the Unemployment Trust Fund, with the outstanding state loan balance reaching $38.2 billion.
ARRA included a variety of UI provisions that were designed to ease the problems of both the unemployed and the financially strapped state UI programs. ARRA provisions not only extended the temporary Emergency Unemployment Compensation program through December 26, 2009, but also funded a temporary increase of $25 in weekly UI benefits. The increase, called Federal Additional Compensation, was made available to all unemployed workers participating in all UI programs and came at a cost of $20.1 billion for the period 2009–2011. The permanent Extended Benefits program became 100 percent federally funded, and states could temporarily ease program eligibility requirements to expand the number of unemployed workers eligible for the benefits. These Extended Benefits provisions cost the federal government $24.0 billion between 2009 and 2011. The taxation of UI benefits also was partially suspended. State UI agencies were given relief from the repayment and accrual of interest on their outstanding federal loans. Further, state UI agencies received $500 million in additional UI administrative funds to respond to increased workloads. Finally, to increase program eligibility, UI Modernization provisions were enacted as part of ARRA.5
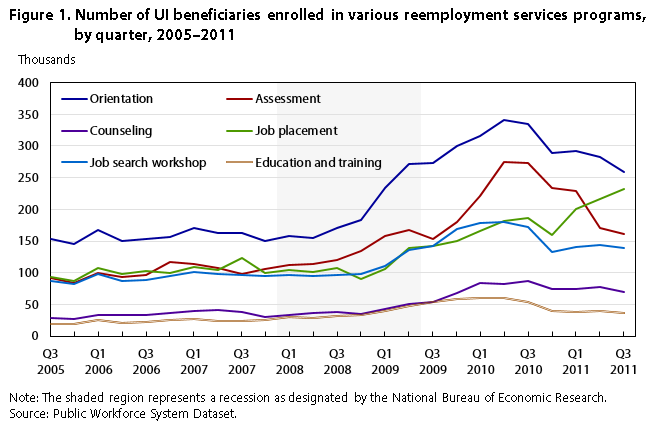
State UI programs refer their claimants to the Employment Service for job referral and reemployment services. Since 1993, the UI program also refers targeted claimants to local workforce offices for reemployment services under the Worker Profiling and Reemployment Services system. At the local offices, UI claimants can receive referrals to jobs, assessments, counseling, labor market information, job search workshops, and referrals to training. During the recession, the local offices contributed to a large increase in reemployment services, an increase funded by a $250 million appropriation in the form of Reemployment Services Grants, part of ARRA. These grants were appropriated to the Employment Service to serve UI claimants. Despite the additional funding, the local workforce offices quickly experienced resource constraints, as the number of workers seeking services expanded rapidly. As a result, low-cost services—orientations and assessments—saw the largest enrollments, while the more expensive and intensive services of counseling, and education and training, experienced smaller increases.6 (See figure 1.)
| Quarter and year | Orientation | Assessment | Counseling | Job placement | Job search workshop | Education and training |
|---|---|---|---|---|---|---|
Q3 2005 | 153,057 | 91,264 | 28,449 | 93,878 | 87,360 | 18,638 |
Q4 2005 | 145,845 | 84,338 | 26,446 | 86,873 | 81,811 | 19,381 |
Q1 2006 | 168,149 | 99,326 | 33,626 | 106,708 | 97,270 | 24,678 |
Q2 2006 | 149,880 | 92,859 | 32,672 | 97,453 | 87,682 | 20,562 |
Q3 2006 | 152,691 | 96,398 | 32,764 | 102,536 | 89,184 | 22,183 |
Q4 2006 | 156,948 | 117,575 | 35,775 | 98,861 | 95,428 | 24,777 |
Q1 2007 | 169,816 | 113,522 | 40,099 | 109,569 | 101,782 | 26,625 |
Q2 2007 | 163,146 | 107,415 | 41,068 | 104,570 | 97,805 | 24,075 |
Q3 2007 | 162,014 | 98,329 | 37,546 | 123,570 | 95,989 | 24,260 |
Q4 2007 | 149,776 | 106,400 | 30,343 | 100,013 | 94,878 | 25,809 |
Q1 2008 | 158,620 | 111,661 | 32,603 | 104,876 | 96,106 | 30,789 |
Q2 2008 | 154,866 | 114,378 | 36,849 | 101,286 | 94,681 | 28,876 |
Q3 2008 | 170,878 | 120,810 | 37,928 | 107,228 | 96,298 | 31,827 |
Q4 2008 | 182,906 | 134,010 | 35,647 | 90,812 | 98,060 | 32,807 |
Q1 2009 | 233,177 | 157,300 | 43,295 | 106,273 | 111,174 | 38,850 |
Q2 2009 | 271,023 | 167,154 | 50,959 | 139,442 | 136,108 | 47,506 |
Q3 2009 | 272,343 | 153,476 | 53,107 | 141,943 | 142,098 | 54,213 |
Q4 2009 | 299,108 | 180,104 | 67,302 | 150,115 | 168,366 | 58,650 |
Q1 2010 | 316,160 | 220,768 | 84,440 | 166,054 | 178,947 | 59,473 |
Q2 2010 | 341,362 | 274,008 | 82,889 | 180,968 | 180,237 | 59,342 |
Q3 2010 | 334,178 | 273,048 | 87,275 | 186,410 | 172,778 | 53,233 |
Q4 2010 | 288,315 | 233,262 | 73,615 | 159,131 | 132,235 | 39,336 |
Q1 2011 | 292,598 | 228,445 | 74,846 | 201,215 | 141,289 | 38,470 |
Q2 2011 | 282,211 | 170,427 | 77,245 | 215,748 | 144,350 | 38,977 |
Q3 2011 | 259,607 | 161,433 | 69,261 | 231,419 | 139,262 | 36,378 |
Source: Public Workforce System Dataset. | ||||||
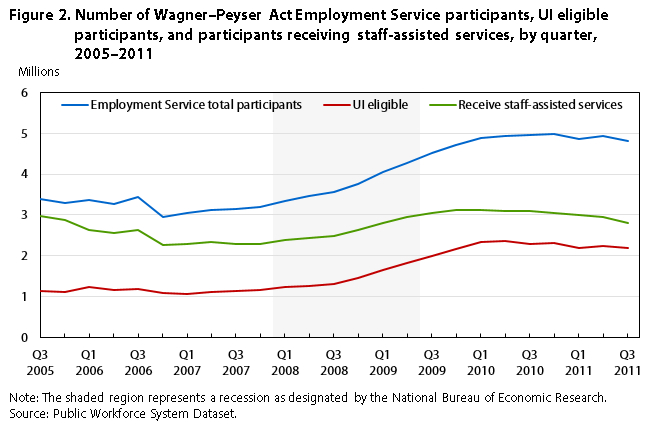
The Employment Service serves all workers, whether they enter the doors of the local workforce offices or seek services online. Because the number of workers served fluctuates over the business cycle, during 2008, the Employment Service experienced a sharp increase in the number of participants seeking its services, with no initial increase in resources. Only in February 2009, with the passage of ARRA, did the Employment Service receive additional funding of $150 million for basic grants to states and $250 million for reemployment services for UI claimants. Between program year 2006 and program year 2009, the number of active job seekers participating in Wagner–Peyser Act programs increased nationally by over 50 percent—from 14.7 million to 22.4 million. (See table 3.) Similarly, the number of participants receiving staff-assisted services increased by half during this period, while the number of eligible UI claimants served more than doubled. Clearly, the percent increase in individuals being served and the percent increase in services provided were much greater than the percent increase in Employment Service funding from ARRA.
| Category | 2006 | 2007 | 2008 | 2009 | 2010 |
|---|---|---|---|---|---|
| Total participants | 14.7 | 17.8 | 19.6 | 22.4 | 21.8 |
| Received staff-assisted services | 9.4 | 9.7 | 11.9 | 14.2 | 13.4 |
| Career guidance | 1.9 | 1.8 | 2.8 | 3.3 | 3.4 |
| Job search activities | 4.4 | 4.8 | 5.8 | 7.7 | 6.2 |
| Referred to employment | 4.7 | 4.7 | 4.8 | 5.8 | 5.2 |
| Entered employment rate (percent) | 60.0 | 64.0 | 59.0 | 48.0 | 48.0 |
| Eligible UI claimants | 4.5 | 5.6 | 8.3 | 10.7 | 10.0 |
| Source: U.S. Department of Labor, ETA 9002 reports. | |||||
Although between 55 percent and 65 percent of Employment Service participants received staff-assisted services, the workforce system was under strain; participants frequently were directed to computer rooms in the workforce offices, searching for work mostly on their own.7 While many participants received some job search assistance or were referred to jobs, the percentage of workers who found jobs after being served declined from 64 percent in 2007 to 48 percent in 2009.
| Quarter and year | Employment Service total participants | UI eligible | Receive staff-assisted services |
|---|---|---|---|
Q3 2005 | 3,383,963 | 1,143,249 | 2,982,878 |
Q4 2005 | 3,304,209 | 1,117,141 | 2,882,911 |
Q1 2006 | 3,362,428 | 1,228,847 | 2,637,007 |
Q2 2006 | 3,259,593 | 1,169,492 | 2,555,038 |
Q3 2006 | 3,449,174 | 1,196,089 | 2,623,389 |
Q4 2006 | 2,962,450 | 1,080,670 | 2,256,619 |
Q1 2007 | 3,045,005 | 1,059,991 | 2,282,869 |
Q2 2007 | 3,124,169 | 1,107,798 | 2,332,372 |
Q3 2007 | 3,147,341 | 1,132,079 | 2,294,392 |
Q4 2007 | 3,196,555 | 1,163,925 | 2,285,545 |
Q1 2008 | 3,353,222 | 1,234,180 | 2,385,520 |
Q2 2008 | 3,471,006 | 1,258,230 | 2,434,399 |
Q3 2008 | 3,573,811 | 1,297,386 | 2,477,680 |
Q4 2008 | 3,762,491 | 1,447,585 | 2,636,634 |
Q1 2009 | 4,048,405 | 1,641,744 | 2,803,110 |
Q2 2009 | 4,273,683 | 1,816,112 | 2,954,561 |
Q3 2009 | 4,509,072 | 1,999,235 | 3,043,114 |
Q4 2009 | 4,706,310 | 2,174,296 | 3,120,994 |
Q1 2010 | 4,877,374 | 2,335,787 | 3,130,664 |
Q2 2010 | 4,942,837 | 2,350,989 | 3,094,178 |
Q3 2010 | 4,957,405 | 2,291,602 | 3,094,190 |
Q4 2010 | 4,976,778 | 2,303,554 | 3,058,983 |
Q1 2011 | 4,862,646 | 2,199,509 | 3,003,712 |
Q2 2011 | 4,931,191 | 2,242,989 | 2,961,590 |
Q3 2011 | 4,817,840 | 2,189,468 | 2,811,021 |
Source: Public Workforce System Dataset. | |||
Most of the increase in the number of participants was due to UI claimants who had permanently lost their jobs; these claimants represented 6.2 million of the 7.7 million participants added between 2006 and 2009. As shown in figure 2, the increase in the quarterly number of Employment Service participants accelerated near the end of 2007 and continued to climb until it crested in the third quarter of 2010, at nearly 5 million individuals. The number of participants receiving staff-assisted services followed closely, but at a slower pace. It leveled off at 3.1 million a few quarters before the peak and slowly declined throughout the remainder of the recession and the ARRA funding period.
| Quarter and year | Expenditures with ARRA | Expenditures without ARRA | Participants |
|---|---|---|---|
Q3 2005 | $181,325,533 | $181,325,533 | 2,975,715 |
Q4 2005 | 185,296,807 | 185,296,807 | 2,878,066 |
Q1 2006 | 154,891,119 | 154,891,119 | 2,933,479 |
Q2 2006 | 124,929,126 | 124,929,126 | 2,819,271 |
Q3 2006 | 173,545,576 | 173,545,576 | 3,004,199 |
Q4 2006 | 171,978,452 | 171,978,452 | 2,962,444 |
Q1 2007 | 165,313,287 | 165,313,287 | 3,044,998 |
Q2 2007 | 138,054,130 | 138,054,130 | 3,124,165 |
Q3 2007 | 178,196,538 | 178,196,538 | 3,147,335 |
Q4 2007 | 180,894,077 | 180,894,077 | 3,196,550 |
Q1 2008 | 143,746,568 | 143,746,568 | 3,353,218 |
Q2 2008 | 125,503,383 | 125,503,383 | 3,471,001 |
Q3 2008 | 165,125,097 | 165,125,097 | 3,573,804 |
Q4 2008 | 143,907,546 | 143,907,546 | 3,762,486 |
Q1 2009 | 139,097,945 | 139,097,945 | 4,048,400 |
Q2 2009 | 165,148,946 | 129,235,427 | 4,273,676 |
Q3 2009 | 185,668,805 | 141,124,174 | 4,509,067 |
Q4 2009 | 207,995,024 | 157,199,612 | 4,706,302 |
Q1 2010 | 200,676,963 | 128,853,464 | 4,877,363 |
Q2 2010 | 218,486,773 | 137,842,406 | 4,942,826 |
Q3 2010 | 156,008,416 | 132,473,832 | 4,957,401 |
Q4 2010 | 181,501,786 | 173,395,463 | 4,976,774 |
Q1 2011 | 191,012,683 | 175,007,229 | 4,862,637 |
Q2 2011 | 149,720,314 | 147,711,506 | 4,931,185 |
Q3 2011 | 178,972,659 | 178,972,659 | 4,817,832 |
Note: Pennsylvania and Texas are not included in the calculation of total average expenditures, because data for these two states are missing from Wagner–Peyser Act Employment Service participation data. Source: Public Workforce System Dataset. | |||
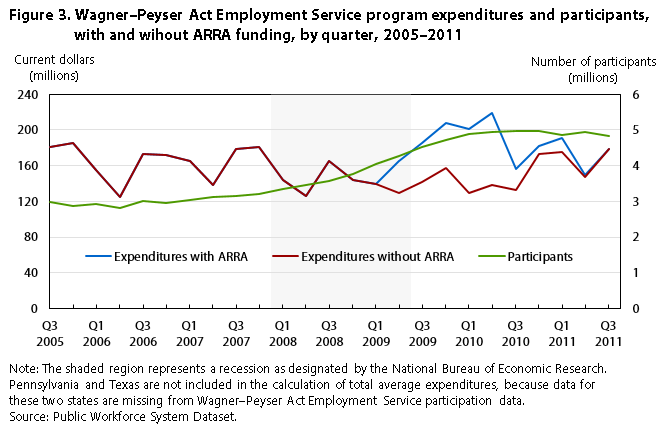
The Employment Service initially faced the increased flow of program participants with the same budget and staffing as it had before the recession. The Employment Service budget had been fairly constant in nominal terms for a long period, ranging between $700 million and $800 million per year since 1996. Supplemental funding became available in early 2009.8 Figure 3 shows that while basic funding for the Employment Service programs was relatively flat throughout the recessionary period, the ARRA funding substantially accommodated the increase in participants during 2009 and early 2010, even though funding per participant did not return to prerecession levels.
In addition to providing basic reemployment services similar to the Employment Service programs, the two WIA adult programs—the WIA Dislocated Worker program and the WIA Adult program—provide more intensive services to unemployed adults than those typically provided through the Employment Service. The WIA Dislocated Worker program, in particular, played a major role during the ARRA period in providing permanently unemployed workers with intensive services and training.
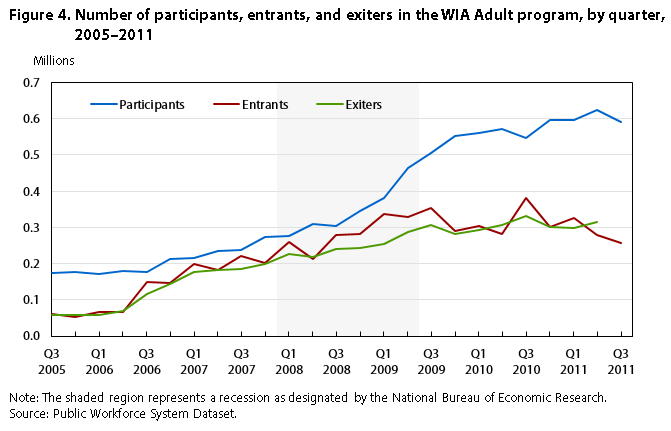
WIA Adult program. While the number of participants in the WIA Adult program increased during the recession, that number had been going up for more than a year before the recession began and long before the enactment of ARRA. Figure 4 shows the increase, starting in 2006, in the number of entrants, participants, and program completers (“exiters”).9 The primary reason for the increase was the 2006 issuance of reporting instructions by DOL that permitted states to co-enroll Employment Service participants (and other program participants) in WIA programs. Several states (including New York) began co-enrolling all Employment Service participants, swelling the number of WIA participants not only within those states but nationally as well.
| Quarter and year | Participants | Entrants | Exiters |
|---|---|---|---|
Q3 2005 | 173,336 | 61,951 | 57,507 |
Q4 2005 | 177,780 | 51,637 | 58,052 |
Q1 2006 | 171,365 | 66,756 | 57,152 |
Q2 2006 | 180,969 | 66,662 | 70,318 |
Q3 2006 | 177,313 | 150,644 | 115,914 |
Q4 2006 | 212,043 | 146,076 | 142,815 |
Q1 2007 | 215,304 | 197,715 | 176,921 |
Q2 2007 | 236,098 | 182,952 | 181,323 |
Q3 2007 | 237,727 | 221,595 | 185,360 |
Q4 2007 | 273,962 | 202,325 | 199,502 |
Q1 2008 | 276,785 | 260,728 | 227,912 |
Q2 2008 | 309,601 | 214,151 | 218,548 |
Q3 2008 | 305,204 | 280,290 | 241,405 |
Q4 2008 | 344,089 | 281,237 | 243,091 |
Q1 2009 | 382,235 | 336,485 | 253,578 |
Q2 2009 | 465,142 | 327,649 | 288,655 |
Q3 2009 | 504,136 | 354,294 | 305,946 |
Q4 2009 | 552,484 | 288,989 | 281,575 |
Q1 2010 | 559,898 | 304,589 | 292,519 |
Q2 2010 | 571,968 | 280,714 | 306,581 |
Q3 2010 | 546,101 | 381,480 | 331,301 |
Q4 2010 | 596,280 | 301,316 | 300,472 |
Q1 2011 | 597,124 | 326,123 | 298,271 |
Q2 2011 | 624,976 | 279,089 | 313,863 |
Q3 2011 | 590,202 | 256,361 | – |
Source: Public Workforce System Dataset. | |||
The nature of the WIA Adult program changed with the onset of the recession. Longer unemployment durations translated into longer participation in the WIA Adult program. Thus, between the third quarter of 2008 and the third quarter of 2009, the gap between the number of entrants and exiters widened, leading to a surge in the number of active participants. During that period, the number of exiters continued to climb, but not as fast as the number of new program entrants. Shortly after the third quarter of 2009, however, the number of entrants and exiters leveled off and remained flat at about 300,000 new entrants and exiters per quarter thereafter, except for a one-quarter spike of entrants in the third quarter of 2010.10
| Quarter and year | Days in program | Number of services |
|---|---|---|
Q3 2005 | 295 | 3.5 |
Q4 2005 | 320 | 3.5 |
Q1 2006 | 267 | 3.5 |
Q2 2006 | 282 | 3.4 |
Q3 2006 | 147 | 2.3 |
Q4 2006 | 119 | 2.2 |
Q1 2007 | 105 | 2.1 |
Q2 2007 | 127 | 2.2 |
Q3 2007 | 104 | 2.3 |
Q4 2007 | 116 | 2.3 |
Q1 2008 | 98 | 2.2 |
Q2 2008 | 126 | 2.5 |
Q3 2008 | 107 | 2.7 |
Q4 2008 | 106 | 2.7 |
Q1 2009 | 103 | 2.8 |
Q2 2009 | 123 | 2.9 |
Q3 2009 | 111 | 2.9 |
Q4 2009 | 131 | 2.9 |
Q1 2010 | 134 | 2.9 |
Q2 2010 | 154 | 2.9 |
Q3 2010 | 133 | 2.6 |
Q4 2010 | 143 | 2.7 |
Q1 2011 | 145 | 2.7 |
Q2 2011 | 181 | 2.6 |
Source: Public Workforce System Dataset. | ||
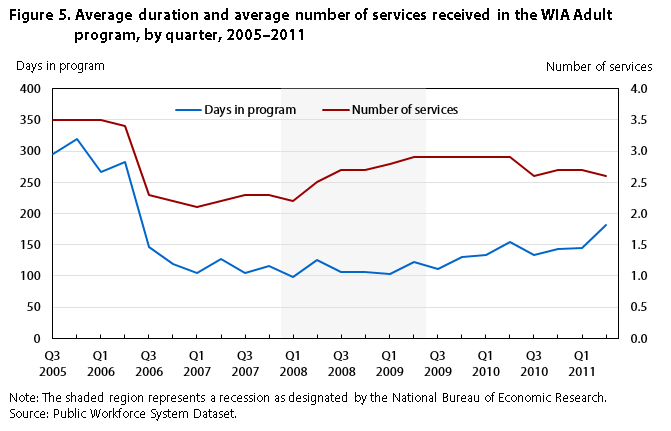
The uptick in the number and percentage of WIA Adult participants receiving intensive services was paralleled by an increase in the average number of reemployment services. As shown in Figure 5, that average number climbed from 2.2 services in the first quarter of 2008 to 2.9 services in the third quarter of 2009, indicating that participants were not only participating in reemployment services that required more staff time but also receiving a greater number of services. Another indication of the greater number and intensity of services was the increase in the number of days in the program. This increase in receipt of services occurred about four quarters after the number of services started to rise. However, the increase in average duration in the program also could be attributed to the difficulty in finding employment, as the number of days continued to climb even after the number of services received began to decline.11
| Quarter and year | Expenditures with ARRA | Expenditures without ARRA | Participants |
|---|---|---|---|
Q3 2005 | $166,570,650 | $166,570,650 | 234,967 |
Q4 2005 | 216,114,095 | 216,114,095 | 229,296 |
Q1 2006 | 219,009,230 | 219,009,230 | 237,999 |
Q2 2006 | 242,400,570 | 242,400,570 | 247,522 |
Q3 2006 | 178,706,602 | 178,706,602 | 327,840 |
Q4 2006 | 226,193,824 | 226,193,824 | 357,952 |
Q1 2007 | 218,910,848 | 218,910,848 | 412,720 |
Q2 2007 | 246,716,242 | 246,716,242 | 418,749 |
Q3 2007 | 197,983,449 | 197,983,449 | 459,127 |
Q4 2007 | 241,268,776 | 241,268,776 | 476,139 |
Q1 2008 | 198,057,614 | 198,057,614 | 537,330 |
Q2 2008 | 206,848,696 | 206,848,696 | 523,527 |
Q3 2008 | 179,177,200 | 179,177,200 | 585,238 |
Q4 2008 | 219,123,783 | 219,123,783 | 625,060 |
Q1 2009 | 268,027,959 | 268,027,959 | 718,451 |
Q2 2009 | 299,273,968 | 268,027,959 | 792,499 |
Q3 2009 | 272,247,776 | 186,124,452 | 858,029 |
Q4 2009 | 336,982,979 | 237,549,956 | 841,044 |
Q1 2010 | 309,750,820 | 219,429,343 | 864,077 |
Q2 2010 | 314,022,311 | 222,047,016 | 852,256 |
Q3 2010 | 247,414,129 | 199,805,998 | 927,170 |
Q4 2010 | 254,856,765 | 224,396,801 | 897,253 |
Q1 2011 | 262,302,999 | 210,767,314 | 922,962 |
Q2 2011 | 227,707,008 | 203,128,949 | 903,813 |
Source: Public Workforce System Dataset. | |||
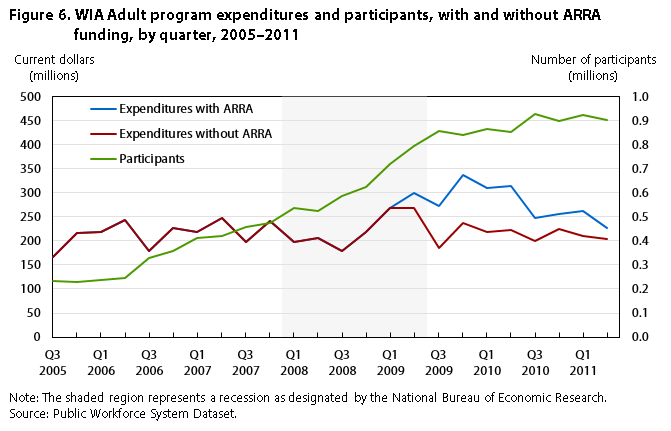
As the recession continued to deepen in 2008, the increase in the number of WIA Adult participants accelerated. (See figure 6.) In 2009, the ARRA supplemental funding helped accommodate the increase in participation, although the additional funds did not keep pace with the influx of participants.
WIA Dislocated Worker program.
| Quarter and year | Participants | Entrants | Exiters |
|---|---|---|---|
Q3 2005 | 153,884 | 60,677 | 47,972 |
Q4 2005 | 166,589 | 59,727 | 54,148 |
Q1 2006 | 172,168 | 62,762 | 66,386 |
Q2 2006 | 168,544 | 48,024 | 61,325 |
Q3 2006 | 155,243 | 70,710 | 70,432 |
Q4 2006 | 155,521 | 60,392 | 65,063 |
Q1 2007 | 150,850 | 63,315 | 61,905 |
Q2 2007 | 152,260 | 56,044 | 69,752 |
Q3 2007 | 138,552 | 58,445 | 58,347 |
Q4 2007 | 138,650 | 59,253 | 55,249 |
Q1 2008 | 142,654 | 70,519 | 62,168 |
Q2 2008 | 151,005 | 64,231 | 63,258 |
Q3 2008 | 151,978 | 87,859 | 65,645 |
Q4 2008 | 174,192 | 111,738 | 76,515 |
Q1 2009 | 209,415 | 167,674 | 91,909 |
Q2 2009 | 285,180 | 175,285 | 124,164 |
Q3 2009 | 336,301 | 177,973 | 130,501 |
Q4 2009 | 383,773 | 158,920 | 132,455 |
Q1 2010 | 410,238 | 194,262 | 152,054 |
Q2 2010 | 452,446 | 166,341 | 166,957 |
Q3 2010 | 451,830 | 226,167 | 182,357 |
Q4 2010 | 495,640 | 184,218 | 176,269 |
Q1 2011 | 503,589 | 199,628 | 177,689 |
Q2 2011 | 525,528 | 162,648 | 183,531 |
Q3 2011 | 504,645 | 148,226 | – |
Source: Public Workforce System Dataset. | |||
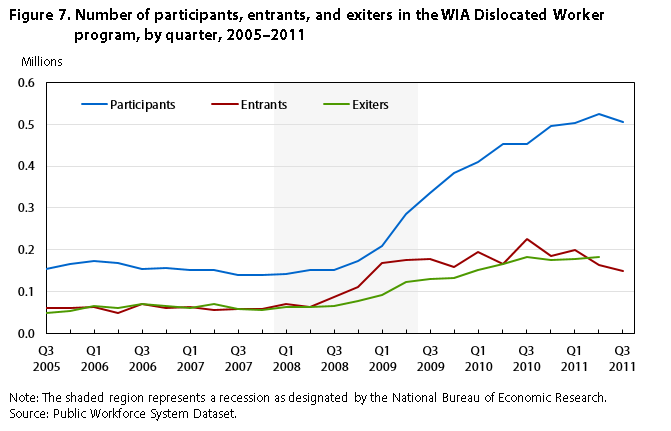
The WIA Dislocated Worker program provides services to experienced workers who have permanently lost their jobs through no fault of their own. The program is highly responsive to increases in unemployment. Consequently, as the unemployment rolls swelled during 2008, the number of entrants into the WIA Dislocated Worker program also increased. Figure 7 shows the flow of new entrants into the program. From 2005 to the middle of 2008, the number of new entrants averaged approximately 61,000 per quarter. As the recession set in, the number of new entrants increased sharply. Between the second quarter of 2008 and the second quarter of 2009, the number of unemployed increased by 6 million, swelling the ranks of the unemployed to more than 14 million, an increase of 74 percent. During that 1-year period, the number of entrants into the WIA Dislocated Worker program increased by 110,000 per quarter, a much larger, 173-percent, increase.
| Quarter and year | Days in program | Number of services |
|---|---|---|
Q3 2005 | 359 | 3.2 |
Q4 2005 | 292 | 3.3 |
Q1 2006 | 256 | 3.6 |
Q2 2006 | 306 | 3.5 |
Q3 2006 | 238 | 2.9 |
Q4 2006 | 214 | 3 |
Q1 2007 | 220 | 3.1 |
Q2 2007 | 257 | 3 |
Q3 2007 | 236 | 3.1 |
Q4 2007 | 213 | 2.8 |
Q1 2008 | 191 | 2.8 |
Q2 2008 | 217 | 3 |
Q3 2008 | 190 | 3 |
Q4 2008 | 155 | 3.1 |
Q1 2009 | 127 | 3.3 |
Q2 2009 | 140 | 3.4 |
Q3 2009 | 140 | 3.5 |
Q4 2009 | 157 | 3.3 |
Q1 2010 | 157 | 3.2 |
Q2 2010 | 189 | 3 |
Q3 2010 | 178 | 2.7 |
Q4 2010 | 182 | 2.7 |
Q1 2011 | 195 | 2.7 |
Q2 2011 | 251 | 2.6 |
Source: Public Workforce System Dataset. | ||
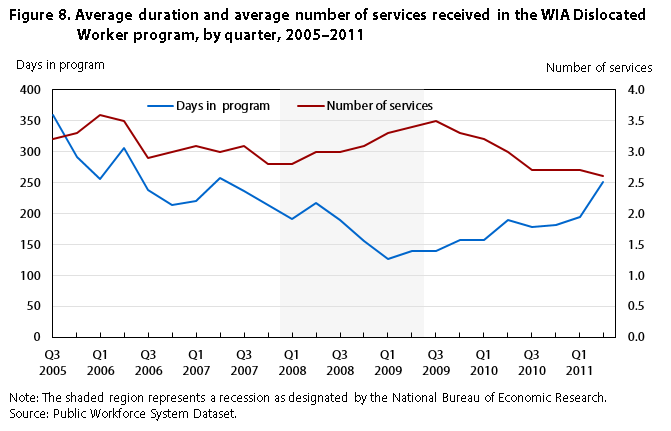
As durations of unemployment increased, more participants in the WIA Dislocated Worker program remained in it for longer periods and the rate of exiting the program declined. Starting in the second quarter of 2009, the average period of participation in the program began to increase. (See figure 8.) This occurred at the same time as ARRA funding became available, but the upward trend continued throughout the entire funding period, long after the number and percentage of exiters receiving training declined. Moreover, the average number of services received by program participants trended downward during most of this period. Although the increased usage of more intensive services may have contributed to the increased duration in program participation (at least in the early part of the ARRA funding period), this cannot explain the continued increase in the length of participant stay in the program, because the percentage of participants receiving intensive services and training fell after the third quarter of 2009.
Because training was seen as prudent during a long unemployment spell, when many workers did not have the option to return to work, federal guidance to state workforce agencies regarding ARRA funding stressed that training should be emphasized. In response, state workforce agencies enrolled a large number of workers in training during the 2 years of WIA supplemental funding availability. Enrollment in training for the two WIA programs increased by 56 percent from 2008 to 2009 and increased further in 2010, although enrollment during the 3-year period was limited to a small portion of workers completing participation in the WIA programs. (See table 4.)
| Year | WIA program | All exiters | Core services only | Core and intensive services only | Training | Training/Exiters |
|---|---|---|---|---|---|---|
| 2005 | Adult | 243,030 | 60,524 | 74,671 | 107,834 | – |
| Dislocated Worker | 229,832 | 60,652 | 90,141 | 79,038 | – | |
| Total | 474,862 | 121,176 | 164,812 | 186,872 | .40 | |
| 2006 | Adult | 616,973 | 413,388 | 94,314 | 104,271 | – |
| Dislocated Worker | 267,152 | 125,161 | 67,853 | 74,138 | – | |
| Total | 884,125 | 543,549 | 162,167 | 178,409 | .20 | |
| 2007 | Adult | 831,322 | 595,251 | 124,507 | 111,564 | – |
| Dislocated Worker | 239,022 | 114,425 | 62,955 | 61,642 | – | |
| Total | 1,070,344 | 709,676 | 187,462 | 173,206 | .16 | |
| 2008 | Adult | 1,026,729 | 657,268 | 260,139 | 109,322 | – |
| Dislocated Worker | 358,233 | 195,649 | 106,412 | 56,172 | – | |
| Total | 1,384,962 | 852,917 | 366,551 | 165,494 | .12 | |
| 2009 | Adult | 1,186,621 | 687,833 | 346,503 | 152,285 | – |
| Dislocated Worker | 581,967 | 273,039 | 203,383 | 105,555 | – | |
| Total | 1,768,588 | 960,862 | 549,886 | 257,840 | .15 | |
| 2010 | Adult | 1,243,907 | 763,787 | 327,307 | 152,813 | – |
| Dislocated Worker | 719,846 | 370,577 | 221,712 | 127,557 | – | |
| Total | 1,963,753 | 1,134,364 | 549,019 | 280,370 | .14 | |
| Source: U.S. Department of Labor, Workforce Investment Act Standardized Report Data reporting information, various years. | ||||||
| Quarter and year | Expenditures with ARRA | Expenditures without ARRA | Participants |
|---|---|---|---|
Q3 2005 | $210,178,545 | $210,178,545 | 214,547 |
Q4 2005 | 246,486,957 | 246,486,957 | 226,304 |
Q1 2006 | 268,076,426 | 268,076,426 | 234,922 |
Q2 2006 | 374,683,569 | 374,683,569 | 216,563 |
Q3 2006 | 260,419,091 | 260,419,091 | 225,938 |
Q4 2006 | 277,905,263 | 277,905,263 | 215,840 |
Q1 2007 | 284,547,317 | 284,547,317 | 214,022 |
Q2 2007 | 355,051,919 | 355,051,919 | 208,163 |
Q3 2007 | 230,162,401 | 230,162,401 | 196,871 |
Q4 2007 | 291,161,471 | 291,161,471 | 197,822 |
Q1 2008 | 312,736,624 | 312,736,624 | 213,119 |
Q2 2008 | 327,767,971 | 327,767,971 | 215,177 |
Q3 2008 | 244,949,782 | 244,949,782 | 239,762 |
Q4 2008 | 276,955,672 | 276,955,672 | 285,840 |
Q1 2009 | 245,628,145 | 245,628,145 | 377,024 |
Q2 2009 | 290,214,351 | 245,628,145 | 460,350 |
Q3 2009 | 346,935,533 | 217,627,449 | 514,083 |
Q4 2009 | 409,624,644 | 257,380,025 | 542,513 |
Q1 2010 | 418,699,419 | 245,031,709 | 604,322 |
Q2 2010 | 508,238,204 | 310,267,934 | 618,605 |
Q3 2010 | 337,637,273 | 220,355,970 | 677,821 |
Q4 2010 | 402,174,520 | 279,534,354 | 679,707 |
Q1 2011 | 377,359,475 | 261,319,512 | 703,051 |
Q2 2011 | 452,956,934 | 332,619,201 | 688,033 |
Source: Public Workforce System Dataset. | |||
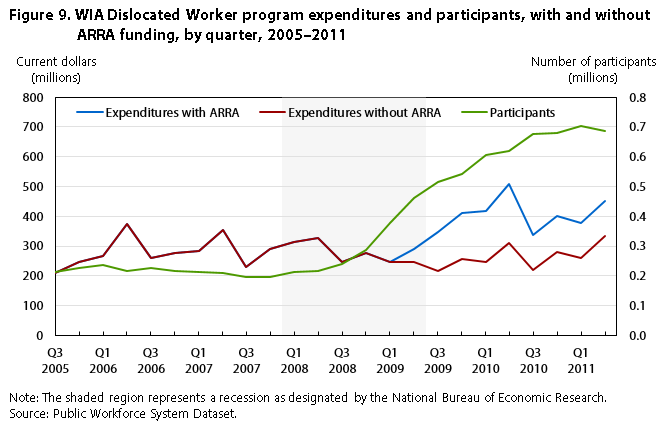
WIA Dislocated Worker basic appropriations and expenditures, measured in nominal terms, remained fairly constant before, during, and after the recession. The number of program participants, however, began to increase sharply in 2008, with the onset of the recession. Although state workforce agencies had to provide services for additional participants without additional funding throughout 2008, ARRA funds became available in 2009 and increased the capacity to provide reemployment services and training to the greatly increased number of participants. (See figure 9.)
THE RECENTLY COMPILED PUBLIC WORKFORCE SYSTEM DATASET permits, for the first time, an analytical assessment of the response of the public workforce system to the 2007–2009 recession. Analysis based on that dataset indicates that the UI, Employment Service, and WIA programs responded quickly to the severe economic downturn. The programs provided assistance to workers as soon as the recession hit, even before supplemental funding was made available through ARRA. As an entitlement program, the UI program started to serve the influx of eligible unemployed as soon as they filed a claim. In June 2008, Congress extended benefits beyond the regular 26 weeks through the permanent Extended Benefits program and the Emergency Unemployment Compensation program. The Employment Service and WIA programs similarly began to serve unemployed workers at the onset of the recession, but their capacity to do so before the ARRA enactment was strained by the lack of additional funding.
ARRA provided supplemental funding for public workforce programs, including UI, allowing them to serve many more participants and enabling states to pay benefits for longer durations. The increased funding also expanded training and job assistance for WIA and Employment Service participants. However, because the increase in participation exceeded the increase in funding, expenditures per participant were lower than they were before the recession.
Stephen A. Wandner, and Randall W. Eberts, "Public workforce programs during the Great Recession," Monthly Labor Review, U.S. Bureau of Labor Statistics, July 2014, https://doi.org/10.21916/mlr.2014.26
1 An early version of this dataset is available to the public at http://www.data.gov/.
2 The figures in this article were originally developed by Randall W. Eberts and Stephen A. Wandner for their chapter “Data analysis of the implementation of the Recovery Act: workforce development and unemployment insurance provisions,” in Burt S. Barnow and Richard A. Hobbie, eds., The American Recovery and Reinvestment Act: the role of workforce programs (Kalamazoo, MI: W. E. Upjohn Institute for Employment Research, 2013), pp. 267–307, http://research.upjohn.org/up_press/223/.
3 Although a permanent Extended Benefits program was enacted in 1970, in recent years, few states qualify under its stringent eligibility criteria. Congress enacts temporary extensions of UI benefits only during periods of high unemployment.
4 Julie M. Whittaker and Katelin P. Isaacs, Extended unemployment compensation benefits during recessions, CRS report for Congress RL34340 (Congressional Research Service, May 2013), www.fas.org/sgp/crs/misc/RL34340.pdf.
5 Alison M. Shelton, Kathleen Romig, and Julie M. Whittaker, Unemployment insurance provisions in the American Recovery and Reinvestment Act of 2009, CRS report for Congress R40368 (Congressional Research Service, March 2009), https://crsreports.congress.gov/product/pdf/R/R40368.
6 Eberts and Wandner, “Data analysis of the implementation of the Recovery Act.”
7 Ibid. See also Stephen A. Wandner, “The public workforce system’s response to declining funding after the Great Recession,” Unemployment and Recovery Project working paper 5 (The Urban Institute, May 2013), http://www.urban.org/publications/412866.html.
8 Stephen A. Wandner, “The response of the U.S. public workforce system to high unemployment during the Great Recession,” Unemployment and Recovery Project working paper 4 (The Urban Institute, September 2012), http://www.urban.org/UploadedPDF/412679-The-Response-of-the-US-Public-Workforce-System-to-High-Unemployment.pdf.
9 The number of entrants and exiters is a measure of the flow of individuals into and out of the program, whereas the number of participants is a measure of the stock of individuals in the program.
10 According to Job Openings and Labor Turnover Survey data compiled by the Bureau of Labor Statistics, the average monthly number of hires during the second half of 2009 was 1.6 million below the average monthly number of hires from the third quarter of 2005 through the fourth quarter of 2007, a 30-percent reduction.
11 As with the other trends in services, the average duration in the program and the number of services received appear to be influenced by the advent of co-enrollment in 2006. Immediately before that time, the average number of services was around 3.5 and the average duration in the program was around 300 days. By the fourth quarter of 2006, these numbers had fallen to 2.2 services and 119 days, respectively.