
An official website of the United States government
An official website of the United States government
The .gov means it's official.
Federal government websites often end in .gov or .mil. Before sharing sensitive information,
make sure you're on a federal government site.
The site is secure.
The
https:// ensures that you are connecting to the official website and that any
information you provide is encrypted and transmitted securely.
Crossref 0
“Hoe Handle Medicine”, Bad Medicine, 2025.
Sisters Magdalene, Bad Medicine, 2025.
“Care and Maintenance”, Bad Medicine, 2025.
Epilogue , Bad Medicine, 2025.
How the Knowledge Economy Works, Knowledge Economies and Knowledge Work, 2019.
Appendix, Bad Medicine, 2025.
Notes, Bad Medicine, 2025.
Bibliography, Bad Medicine, 2025.
Introduction , Bad Medicine, 2025.
“An Ordinary Case of Discipline”, Bad Medicine, 2025.
Knowledge Capital, Knowledge Societies, 2026.
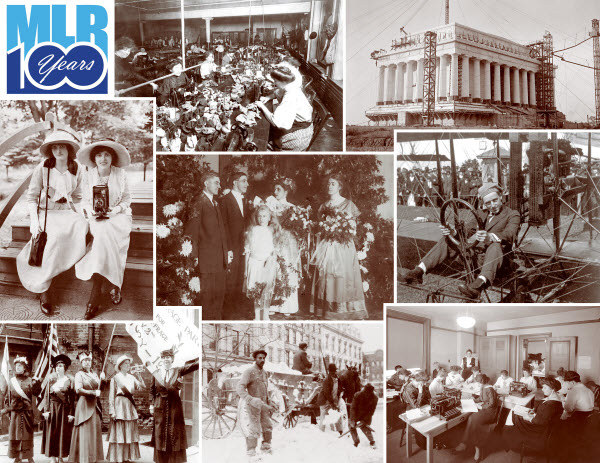
To help mark the Monthly Labor Review’s centennial, the editors invited several producers and users of BLS data to take a look back at the last 100 years. This article is about the life of workers in 1915, the year the MLR began. It discusses population and labor force characteristics plus jobs and wages. It also looks at various facets of everyday life—homes, meals, work commute, and leisure time.
The nature of work has changed dramatically in the 100 years since the first issue of the Monthly Labor Review (MLR) was published in 1915. That year was a transitional time in the United States. About 15 years earlier, the nation had moved from the Gilded Age—characterized by industrialization, a surge in railroad construction, growth in real wages, and an influx of immigrants—to the Progressive Era, in which industrialization and immigration were joined by social activism, scientific management, modernization, and reform.1 Starting in the early 1900s and continuing through 1914, an unprecedented wave of European immigration provided the United States with the labor needed for expansion of the prewar economy and growth of cities.2 In 1915, the United States was still 2 years away from entering World War I, which had begun a year earlier. The 1920 census shows much growth within urban and suburban areas and within the middle class. The urbanization of America, as well as new methods of management and new technology within both the home and the workplace, were changing the nature of work and the daily lives of workers.
To help readers understand what life was like for workers in 1915, this article uses historical data, often in comparison with current data. In addition, information from primary sources and insights from social historians are included. The article begins with a look at demographics in 1915, including age, life expectancy, fertility rates, and race, and then provides an overview of labor force participation rates, education, and unemployment. It goes on to discuss the daily life of workers: their housing, clothing, food, hours, working conditions, leisure time. The emphasis in this article is on the 70 percent of workers in nonfarm occupations.
Current events of 1915. The following list of current events may help set the stage for readers to better understand the world of 1915:
When the Monthly Labor Review began, the majority of the U.S. population was young. More than half (52.4 percent) of the 100 million people living in the United States were less than 25 years old; by comparison, the U.S. population has grown over the last century to more than 321 million, and only one-third of that total is under age 25. Not quite 5 percent of the population in 1915 was age 65 or older, compared with 14 percent today. Life expectancy at birth for people born in 1915 was just 54.5 years, whereas the most recent life expectancy estimate is 78.8 years.3 Indeed, there currently are more than 72,000 American centenarians—that is, people ages 100 and up; they were alive when the MLR made its first appearance!4
Contributing to the growth and young profile of the population in 1915, the total fertility rate was what we now consider relatively high: the number of children that would be born to a woman over her lifetime if she were to live at least to the end of her reproductive years was more than 3. Although the rate rose to 3.7 at the peak of the baby boom in 1957, it had fallen to 1.9 by 2013.5 The 1915 fertility rate is not surprising given that infant mortality was much higher a hundred years ago. In addition, more families lived on farms than do so today, and these families tended to be large to ensure help with farm chores. In 1915, about 1 baby out of 10 died during his or her first year; this contrasts with current U.S. infant mortality, which is 1 death per 168 births.6 The Progressive Era brought with it a belief in science and “modern ways,” and so hospitals started to become the site of childbirth, particularly for suburban, wealthy, and middle-class women. In 1900, almost all births occurred outside of hospitals. By 1915 in Pittsburgh, for instance, the percentage had fallen to 87 percent.7 Today, less than 1 percent of U.S. babies are born outside of hospitals.8
The median age at first marriage in 1915 was about 25 for men and between 21 and 22 for women. This contrasts with over 29 for men and 27 for women in 2015.9 Rather than living alone or with nonrelatives, young women generally lived at home until they got married. Nowadays, most women at least at some point in their lives live apart from their family, and nearly half have cohabited with a partner before marriage.10 Divorce was quite uncommon in 1915, and widowed adults were likely to live with their adult children, so single-person households were rare.
Although the major cause of death in both 1915 and 2015 is the same—heart disease—the next leading causes have changed. In 1915, they were pneumonia and influenza, tuberculosis, and nephritis (kidney disease); today’s leading causes of death are cancer, lower respiratory disease, accidents, and strokes. Pneumonia and influenza continue to claim lives, but Alzheimer’s disease and diabetes each claim more. Despite a resurgence of tuberculosis in 1992, the number of people who die from the disease continues to decline, and the incidence of tuberculosis, particularly among people born in the United States, is relatively low.11 Improved sanitation and hygiene throughout the 20th century, along with less crowded housing and better medical care, help account for the change.
The racial composition of the U.S. population was quite different from that of today. Whites were close to 90 percent of the population in 1915 (separate data weren’t available for non-Hispanic Whites). Now the non-Hispanic White population composes 63 percent of the total U.S. population.12 Similarly, emigrants to the United States hail from different parts of the world today than they did a century ago. About 60 percent of the people who immigrated to the United States in 1915 were from Europe and 34 percent were from North and South America. Currently, most new legal permanent residents are from Asia (40 percent) and North and South America (40 percent), and only an estimated 12 percent of all foreign-born people currently living in the United States are from Europe.13 In 1915, about 13–14 percent of the U.S. population was foreign born. That percentage dropped to a record low of 4.7 percent by 1970; it is now again close to 13 percent.14
About half the population in 1915 lived in rural areas, meaning areas with fewer than 2,500 residents. In 2010, by contrast, only 1 in 5 people lived in a rural area.15 Not surprisingly, mobility within the United States was more limited than it is now, and people born in the United States were likely to stay within their home state. In 1915, about 78 percent of U.S.-born individuals were living in the state in which they had been born, compared with 59 percent in 2010.16
Labor force participation. The 1915 annual average civilian labor force participation rate is estimated at 56.3 percent. This percentage isn’t strictly comparable to the 2015 annual average of 62.7 percent, because of differences in survey coverage and definitions.17 However, despite the similarity in overall labor force participation, the participation rates of men and women were very different from each other 100 years ago. The 1920 census shows that, among people ages 14 and older, the proportion of the population that was in the total labor force was 85 percent for men and 23 percent for women in January of that year. (Civilian labor force data by gender are not available for 1915.) In contrast, the Current Population Survey shows a 2015 annual average civilian labor force participation rate for people ages 16 and older of about 69 percent for men and nearly 57 percent for women. Table 1 points out that young boys were much more likely to be in the labor force in 1920 than now. Not surprisingly, women of all ages are much more likely to be in the labor force now than in 1920. Half of all boys ages 14 to 19 were in the labor force in 1920; nowadays, about one-third of boys age 16 to 19 are in the labor force. Labor force participation among girls those ages hasn’t shown as much change.
| Age | Men | Women | ||
|---|---|---|---|---|
| 1920 | 2015 | 1920 | 2015 | |
| Total, 14 years and older | 84.6 | 69.1 | 22.7 | 56.7 |
| 14–19 years | 51.5 | 34.2 | 28.4 | 34.4 |
| 20–24 years | 89.9 | 73.0 | 37.5 | 68.3 |
| 25–44 years | 95.6 | 89.5 | 21.7 | 73.8 |
| 45–64 years | 90.7 | 78.1 | 16.5 | 66.1 |
| 65 years and older | 55.6 | 23.4 | 7.3 | 15.3 |
| Note: Data for 2015 exclude ages 14 and 15, are for the civilian noninstitutional population, and are from the Current Population Survey. Data for 1920 are from Historical statistics of the United States, colonial times to 1970, bicentennial edition (U.S. Bureau of the Census, 1975). Sources: U.S. Bureau of Labor Statistics and U.S. Census Bureau. | ||||
Education. A century ago, most jobs required little formal schooling, and most of the population had not gone beyond elementary or grammar school. In fact, high school graduates were a rarity: in 1915, only an estimated 18 percent of the population ages 25 and older had completed high school, and only about 14 percent of people ages 14–17 were in high school. Royal Meeker, appointed Commissioner of Labor Statistics by President Woodrow Wilson in 1913, had recently written a New York Times article advocating compulsory public education through the intermediate grades. He noted, “Boys and girls drop out of school at all stages of the educational process, but fail to drop smoothly into any part of our economic system.”18 While failure to graduate remains a concern, more than 86 percent of the U.S. population age 25 in 2010–14 had completed high school or more. The average length of the public school term was about 160 days a century ago, compared with 180 days now, and the average number of days attended in 1915 was only 121.19 Many young girls and boys worked instead of being enrolled in school. In fact, New York City’s State Factory Investigating Commission in 1914 reported that “nearly 75 percent of factory women studied had left school before the eighth grade, as had nearly 40 percent of the female store employees interviewed.”20 The legal age for leaving school was generally 14, compared with 16–18 today.
Unemployment. The economy was volatile a century ago, moving quickly from boom to bust and back again. The annual unemployment rate was relatively high in 1915, at 9.7 percent, as the nation had just experienced the recession of 1913–14. Indeed, “concern with unemployment in a deepening recession led the Bureau to begin studies on the subject;” this resulted in a 1916 publication titled Unemployment in the United States and a regular series of reports on industrial employment.21 Because of wartime demand for manufactured goods, the unemployment rate declined to 4.8 percent in 1916 and reached a low of 1.4 percent in 1918. However, the rate quickly jumped up to nearly 12 percent during the depression of
Now let’s take a look at what it was like to be a worker in 1915.
Homes in 1915. Like workers of today, those living in 1915 lived in various types of housing. If you were alive in 1915, chances are you rented your house or apartment; the ratio of renters to homeowners was about 4 to 1 in 1920.23 In contrast, by 2004, 69 percent of American families owned rather than rented their residence, although that proportion slipped to 64 percent by the fourth quarter of 2015.24 The cost of a home in 1915 was about $3,200 ($75,600 in 2015 dollars), compared with today’s median home value of $183,500.25 Housing expenditures—rent or mortgage payments, utility bills, and purchases of household furnishings and equipment—now account for about 40 percent of consumption spending, compared with less than about a quarter of total personal consumption in 1915.26
Mortgages were typically for just 5 to 7 years and required downpayments ranging from 40 to 50 percent of the home purchase price.27 In contrast, the median downpayment on a new mortgage in 2015 was 10 percent of the purchase price.28 Ethnic groups formed their own loan associations because banks could raise the mortgage rate, reduce the loan term to 3 years, and foreclose after two late payments.29
If you lived in a small town, it likely was identified by its large water tower; many of these water towers still exist today. If you were purchasing a home in that town, you might have done so through a catalog. Contrasting with ornate Victorian residences, the newest house style in 1915 was the bungalow, a bestseller in the mail-order market. In Los Angeles County, where the population tripled from 1904 to 1913, bungalows were the main housing stock in 500 new subdivisions.30 Front porches were prevalent, and they were the site of countless marriage proposals.
Like their modern counterparts, urban dwellers were likely to live in multiple-unit residences. Tenements proliferated on New York City’s Lower East Side and tended to be lived in by people from the same ethnic or racial group as that of the tenement owner. Interestingly, from colonial times until the
Inside workers’ homes. According to a 1913 Journal of Home Economics article written by home economist Mabel Hyde Kittredge, the typical home of a working-class family was crowded, somewhat disorderly, and without modern conveniences. The article described a New York City apartment this way:
A home I know well is a fair sample: a four room flat, rent nineteen dollars, nine in family. It is furnished with cheap elaborateness . . . . The chandelier is draped with tissue paper, the shelves are hung with ruffles and covered with paper napkins . . . . In this, as in the home of every ambitious foreigner, is the plush parlor set. This family of nine has a boarder to help pay the rent. He is a night worker, and in the day time can always be seen asleep in one of the beds. All five children, after school, help the mother at flower making. They receive eight cents a gross for the flowers, and the tiny red leaves and yellow stamens are everywhere . . . . There is a bath tub, but the clothes wringer and last winter’s sleds are always kept in it. This is not the home of a very poor family: the father earns twelve dollars a week, two girls are in a factory, and the flower making brings in a certain income.32
Apparently, several children in the described family shared a bed, and the family members may have all shared the same bedroom. Few of the homes of working-class families had running water, and almost none had running hot water. Working-class homes typically had chairs but no sofas. However, if your family were more affluent, you might have awoken in your Victorian-style, heavily carved wooden bed, although by 1915 metal and steel beds were seen as being more sanitary.
Whether or not your abode was a single-family home or a crowded tenement, it probably was heated by a potbelly stove or by a coal furnace in the basement. It wasn’t until the coal shortage during World War I that oil or gas-powered central heating became a popular replacement for the hand-fired coal furnaces and stoves.33 Your home probably wasn’t yet wired for electricity; less than a third of homes had electric lights rather than gas or kerosene lamps.34 However, electricity was the byword of new middle-class homes, which sported electric toasters and coffee pots. Gas stoves were starting to replace coal and wood stoves in part because they conserved kitchen space.35 Telephones could be found in at least a few million homes. However, direct dialing did not exist until the 1920s. If your home had an indoor toilet, the toilet likely was located in a closet or a storage area. It would be a few more years until it was common for toilets, sinks, and bathtubs to share a room.
Housework and shopping. Maintaining a home in 1915 was a more difficult and time-consuming task than it is today. The relatively small size of iceboxes meant more trips to the grocery store, the butcher, or the fish market. Marketing trade journals reported that women were spending more time shopping than were men, an occurrence that is still true today.36 Grocery stores were turning into supermarkets, chain stores and franchises began to proliferate, and mail-order catalogs—Sears and Montgomery Ward—were growing. Mass-produced items were becoming more available, and 5-and-10-cent stores were growing in popularity. For instance, in 1911 Woolworth merged with five other companies, which resulted in a 596-store chain.37
As social historian Harvey Green pointed out, household work remained hard work in 1915: “only after 1915, when the mass production of small electric motors made it possible for many consumers to obtain devices that truly reduced household labor, was there any sort of revolution in the household.”38 There were also some electric vacuum cleaners—1915 marked the start of production for the American Hoover Suction Sweeper Company—as well as electric sewing machines and clothes washers. Although some households had running water in 1915, many rural families and city dwellers did not. Less affluent residents still heated a boiler full of water on a coal or wood range, rubbed clothes on a washboard, used a hand ringer, and hung clothes to dry. Homes without gas or electric heat were harder to clean because of soot from the fireplace or wood stove.
What workers wore. If you were a man and your job was one on the corporate ladder, only one type of business clothing was deemed appropriate: a blue serge suit. For leisure activities and for travel to a working-class job, men typically wore newsboy or flat caps often along with a Norfolk jacket—a belted jacket with box pleats on the front and back—and cuffed long pants. For almost all activities, women wore long skirts. The hobble skirts of 1914—widest at the hips and narrow at the ankle—gave way in 1915 to the freedom and convenience of the flared skirt known as the “war crinoline.” Because of the influence of European fashion, skirts crept up to calf length as first European manufacturers, and later American manufacturers, conserved material for the war effort. Skirts were generally paired with a white blouse called a shirtwaist. Some factory jobs required women to wear pants or jumpsuits, but long skirts were the more usual attire. Clothing was relatively more expensive in 1915 than now and accounted for a larger proportion of total consumption expenditures. Clothing now is about 3 percent of consumer expenditures but was around 13 percent in 1915.39
What workers ate. If you were employed away from home in 1915, you probably started the day much the way many people do today—with a cold-cereal breakfast. Several of today’s cereals—Post Toasties (1904), Kellogg’s Corn Flakes (1906), Quaker Puffed Rice and Puffed Wheat (both 1909), Shredded Wheat (1912), and 40% Bran Flakes (1915)—were on the scene.40 A farm breakfast, however, likely included eggs, breakfast meat, and biscuits or pancakes, and may have been eaten a few hours after starting work early in the morning. Just like today, in 1915 there was some disagreement over what constituted a healthful breakfast. One periodical, for instance, published the following about one of the newer cereals of the day: “Two shredded wheat biscuits, heated for a few moments in the oven to restore crispness, and covered with [h]ot milk and a little cream, will supply more real, body-building nutriment than meat or eggs at a cost of not over five cents. The addition of sliced bananas or other fruits will not bring the total cost to over five cents, and this is a meal that is thoroughly digested when the stomach will reject other foods. The richest man in America could not buy anything better.”41
For lunch, you might take to your job a lunchbox, tin pail, or brown-bag lunch from your icebox or refrigerator—the latter was starting to become available at this time, although General Motors’ Frigidaire didn’t arrive till 1918.42 Indeed, “for most urban Americans, iceboxes were still the norm until the end of World War II.”43 Although the first cellophane-making machine was invented in 1912, which is when Whitman’s Samplers first were wrapped in cellophane, plastic sandwich bags and plastic containers were not yet on the scene. A 1915 cookbook suggested that “if sandwiches are prepared some time before they are served, they can be kept moist by wrapping in a dry towel, covered with a towel wrung out of hot water.”44 Some parents, however, were able to avoid having to pack lunch for their children who attended school. Because of a growing interest in child welfare and nutrition, free or low-cost school lunches were offered in 40 cities by 1912.45
Canned fruit, vegetables, fish, and meat were available commercially, and fresh fruits and vegetables were rare except among rural Americans. Canned goods, including Campbell’s soups, were considered to be “scientific and efficient,” and processed foods were seen as being “sophisticated and up to date.”46 The public’s favorite shortening was lard, and Jell-O became a household word. On the other hand, some workers purchased a lunch out. There weren’t yet any drive-in restaurants—the first was Royce Hailey’s Pig Stand in Dallas 6 years later—and the first fast-food chains, A&W (1918) and White Castle (1921), weren’t yet in existence. But the Horn & Hardart food-service Automat opened in June 1902 in Philadelphia. The first New York Automat opened in Manhattan’s Times Square in July 1912, with a New York Times ad proclaiming “New Method of Lunching”; with most dishes priced at 5 or 10 cents, the restaurant took in 8,693 nickels its first day.47
Of course, most prices of food in 1915 were much different from those in 2015, and several staple items are substantially more affordable today. Here are some examples of 1915 and 2015 prices (using data from the U.S. Census Bureau and the U.S. Bureau of Labor Statistics):
| Item | 1915 price | 1915 price in 2015 dollars | 2015 price |
| Bread (1-lb loaf) | $0.07 | $1.65 | $1.42 |
| Butter (lb) | .36 | 8.48 | 3.18 |
| Eggs (dozen) | .34 | 8.01 | 2.81 |
| Ground coffee (lb) | .30 | 7.06 | 4.61 |
| Potatoes (10 lbs) | .15 | 3.53 | 6.55 |
Not surprisingly, the amounts of different kinds of food consumed in 1915 also were much different from those consumed today. For instance, the annual amount of lard consumed has fallen from 11.5 pounds to 1.5 pounds. Per capita chicken consumption has risen from 14 pounds to 57 pounds. Consumption of caloric sweeteners has jumped from 88 pounds to 130 pounds, plus we now consume a variety of artificial sweeteners in foods and beverages.48 Purchases of food and alcohol accounted for a larger share of total personal consumption 100 years ago, about 33 percent compared with 16 percent currently.49 Despite these changes over time in the foods eaten, the term “square meal”—meaning a substantial, nutritious, and filling meal—has spanned the centuries. The Toledo Blade published the following in 1915: “Our language is a riddle. A man will eat a pound of round steak, a pyramid of mashed potatoes, half a dozen oval biscuits, a triangle of pie, drink two cups of flat coffee—then call it a square meal.”50 Health reformers’ major concern was for the poor and, until the 1920s, “rotundity was considered equal to good health.”51
How people commuted to work. Where you lived and worked helped determine how you traveled to work. A high percentage of people in cities and factory towns walked to work. If you were like most people at the time, however, you lived in a nonurban area. If you didn’t work at home, you also may have traveled to your job by foot, or you may have gotten there on horseback or by mule. A horse probably got you there quickest, traveling 10 to 15 miles per hour. If you didn’t own a horse, you may have lived in a town with a livery stable that held buggies for rent as well as a doctor’s rig and the local hearse. Main Street in small towns generally had hitching rails and mounting blocks to help you with mounting and “parking” your horse. The courthouse square probably had at least one water trough for thirsty horses.52
In urban areas, 1915–20 was the heyday of streetcars: miles of track peaked just 2 years later at nearly 73,000.53 Horse-drawn streetcars and buses led to home construction some 3 to 5 miles from downtown. Within the city, electric streetcars and trolleys may have been your means of transportation, speeding you to your job at 20 miles per hour.54 (The Brooklyn Grays baseball team, nicknamed the Brooklyn Trolley Dodgers in 1895 and later the Brooklyn Dodgers, was so named “in tribute to their fans, who had to avoid speeding [trolley] cars in the maze of trolley lines crisscrossing the city.”55) Over the next two decades, however, streetcar lines either were bought up and then closed down by automobile companies or simply went bankrupt.56 If you were commuting even further—perhaps between suburb and city—commuter railroad may have been available to you.
Although automobiles had only recently been invented, an estimated 2.3 million cars were registered in 1915.57 Olds Motor Works, which was early on the scene, produced some 5,000 cars in 1904,58 but these were overshadowed by the popularity of the more affordable Ford Motor Company’s Model T, colloquially referred to as “Tin Lizzy.” Originally introduced in 1908 with a price tag of $850 (equal to approximately $20,000 in today’s dollars, according to the BLS inflation calculator), the Model T came down in price to $360 (about $7,800 in today’s dollars) by 1916. However, car buyers needed to purchase such “accessories” as shock absorbers, a gas gauge, and an accelerator from a parts dealer or the Sears, Roebuck catalog.59 The Model T, which had a 22-horsepower engine, could reach speeds of 35 miles per hour. But since gas stations and paved roads between cities were scarce until the 1920s, the vehicle’s usefulness was somewhat limited. In part because car ownership wasn’t yet prevalent, overall transportation costs composed only around 7 percent of consumption spending in 1915, compared with around 20 percent today.60 The modern parkway may have begun with the building of the Westchester County Parkways in New York (constructed 1913–30) and the first federally authorized parkway project, the 4-mile Rock Creek and Potomac Parkway, in Washington, DC, in 1913. Although in earlier years the streets had been kept clean by hand sweeping, beginning in 1915, street-cleaning machines, pulled by either horses or a truck, made an appearance. Poorer neighborhoods, however, tended to be cleaned less often. Trash, rats, and mice were common and likely contributed to the influenza pandemic that began 3 years later.61
Time and work. The latest workplace rage was scientific management, which involved motion and time studies to determine the most efficient way to perform a work task. In 1911, Frederick Winslow Taylor wrote a seminal work on the subject—The Principles of Scientific Management—which suggested that greater workplace efficiency can be achieved by training employees to do a single job, such as opening mail, inspecting ball bearings, performing accounting tasks, or selling products.62 Taylorism pushed the division of labor to its logical extreme but did not take into account worker satisfaction. Similarly, in 1913, Henry Ford instituted the assembly line into his Ford Model-T car manufacturing plants to boost both efficiency and production.
Once you arrived at work, it was possible, but not likely, that you’d use a time clock to verify the time of your arrival; time clocks made their first appearance in offices sometime between 1910 and 1915.63 Advertisements of time-clock manufacturers explained that a prompt employee was a “profitable” employee.64 Interestingly, although nonagricultural workers now conformed not to “the natural rhythms of the sun and seasons, but to the mechanical pace of the pocket watch, the factory whistle, or the railroad-station clock,” 1915 had no standard time.65 Time zones had been used by the railroads since 1883 and most jurisdictions abided by railroad time, but it wasn’t till Congress passed the Standard Time Act of 1918 (and first experimented with nationwide daylight saving time that same year) that an “official” correct time came into being.
Workers in 1915 were sometimes required to work too much and other times too little; factory-worker hours could be shortened from one day to the next, leaving workers with a severely reduced paycheck. Women, in particular, tended to be employed in highly seasonal trades, according to social historian Leslie Woodcock Tentler, who noted that an economist in 1915 “conservatively estimated that women lost 10 percent of full-time earnings each week because of seasonal fluctuations in hours worked.”66
For workers who were hired on a full-time basis, the workweek—when not reduced to part time—was generally long. Workers in manufacturing averaged 55 hours at work per week, and production workers in manufacturing averaged about 49 weekly hours of paid work.67 The latter figure may reflect that few workers indeed were compensated for time off, and factory workers hours could be shortened from one day to the next.
It wasn’t until 1919 that close to half of American workers had a 48-hour workweek; in 1915, only one-eighth of workers had a workweek capped at 48 hours.68 Federal government workers achieved an 8-hour workday by the 1840s, but some factory employees, such as cigarette rollers, worked as many as 65 hours per week.69 In fact, employees of U.S. Steel worked 7 days a week until after “the crusading first vice-president, W. B. Dickson, had threatened to resign and take the fight outside the corporation” in 1911.70 It wasn’t until 1926 that Henry Ford reduced the workweek in his factories from 48 to 40 hours. The manufacturing workweek is now about 40 hours, although its length is somewhat sensitive to business conditions, dropping during recessions and climbing during recoveries and economic expansions.
Working conditions. Although working in mines was notoriously dangerous, mill work could also be quite hazardous. BLS reported about 23,000 industrial deaths in 1913 among a workforce of 38 million, equivalent to a rate of 61 deaths per 100,000 workers. In contrast, the most recent data on overall occupational fatalities show a rate of 3.3 deaths per 100,000 workers.71 Regarding on-the-job safety, Green notes, “There was virtually no regulation, no insurance, and no company fear of a lawsuit when someone was injured or killed.”72 Frances Perkins, who went on to become the first Secretary of Labor (1933–45), lobbied for better working conditions and hours in 1910 as head of the New York Consumers League. After witnessing the 1911 Triangle Shirtwaist Factory fire, which caused the death of 146 mainly young, immigrant female garment workers in New York’s Greenwich Village, Perkins left her job to become the head of the Committee on Public Safety, where she became an even stronger advocate for workplace safety. From 1911 to 1913, the New York State legislature passed 60 new safety laws recommended by the committee. Workplaces have become safer, and technology has been used in place of workers for some especially dangerous tasks.
The jobs workers held. Comprehensive data by industry or occupation do not exist for 1915, but we have information for 1910 and 1920 from the decennial censuses.73 Thirty-one percent of “gainful workers” in 1910 worked in farm occupations, as did 27 percent in 1920, compared with less than 1 percent of employed people now. (See table 2.) The predominant occupation group was that of craftsmen, laborers, and operatives, and professional and technical workers—today’s largest group—made up less than 5 percent of all workers. In terms of the industries of workers, 1 of every 3 nonfarm jobs in 1910 was in manufacturing, compared with less than 1 in 10 currently. (See table 3.) Professional services were a rather small industry component a hundred years ago, while today’s economy includes professional services related to computers and electronics that didn’t exist a century ago. Interestingly, a new occupation, certified public accountants, expanded after the federal government in 1914 issued the first Form 1040. Federal income taxes began that year for people earning more than $3,000 (which is equal to about $71,000 in today’s dollars).
| Occupation | 1910 | 2015 | ||
|---|---|---|---|---|
| Number | Percent distribution | Number | Percent distribution | |
| Total | 37,291 | 100.0 | 148,834 | 100.0 |
| Professional and technical(1) | 1,758 | 4.7 | 41,222 | 27.7 |
| Managers | 2,462 | 6.6 | 16,994 | 11.4 |
| Clerical | 1,987 | 5.3 | 17,897 | 12.0 |
| Sales | 1,755 | 4.7 | 15,700 | 10.5 |
| Craftsmen, foreman, laborers, and operatives(2) | 14,234 | 38.2 | 30,051 | 20.2 |
| Service workers | 3,562 | 9.6 | 25,896 | 17.4 |
| Farm workers (incl. farmers, managers, laborers, and foremen) | 11,533 | 30.9 | 1,073 | .7 |
| Notes: (1) For 2015, the “professional and technical” category includes business and financial operations occupations; professional and related occupations; and aircraft pilots and flight engineers, air traffic controllers and airfield operations specialists, and flight attendants. (2) For 2015, the “craftsmen, foreman, laborers, and operatives” category includes construction and extraction occupations; installation, maintenance, and repair occupations; and production, transportation, and material moving occupations less aircraft pilots and flight engineers, air traffic controllers and airfield operations specialists, and flight attendants. Note: Data for 1910 are from Historical statistics of the United States, colonial times to 1957, series Sources: U.S. Bureau of Labor Statistics and U.S. Census Bureau. | ||||
| Industry | 1910 | 2015 | ||
|---|---|---|---|---|
| Number | Percent distribution | Number | Percent distribution | |
| Forestry and fisheries(1) | 250 | 1.0 | 52 | 0.0 |
| Mining | 1,050 | 4.1 | 768 | .5 |
| Manufacturing | 8,230 | 32.4 | 12,317 | 8.7 |
| Construction | 2,300 | 9.1 | 6,446 | 4.5 |
| Transportation and public utilities | 3,190 | 12.6 | 5,404 | 3.8 |
| Wholesale and retail trade(2) | 3,370 | 13.3 | 32,561 | 23.0 |
| Finance and real estate | 520 | 2.0 | 8,124 | 5.7 |
| Educational services | 900 | 3.5 | 13,724 | 9.7 |
| Other professional services(3) | 770 | 3.0 | 41,012 | 28.9 |
| Domestic service | 2,150 | 8.5 | — | — |
| Personal service(4) | 1,520 | 6.0 | 1,402 | 1.0 |
| Government not elsewhere classified(5) | 540 | 2.1 | 11,715 | 8.3 |
| Other(6) | 600 | 2.3 | 8,309 | 5.9 |
| Notes: (1) For 2015, logging employment. (2) For 2015, food services and drinking places have been included in the “wholesale and retail trade” category. (3) For 2015, the “other professional services” category includes information services, professional and business services, and health care and social assistance. (4) For 2015, the “personal service” category is personal and laundry services. (5) It appears that the government employment number in the 1910 data source does not include employment at government-owned educational establishments such as public schools and universities. To improve comparability, the 2015 government number shown here is the sum of federal government, state government excluding education, and local government excluding education. State and local government education employment is included in educational services. (6) For 2015, the “other” category includes leisure and hospitality (except for food services and drinking places), repair and maintenance, and membership associations and organizations. Note: Data for 1910 are from Historical statistics of the United States, colonial times to 1957, series Sources: U.S. Bureau of Labor Statistics and U.S. Census Bureau. | ||||
Where women worked. Tentler points out that women, a relatively small but growing portion of the workforce, were concentrated in low-wage sectors of the economy, but even there, they earned less than men. Comparing data from the 1910 and 1920 decennial censuses, we find that the largest employment increases for women were among store clerks and semiskilled factory operatives. Substantial growth took place in the number of women employed as stenographers and typists; bookkeepers, cashiers, and accountants; and teachers. Another growing occupation at the time was telephone operator. Declining occupations were servant, dressmaker, laundress, milliner, and boarding house keeper. Agricultural employment for women was declining, with about one-tenth of employed women working in this industry in 1920.74
Nursing, teaching, and clerical work were the fields open to educated women. According to social historian Thomas Schlereth, “School boards adhered to the symbol of woman as the paragon of moral virtue in their preferential recruitments of female teachers. An occupation that was originally a masculine preserve in the eighteenth century became a feminine one (86 percent) by the early twentieth century.”75 Women in education were described as being moral and loving teachers, supervised and managed by male principals and superintendents.76 Moreover, school boards liked the fact that they could pay women less than men. Even today, more than a third of all employed women are in the education and health services industry.
By 1915, more than half of all clerical workers were women. Tentler notes that clerical work “generally promised stable employment, barring hard times” and that “the stability of office work doubtless enhanced its inherent appeal for the working-class young and perhaps helped to reconcile the better-educated worker to the low pay that characterized most clerical employment.”77 Female clerical workers often received training at business schools, at the YWCA, and through high school commercial courses, and also learned on the job. Like later generations, they practiced typing skills by typing the sentence, “Now is the time for all good men to come to the aid of their party,” which was the 1872 Republican slogan for Ulysses S. Grant. The women who were clerical workers tended to be young (18–24 years old), White, and native born. Whereas a woman working in a mill might earn $260 per year and a teacher in an urban high school might earn $450, an office worker with training from a commercial course might earn $660 annually.78 Hence, there was a strong financial incentive for women to seek clerical work rather than another type of employment.
Despite the entry of women into selected white-collar occupations, a large number of women worked in factories. In fact, by 1915 there were more women than men in textile mills, canneries, food-processing plants, and garment manufacturing.79
How much workers were paid. According to a U.S. News and World Reports article comparing income in 1915 and 2015, “back in 1915 . . . you were doing about average if you were making $687 a year, according to the Census. That is, if you were a man. If you were a woman, cut that number by about half.” In terms of 2015 dollars, the average pay of $687 for men is equal to $16,063, which is well below today’s income. Median annual earnings for men ages 15 and over in 2014 were $40,638 ($50,383 for men who worked full time), and median annual earnings for women in 2014 were $28,394 ($39,621 for women who worked full time).80 In terms of weekly earnings, we find that the median usual weekly earnings among people employed full time in the third quarter of 2015 were $809−$898 for men and $728 for women.81 The wage comparison becomes even more dramatic if one considers that benefits now add substantially to the total compensation of some workers. By contrast, benefits were meager or, more commonly, nonexistent a hundred years ago.
Although some employers were subject to minimum pay regulations, many workers, especially women, earned less than minimum wage. For instance, Tentler reported that “in New York City’s garment industry, operating under a minimum wage protocol, an economist found in 1914 that from one-fourth to one-half of the workers in the different occupations investigated were earning less than minimum pay, ‘the employers claiming that the workers in question were learners.’” The learning period was sometimes unpaid, and employers would lay off apprentices after one season rather than increase their pay.82
Multiple-earner families. Like now, many families, particularly those of the working class, relied on the earnings of several family members. According to labor historian David Brody, who focused his research on steel and ironworkers, only half of industrial families managed on just the earnings of the husband a hundred years ago. What had been traditional sources of supplementary income at the time—rent from boarders and earnings from work done at home—were becoming less common, and wives were making up the difference. Brody noted that a study of 1920 census data showed that about one-fifth of the wives of semiskilled and unskilled Chicago men were employed outside the home.83 Many workers, including steelworkers and immigrant workers, earned meager wages, so it is not surprising that women were entering the labor force in growing numbers.84 The labor force participation of women continued to grow throughout the 20th century, reaching a high of about 60 percent in 2000 before declining to its current level of just under 57 percent.
Labor unrest. Another labor historian, Melvyn Dubofsky, found that a decline in unemployment in 1915 and 1916, along with surging prices, caused workers to more readily go on strike for higher wages and an 8-hour workday.85 The number of strikes rose from 1,589 in 1915 to 3,789 in 1916 and more than 4,400 in each of the next 2 years. Major strikes took place in the 1915–16 period among workers in the munitions and armaments industry (particularly in Bridgeport, Connecticut), New Jersey oil refining, the New York clothing industry and transit industry, the Ohio steel industry, the Minnesota steel industry, and the Great Plains grain harvesting industry.86 Dubofsky noted that more companies were willing to change labor policy in order to create loyalty and contentment among workers. Doing so was seen as a way to increase efficiency and thereby increase profits.87
Vacations, holidays, and sick leave. Paid vacations or sick leave were rare, and most Americans couldn’t afford a week at the shore or at a mountainside resort. Instead, they traveled for the day or weekend to beaches—for instance, Coney Island, NY; Atlantic City, NJ; and Mackinac Island, MI—and to both amusement and national parks. Labor Day was the only national holiday between July 4 and Christmas. (Thanksgiving was made a holiday for federal workers in 1863, but it remained a workday for many other workers through the 1930s.)
Leisure time away from work. While the middle class, farmers, and the wealthy socialized at home, the urban working class socialized “on stoops and in streets, saloons, and clubs.”88 Like today, how people spent their leisure time depended, in part, on their affluence.
For many members of the working class, Friday was the big night on the town because Friday was payday. Free time consisted of Saturday afternoon and Sunday, or only Sunday—at least for men. Women continued to cook, clean, and provide childcare, and often worked extra hard to prepare a special meal on Saturday night or Sunday.89
Player pianos were popular in the early 1900s, and phonographs were mass produced beginning around 1900. “Victrola” became the generic name for all phonographs, and the middle class danced to the music they played. There were an estimated half million phonographs in 1914; by 1921, 100 million were manufactured annually.90 Although the radio was invented in 1895, its availability was limited before the 1920s, which helped account for the popularity of phonographs. Most radio stations played music, particularly classical music, and there were no radio commercials until 1922.91 Parlors often contained both a stereoscope and a basket of photographic stereo cards.
The most popular form of theatre at the time was vaudeville. Next in popularity were movies, which were silent films until 1927. Nickelodeons—small, simple theatres often housed in store fronts—were popular from 1905 to around 1915, but were rapidly replaced by larger movie theatres and then by the opulent theatres of the 1920s. Among the movies of the day were “The Perils of Pauline,” released in 1914, and Charlie Chaplin’s “The Tramp,” released in 1915.
Books published in 1915 included Arthur Conan Doyle’s The Valley of Fear, Theodore Dreiser’s The Genius, Ford Madox Ford’s The Good Soldier, and W. Somerset Maugham’s Of Human Bondage. Nonfiction of 1915 included Etiquette by Emily Post, How to Win Friends and Influence People by Dale Carnegie, and Principles of Domestic Engineering: The Business of Home Management by Mary Pattison. Two years earlier, Christine Frederick, a promoter of the kitchen triangle floor plan to efficiently save steps, authored The New Housekeeping.
For people living in less congested locations, amateur gardening and maintenance of weed-free lawns became a new leisure-time activity.92 The Boy Scouts of America, heartily endorsed by then-former President Theodore Roosevelt, began in 1911, and the Girl Scouts began in 1912. Physical education classes became a part of the school day by around 1910, along with extracurricular sports. Invented in 1891, basketball quickly caught on as the favorite winter sport. People living in urban areas also liked to go bowling, although bowling wasn’t seen as a family sport until the 1920–33 Prohibition era caused bowling alleys to disassociate from saloons. The chief spectator sport changed from boxing to baseball, but football as a spectator sport began to grow around 1915 as college financial officers saw the value in recruiting star football players. Fraternal organizations, such as the Freemasons, the Knights of Columbus, Rotary, and the Elks, gained in popularity, and the Kiwanis Club was founded in 1915.
The life of workers in 1915 was vastly different from that of workers today. The nature of work has been shaped by technology, globalization, a more educated workforce, almost instantaneous modern telecommunications, and countless other forces. Future transformations in healthcare and medicine, telecommunications, the environment, and more may make the changes in the life of workers over the next 100 years even more dramatic than those of the past century. Is it possible, however, that we may still be starting our workday with corn flakes?
ACKNOWLEDGMENT: I would like to extend special thanks to my brother, Warren Leon, for his consulting work on the historical aspects of this article.
Carol Boyd Leon, "The life of American workers in 1915," Monthly Labor Review, U.S. Bureau of Labor Statistics, February 2016, https://doi.org/10.21916/mlr.2016.5
1 One textbook defines the Progressive Movement as “a network of overlapping and sometimes conflicting organizations and coalitions that campaigned to reform American society between 1890 and the outbreak of World War I in 1914. Millions of Americans from all walks of life marched under the progressive banner—from working people battling for better pay and control over their lives to middle-class urban reformers striving to improve living and working conditions in the slums to black women campaigning against lynching.” From Roy Rosenzweig, Nelson Lichtenstein, Joshua Brown, and David Jaffee, Who built America? Working people and the nation’s history, vol. 2: 1877 to the present, 3rd ed. (American Social History Project, 2007), p. 223.
2 In millions, the numbers of European immigrants per decade are the following: 1820–29, 1.0; 1830–39, 0.4;
3 The 1915 data are from Historical statistics of the United States, colonial times to 1957, series B 92–100 (U.S. Bureau of the Census, 1960), p. 25. Life expectancy was 52.5 years for men, 56.8 years for women, 55.1 years for Whites, and 38.9 years for non-Whites. Current life expectancy rates are for 2013 from “Deaths and mortality,” FastStats (Centers for Disease Control and Prevention, updated September 30, 2015), http://www.cdc.gov/nchs/fastats/deaths.htm.
4 See U.S. population estimates for 2014 at http://factfinder.census.gov/faces/tableservices/jsf/pages/productview.xhtml?src=bkmk. Centenarians represent 0.2 percent of the U.S. population. Women account for 81 percent of the nation’s centenarians.
5 Mark Mather, “The decline in U.S. fertility,” World Population Data Sheet (Washington, DC: Population Reference Bureau, 2014).
6 T. J. Mathews, Marian F. MacDorman, and Marie E. Thoma, “Infant mortality statistics from the 2013 period linked birth/infant death data set,” National Vital Statistics Reports, vol. 64, no. 9 (Centers for Disease Control and Prevention, August 6, 2015), http://www.cdc.gov/nchs/data/nvsr/nvsr64/nvsr64_09.pdf. See also Myron E. Wegman, “Infant mortality in the 20th century, dramatic but uneven progress,” Journal of Nutrition, vol. 131, no. 2, February 1, 2001.
7 See Carolyn Leonard Carson, “And the results showed promise . . . physicians, childbirth, and southern Black migrant women, 1916–1930: Pittsburgh as a case study,” in Judith Walzer Leavitt, ed., Women and health in America: historical readings, 2nd ed. (Madison, WI: University of Wisconsin Press, 1999), p. 348.
8 In 2009, 0.72 percent of U.S. babies were not born in hospitals. See Marian F. MacDorman, T. J. Mathews, and Eugene Declercq, “Home births in the United States, 1990–2009,” NCHS Data Brief, no. 84 (Centers for Disease Control and Prevention, January 2012), http://www.cdc.gov/nchs/data/databriefs/db84.pdf. For fertility rates, see “Table 1-1. Live births, birth rates, and fertility rates, by race: United States, 1909–2000” (Centers for Disease Control and Prevention), http://www.cdc.gov/nchs/data/statab/t001x01.pdf.
9 The 2015 data for median age at first marriage are from “Table MS-2. Estimated median age at first marriage: 1890 to present” (U.S. Census Bureau, November 2015), https://www.census.gov/hhes/families/files/ms2.csv. Data for 1910 and 1920 are from Historical statistics, colonial times to 1957, p. 15.
10 According to a National Center for Health Statistics report, 48 percent of women ages 15 to 44 have cohabited with a partner before marriage. See Casey E. Copen, Kimberly Daniels, and William D. Mosher, “First premarital cohabitation in the United States: 2006–2010 National Survey of Family Growth,” National Health Statistics Reports, no. 64 (Centers for Disease Control and Prevention, April 4, 2013), http://www.cdc.gov/nchs/data/nhsr/nhsr064.pdf.
11 Information on 1915 deaths is from “Leading causes of death, 1900–1998” (Centers for Disease Control and Prevention), http://www.cdc.gov/nchs/data/dvs/lead1900_98.pdf. Current cause-of-death data are from “Leading causes of death,” FastStats (Centers for Disease Control and Prevention, updated September 30, 2015), http://www.cdc.gov/nchs/fastats/leading-causes-of-death.htm. Although influenza wasn’t the leading cause of death in 1915, the 1918 influenza pandemic killed 30 to 50 million people worldwide, including an estimated 675,000 in the United States, according to “The great pandemic: the United States in 1918–1919” (U.S. Department of Health and Human Services), http://www.flu.gov/pandemic/history/1918/the_pandemic. In 2013, there were 555 deaths from tuberculosis, a decrease of 67 percent since 1992; see “Trends in tuberculosis, 2014,” fact sheet (Centers for Disease Control and Prevention, September 2015), https://www.cdc.gov/nchhstp/newsroom/docs/factsheets/tb-trends-factsheet.pdf.
12 The 1915 data are from Historical statistics, colonial times to 1957, series A 22–23, p. 8. The current (2014) population estimate and the population by race (2013) estimate are from http://quickfacts.census.gov/qfd/states/00000.html.
13 The data for 1915 immigrants are from Historical statistics, colonial times to 1957, series C 88–114, pp. 56–58. Note that there were only 326,700 immigrants to the United States in 1915, compared with 1.2 million in 1914. The data for 2013 are from 2013 yearbook of immigration statistics, table 10 (U.S. Department of Homeland Security, August 2014), https://www.dhs.gov/sites/default/files/publications/Yearbook_Immigration_Statistics_2013_0.pdf. There were an estimated 40 million people living in the United States in 2010 who had been born elsewhere to other than an American parent, according to “The foreign-born population in the United States: 2010” (U.S. Department of Commerce, May 2012). About 53 percent were from Latin America and the Caribbean, 28 percent were from Asia, and 12 percent were from Europe.
14 Campbell Gibson and Kay Jung, “Historical census statistics on the foreign-born population of the United States: 1850 to 2000,” working paper 81 (U.S. Census Bureau, February 2006); and Current Population Survey—March 2012 detailed tables, “Characteristics of the foreign-born population by nativity and U.S. citizenship status,” table 1.1 (U.S. Census Bureau, 2012).
15 Decennial census data show that 54 percent of the population lived in a rural area in 1910, 49 percent lived in a rural area in 1920, and 19 percent did so in 2010.
16 The percentage for 1915 is estimated from the 1910 (77.4 percent) and 1920 (78.0 percent) data shown in Historical statistics, colonial times to 1957, series C 1–114, p. 41. The 2010 data are from Ping Ren, “Lifetime mobility in the United States: 2010,” American Community Survey Briefs (U.S. Census Bureau, issued November 2011).
17 A 1915 estimate of the total labor force—that is, the combination of the civilian labor force and the Armed Forces—was derived by Stanley Lebergott from detailed worker rates in census years; he then applied the results to unpublished U.S. Census Bureau estimates of the population ages 14 and over for individual years and made special adjustments for immigration. This article uses his labor force estimates to derive a civilian labor force participation rate. The 2015 rate comes from the monthly Current Population Survey and is for ages 16 and over. Before 1940, people were considered unemployed if they were “willing and able to work,” which made unemployment a subjective measurement. Since 1940, the term “unemployed” has been defined objectively as “working or actively seeking work.” This information is from chapter D in Historical statistics of the United States, colonial times to 1970, bicentennial edition (U.S. Bureau of the Census, September 1975).
18 “Compulsory civic service proposed for children; Prof. Royal Meeker of Princeton offers a plan which he believes would solve many of the problems arising out of our imperfect system of education,” New York Times, April 6, 1913, p. SM4. Meeker also editorialized that all children, rich and poor alike, should be obliged to attend public schools; starting with intermediate school, half of the school day would be devoted to “concentrated mental labor” while the other half would be used for “hard work at a trade, games, and recreation.” Such training would be followed by a couple of years of compulsory civic service at a location other than the child’s hometown.
19 The educational attainment information for 1915 is the author’s estimate based on Information Please Database (2007 Pearson Education, Inc.) estimates of 1910 and 1920 educational attainment, which are U.S. Census Bureau retrojections of 1940 census data on education by age. The estimate for 1915 high school attendance is from Harvey Green, The uncertainties of everyday life, 1915–1945 (New York: HarperCollins Publishers, 1922), p. 126. In 2012, the dropout rate (among Americans ages 16 through 24) was 6.6 percent, according to the National Center for Education Statistics; see “Table 219.70. Percentage of high school dropouts among persons 16 through 24 years old (status dropout rate), by sex and race/ethnicity: selected years, 1960 through 2012” (National Center for Education Statistics, table prepared May 2013), http://nces.ed.gov/programs/digest/d13/tables/dt13_219.70.asp. Length of public school term and number of days attended in 1915 are from Historical statistics, colonial times to 1957, series H 223–233, p. 207. The educational attainment data for 2000–14 are from the American Community Survey and appear in “Quick facts: United States” (U.S. Census Bureau), https://www.census.gov/quickfacts/fact/table/US/PST045216.
20 Leslie Woodcock Tentler, Wage-earning women: industrial work and family life in the United States, 1900–1930 (New York: Oxford University Press, 1979), p. 93.
21 From chapter IV, “Royal Meeker: statistics in recession and wartime,” in Joseph P. Goldberg and William T. Moye, The first hundred years of the Bureau of Labor Statistics, bulletin 2235 (U.S. Bureau of Labor Statistics, September 1985), pp. 80 and 97, https://www.bls.gov/opub/blsfirsthundredyears/.
22 Historical unemployment rates, which are for ages 14 and older, are from Historical statistics, colonial times to 1957, series D 46–47, p. 73. Recent unemployment rates, which are for ages 16 and older, are from the U.S. Bureau of Labor Statistics, https://data.bls.gov/timeseries/LNU04000000?years_option=all_years&periods_option=specific_periods&periods=Annual+Data.
23 Thomas J. Schlereth, Victorian America: transformations in everyday life, 1876–1915 (New York: Harper Perennial, 1992), p. 101.
24 Current Population Survey/Housing Vacancy Survey, series H-111, U.S. Census Bureau, https://www.census.gov/housing/hvs/index.html. Data for 2015 are from Robert A. Callis and Melissa Kresin, “Residential vacancies and homeownership in the fourth quarter 2015,” U.S. Census Bureau News (U.S. Census Bureau, January 28, 2016), https://www.census.gov/housing/hvs/files/currenthvspress.pdf.
25 Estimate of median home value, which is for December 2015, is from Svenja Gudell, “December market report: expect rental growth to cool in 2016, but affordability problems to remain,” Zillow Research, January 22, 2016, http://www.zillow.com/research/rental-growth-slow-in-2016-11651/. Estimate of cost of a home in 1915 is a U.S. Census Bureau estimate from Geoff Williams, “A glimpse at your expenses 100 years ago,” U.S. News and World Reports, January 2, 2015, http://money.usnews.com/money/personal-finance/articles/2015/01/02/a-glimpse-at-your-expenses-100-years-ago.
26 Historical statistics, colonial times to 1957, series G 219–243, p. 179. According to the author’s calculations, “rent and imputed rent; furniture and furnishings; mechanical appliances; fuel, ice, and lighting supplies; and electricity, gas, and water” accounted for 28.1 percent of total consumption expenditures in 1914 and 22.3 percent in 1919 (no data are available for 1915). The current data are for urban expenditures. For a look at how housing as a percentage of consumer expenditures has declined since the 1930s, see figure 2 in Steven Henderson, “Consumer spending in World War II: the forgotten consumer expenditure surveys,” Monthly Labor Review, August 2015, https://www.bls.gov/opub/mlr/2015/article/consumer-spending-in-world-war-ii-the-forgotten-consumer-expenditure-surveys.htm.
27 Data reflect home purchases from June 2013 through July 2014. See 2015 profile of home buyers and sellers (National Association of REALTORS®, 2015), http://www.realtor.org/reports/highlights-from-the-2015-profile-of-home-buyers-and-sellers.
28 Ibid.
29 Green, The uncertainties of everyday life, p. 94. According to Matthew Chambers, Carlos Garriga, and Don Schlagenhauf, “Did housing policies cause the postwar boom in homeownership?” working paper 2012-021A (Federal Reserve Bank of Saint Louis, April 2012), in 1920–24, savings and loan institutions typically provided mortgages amounting to 58 percent of the home purchase price, and the term of the mortgage averaged 11.1 years. Mortgages from commercial banks amounted to 50 percent of the purchase price and had a term of 2.8 years. Mortgages from life insurance companies amounted to 47 percent of the purchase price and had a term of 6.4 years. See http://research.stlouisfed.org/wp/2012/2012-021.pdf.
30 Schlereth, Victorian America, p. 93.
31 Estimate is from Schlereth, Victorian America, p. 226. The encyclopedia of New York City, edited by Kenneth T. Jackson and originally published in 1995 by Yale University Press and the New-York Historical Society, links the custom of Moving Day to May Day.
32 From Mabel Hyde Kittredge, “The need of the immigrant,” Journal of Home Economics, October 1913.
33 See “An early history of comfort heating,” The Air Conditioning, Heating and Refrigeration News, November 6, 2001, http://www.achrnews.com/articles/87035-an-early-history-of-comfort-heating.
34 According to Green, The uncertainties of everyday life, p. 62, “in 1912, 16 percent of the population lived in houses with electric lights; 63 percent did so in 1927 . . . .”
35 Schlereth, Victorian America, pp. 112–115.
36 According to the American Time Use Survey, women (ages 15 and older) spent an average of 0.4 hour per day (excluding travel time) on purchasing consumer goods in 2014, and men spent an average of 0.3 hour per day. See https://www.bls.gov/tus/charts/chart14.pdf.
37 Schlereth, Victorian America, p. 153.
38 Green, The uncertainties of everyday life, p. 17.
39 Clothing was 12.5 percent of personal consumption expenditures in 1914 and 13.9 percent in 1919, according to author’s calculations. For historical statistics on consumer expenditures, see source cited in endnote 26.
40 Information from http://www.mrbreakfast.com/.
41 From “A five-cent breakfast: easy to get a wholesome, nourishing breakfast for five cents if you only know how,” The Advance, January 27, 1916, as reprinted in American Periodicals (p. 552), according to http://www.foodtimeline.org/foodfaq7.html.
42 Schlereth, Victorian America, p. 126.
43 Green, The uncertainties of everyday life, p. 68.
44 From Carlotta C. Greer, A text-book of cooking (Boston: Allyn and Bacon, 1915), p. 328. Interestingly, according to research conducted by Lynne Olver, editor of Food Timeline, school cafeteria lunches, a new idea of the time, were of the hot variety. A Philadelphia school system offered its students baked beans on Monday, vegetable soup on Tuesday, creamed beef on toast on Wednesday, macaroni with tomato sauce on Thursday, and creamed salmon on Friday. See http://www.foodtimeline.org/foodschools.html.
45 Green, The uncertainties of everyday life, p. 169.
46 Schlereth, Victorian America, p. 163.
47 See Sam Roberts, “Revisiting the era of automatic dining,” New York Times City Room blog, June17, 2012, http://cityroom.blogs.nytimes.com/2012/06/17/revisiting-the-era-of-automatic-dining/?_r=0. Unable to stay relevant in an era of fast-food restaurants, the last Automat shut its doors in 1991.
48 Data for per capita food consumption are from http://www.ers.usda.gov/data-products/food-availability-(per-capita)-data-system/.aspx.
49 Food and alcohol was 32.8 percent of personal consumption expenditures in 1914 and 33.9 percent in 1919, according to author’s calculations. For historical statistics on consumer expenditures, see source cited in endnote 26.
50 From “The square meal,” Toledo Blade, Chicago Defender, June 5, 1915, p. 2, according to http://www.foodtimeline.org/foodfaq7.html.
51 Green, The uncertainties of everyday life, p. 177.
52 Schlereth, Victorian America, p. 20.
53 Green, The uncertainties of everyday life, p. 29.
54 Schlereth, Victorian America, p. 24.
55 Ibid., p. 24.
56 Green, The uncertainties of everyday life, p. 29.
57 From “State motor vehicle registrations, by years, 1900–1995” (U.S. Department of Transportation), https://www.fhwa.dot.gov/ohim/summary95/mv200.pdf.
58 Thomas Carson and Mary Bonk, Gale encyclopedia of U.S. economic history (Detroit: Gale Group, 1999).
59 Schlereth, Victorian America, p. 26.
60 Transportation consumption costs (net purchases of new and used cars, automobile parts and repairs, gasoline, other private transportation including horse-drawn vehicles, and blacksmith services) were 6.4 percent of personal consumption expenditures in 1914 and 8.1 percent in 1919. See endnote 26 for more information.
61 Green, The uncertainties of everyday life, p. 180.
62 Frederick Winslow Taylor’s “The principles of scientific management” (New York and London: Harper and Brothers Publishers) was a monograph published in 1911.
63 Green cites 1915 as the year time clocks were first introduced to offices; see The uncertainties of everyday life, p. 19. The time clock was invented in 1888 by William LeGrand Bundy, a New York jeweler, and was soon mass produced by Bundy Manufacturing Company. In 1900, the time-recording portion of the company consolidated with two other firms to form the International Time Recording Company. The new company then joined with two others in 1911 to form the Computing Tabulating Recording Company, which in 1924 changed its name to International Business Machines Corporation (IBM).
64 Green, The uncertainties of everyday life, p. 19.
65 Schlereth, Victorian America, p. 29.
66 The 10-percent estimate is from economist Charles Persons, written about in Tentler, Wage-earning women, pp. 19–20.
67 From Historical statistics, colonial times to 1957, series D 589–602, p. 91, and series D 654–668, p. 94; the production-worker hours are for 1914.
68 Information for 1919 is from Melvyn Dubofsky, Industrialism and the American worker, 1865−1920, 3rd ed. (Wheeling, IL: Harlan Davidson Inc., 1996), p. 132. Information for 1915 is from Green, Uncertainties of everyday life, p. 33.
69 Schlereth, Victorian America, p. 46.
70 David Brody, Workers in industrial America: essays on the twentieth century struggle, 2nd ed. (New York: Oxford University Press, 1993), p. 51.
71 According to final 2013 data and preliminary 2014 data. From National Census of Fatal Occupational Injuries in 2014, USDL-15-1789 (U.S. Department of Labor, September 17, 2015), https://www.bls.gov/news.release/pdf/cfoi.pdf.
72 Green, The uncertainties of everyday life, p. 31.
73 BLS had wage and hours surveys for manufacturing from 1904 to 1908 and, starting in 1913, for 10 industries every other year. In 1916, BLS began publishing monthly employment data for five industries; this was the beginning of the establishment series on employment and payrolls. By 1918, the wage and hours surveys covered 2,365 establishments in 43 states, expanding the data to 780 occupations in 28 industries, but the program was scaled back after World War I. From Donald M. Fisk, “American labor in the 20th century,” Monthly Labor Review, September 2001, https://www.bls.gov/opub/mlr/cwc/american-labor-in-the-20th-century.pdf.
74 Joseph A. Hill, Women in gainful occupations, 1870 to 1920 (Washington, D.C.: U.S. Government Printing Office, 1929).
75 Schlereth, Victorian America, p. 245.
76 Ibid.
77 Tentler, Wage-earning women, pp. 34–35.
78 Schlereth, Victorian America, p. 67.
79 Ibid., p. 55.
80 Estimates are in 2014 CPI-U-RS adjusted dollars.
81 Median annual earnings data for 2014 are from Carmen DeNavas-Walt and Bernadette D. Proctor, “Income and poverty in the United States: 2014,” table A-4 (U.S. Census Bureau, September 2015), https://www.census.gov/content/dam/Census/library/publications/2015/demo/p60-252.pdf, and are for people employed full time, year round. Third quarter 2015 median usual weekly earnings data are from the Current Population Survey and are available from BLS at https://www.bls.gov/webapps/legacy/cpswktab1.htm. Other data are from “A glimpse at your expenses 100 years ago,” U.S. News and World Reports, January 2, 2015, http://money.usnews.com/money/personal-finance/articles/2015/01/02/a-glimpse-at-your-expenses-100-years-ago.
82 Quotation and information is from Tentler, Wage-earning women, p. 22.
83 Brody, Workers in industrial America, p. 21.
84 Pittsburgh steel mill workers earned just 16.5 cents an hour in 1910 and most immigrant workers—who composed 60 percent of the nationwide industrial labor force before World War I—earned a third less than the $15 per week that the Pittsburgh Associated Charities calculated was the minimum amount to provide bare necessities for a family of five. See Brody, Workers in industrial America, p. 16.
85 Dubofsky, Industrialism and the American worker, p. 129.
86 Ibid.
87 Ibid., p. 53.
88 Green, The uncertainties of everyday life, p. 214.
89 Ibid., pp. 215–216.
90 Schlereth, Victorian America, p. 193.
91 Green, The uncertainties of everyday life, p. 189.
92 Schlereth, Victorian America, p. 135.