An official website of the United States government
 United States Department of Labor
An official website of the United States government
United States Department of Labor

The .gov means it's official.
Federal government websites often end in .gov or .mil. Before sharing sensitive information,
make sure you're on a federal government site.

The site is secure.
The
https:// ensures that you are connecting to the official website and that any
information you provide is encrypted and transmitted securely.

Consumer purchasing habits changed substantially between 2016 and 2025, particularly during the COVID-19 pandemic, when many consumers shifted from brick-and-mortar stores to online shopping for both essential and nonessential goods. These changes in shopping behavior, along with broader structural shifts in the retail industry, contributed to little net employment growth in retail trade over the decade, while employment trends varied considerably across retail subsectors. This article examines these employment patterns, highlighting medium-growth, slow-growth, and contracting retail industries, and analyzes the relationship between retail sales and employment.
The retail trade industry comprises of establishments primarily engaged in retailing merchandise, generally without transformation, and rendering services incidental to the sale of merchandise, according to the 2022 North American Industry Classification System (NAICS).1 With the release of January 2023 estimates, the U.S. Bureau of Labor Statistics Current Employment Statistics (CES) program updated its industry classification from NAICS 2017 to NAICS 2022, implementing major reclassifications.2 Employment at internet purchasing establishments was redistributed from nonstore retailers to the retail industries corresponding to the primary goods sold, reflecting a classification change rather than new job growth.
Under NAICS 2022, retail establishments were classified into 9 major subsectors, down from 12 major subsectors in NAICS 2017.3 These industries are motor vehicle and parts dealers; building material and garden equipment and supplies dealers; food and beverage retailers; furniture, home furnishings, electronics, and appliance retailers; general merchandise retailers; health and personal care retailers; gasoline stations and fuel dealers; clothing, clothing accessories, shoe, and jewelry retailers; sporting goods, hobby, musical instrument, book, and miscellaneous retailers.
This article analyzes employment trends in the retail trade industry from 2016 to 2025, specifically by organizing the nine major retail subsectors into medium-growth, slow-growth, and contracting industries. The article, using U.S. Census Bureau data, also explains how retail and e-commerce sales may have affected retail trade employment.
From December 2015 to December 2025, employment in retail trade fell by 217,000, or −1 percent. In contrast, total private employment grew by 12 percent over the same period. Retail trade employment peaked in January 2017 and then began to decline. (See chart 1.) The decline in employment during 2017, 2018, and 2019 (−269,000) coincided with a period when the industry experienced a wave of bankruptcies, often referred to as the “retail apocalypse,” which was driven by a combination of structural, economic, and consumer behavior shifts.4
| Year | Employment in thousands |
|---|---|
|
2016 |
188 |
|
2017 |
-78 |
|
2018 |
-105 |
|
2019 |
-85 |
|
2020 |
-406 |
|
2021 |
278 |
|
2022 |
112 |
|
2023 |
17 |
|
2024 |
-91 |
|
2025 |
-47 |
|
Source: U.S. Bureau of Labor Statistics. |
|
In 2020, employment declined by an additional 406,000, reflecting COVID-19-related job losses as most retail establishments were required to shut down due to the pandemic.5 In March and April 2020, the industry lost 2.3 million jobs, accounting for 11 percent of the employment decline in total private employment during these months. Almost 2 years later, in February 2022, employment in retail trade was slightly above its prepandemic level of 15.5 million jobs. Retail trade employment changed little in 2023 before declining modestly in 2024 and 2025. Although employment returned to approximately its prepandemic level by February 2022, subsequent declines left the industry with 106,000 fewer jobs by December 2025 than in February 2020.
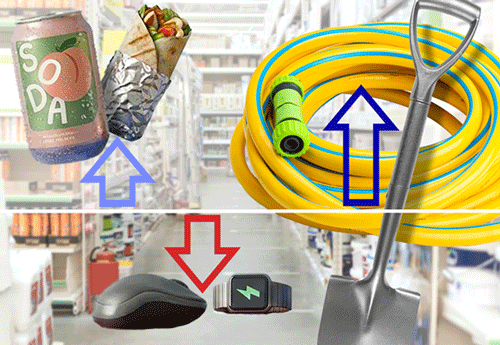
Over the 10-year period from 2016 to 2025, most of the retail trade industries experienced little or moderate job gains, while some encountered sizable employment declines. (See table 1.) In this analysis, we grouped the nine major industry components in retail trade into three categories based on employment growth rates relative to total private employment:
Medium-growth industries are those which grew by 7 percent or more, but less than 12 percent over the period.
Slow-growth industries are those which grew by 1 percent or more, but less than 7 percent over the period.
Contracting industries are those in which employment declined.
| Industry | Employment change (Dec 2015–25) | Percent change |
|---|---|---|
Total Private | 14,103 | 12 |
Retail trade | -217 | -1 |
Medium-growth industries | ||
Building material and garden equipment and supplies dealers | 119 | 9 |
Gasoline stations and fuel dealers | 69 | 7 |
Slow-growth industries | ||
Food and beverage retailers | 131 | 4 |
Motor vehicle and parts dealers | 84 | 4 |
General merchandise retailers | 17 | 1 |
Contracting industries | ||
Furniture, home furnishings, electronics, and appliance retailers | -253 | -25 |
Clothing, clothing accessories, shoe, and jewelry retailers | -243 | -17 |
Sporting goods, hobby, musical instrument, book, and miscellaneous retailers | -103 | -6 |
Health and personal care retailers | -38 | -4 |
Source: U.S. Bureau of Labor Statistics, Current Employment Statistics survey | ||
Employment growth varied across retail trade industries from 2016 to 2025. Two retail trade industries grew at a medium pace during this period: building material and garden equipment and supplies dealers; and gasoline stations and fuel dealers. (See chart 2.)
| Month | Total private | Building material and garden equipment and supplies dealers | Gasoline stations and fuel dealers |
|---|---|---|---|
|
Dec 2015 |
100.0 | 100.0 | 100.0 |
|
Jan 2016 |
100.1 | 100.1 | 100.1 |
|
Feb 2016 |
100.2 | 100.6 | 100.3 |
|
Mar 2016 |
100.4 | 102.1 | 100.5 |
|
Apr 2016 |
100.6 | 101.6 | 100.6 |
|
May 2016 |
100.6 | 101.6 | 100.6 |
|
Jun 2016 |
100.8 | 101.8 | 100.2 |
|
Jul 2016 |
101.0 | 101.6 | 100.8 |
|
Aug 2016 |
101.2 | 102.3 | 100.6 |
|
Sep 2016 |
101.4 | 101.6 | 101.4 |
|
Oct 2016 |
101.5 | 101.5 | 101.2 |
|
Nov 2016 |
101.6 | 101.4 | 100.8 |
|
Dec 2016 |
101.8 | 101.5 | 101.2 |
|
Jan 2017 |
101.9 | 101.6 | 101.2 |
|
Feb 2017 |
102.1 | 101.5 | 101.4 |
|
Mar 2017 |
102.2 | 102.4 | 101.4 |
|
Apr 2017 |
102.4 | 101.2 | 101.1 |
|
May 2017 |
102.5 | 101.3 | 101.3 |
|
Jun 2017 |
102.7 | 101.5 | 101.4 |
|
Jul 2017 |
102.8 | 102.0 | 101.2 |
|
Aug 2017 |
103.0 | 102.2 | 101.3 |
|
Sep 2017 |
103.1 | 102.7 | 101.3 |
|
Oct 2017 |
103.1 | 103.2 | 101.0 |
|
Nov 2017 |
103.3 | 103.6 | 101.4 |
|
Dec 2017 |
103.4 | 103.8 | 101.1 |
|
Jan 2018 |
103.6 | 104.2 | 101.2 |
|
Feb 2018 |
103.8 | 105.1 | 101.4 |
|
Mar 2018 |
104.0 | 105.5 | 101.6 |
|
Apr 2018 |
104.1 | 105.0 | 101.6 |
|
May 2018 |
104.4 | 104.9 | 101.5 |
|
Jun 2018 |
104.5 | 104.6 | 101.3 |
|
Jul 2018 |
104.6 | 104.4 | 101.2 |
|
Aug 2018 |
104.8 | 104.0 | 101.1 |
|
Sep 2018 |
104.9 | 103.6 | 101.3 |
|
Oct 2018 |
105.0 | 103.3 | 100.8 |
|
Nov 2018 |
105.1 | 103.2 | 101.4 |
|
Dec 2018 |
105.2 | 103.0 | 101.7 |
|
Jan 2019 |
105.4 | 102.9 | 102.2 |
|
Feb 2019 |
105.4 | 103.2 | 102.4 |
|
Mar 2019 |
105.6 | 103.6 | 102.2 |
|
Apr 2019 |
105.8 | 103.6 | 102.2 |
|
May 2019 |
105.8 | 103.7 | 102.4 |
|
Jun 2019 |
106.0 | 103.5 | 102.6 |
|
Jul 2019 |
106.1 | 103.5 | 103.0 |
|
Aug 2019 |
106.3 | 103.9 | 103.2 |
|
Sep 2019 |
106.4 | 104.0 | 103.3 |
|
Oct 2019 |
106.5 | 104.0 | 103.8 |
|
Nov 2019 |
106.6 | 103.2 | 103.8 |
|
Dec 2019 |
106.7 | 103.2 | 104.0 |
|
Jan 2020 |
106.8 | 103.3 | 104.2 |
|
Feb 2020 |
107.0 | 103.4 | 104.0 |
|
Mar 2020 |
105.9 | 105.3 | 103.2 |
|
Apr 2020 |
89.7 | 102.3 | 98.4 |
|
May 2020 |
92.3 | 105.9 | 97.8 |
|
Jun 2020 |
96.1 | 109.4 | 98.7 |
|
Jul 2020 |
97.3 | 110.0 | 99.4 |
|
Aug 2020 |
98.2 | 111.9 | 100.0 |
|
Sep 2020 |
99.1 | 112.9 | 100.7 |
|
Oct 2020 |
99.7 | 112.8 | 100.9 |
|
Nov 2020 |
100.1 | 112.8 | 101.2 |
|
Dec 2020 |
99.9 | 115.4 | 101.3 |
|
Jan 2021 |
100.1 | 113.3 | 101.2 |
|
Feb 2021 |
100.5 | 112.7 | 100.9 |
|
Mar 2021 |
101.2 | 112.5 | 101.4 |
|
Apr 2021 |
101.4 | 111.7 | 100.3 |
|
May 2021 |
101.8 | 112.5 | 100.8 |
|
Jun 2021 |
102.3 | 114.2 | 101.6 |
|
Jul 2021 |
103.1 | 112.2 | 102.0 |
|
Aug 2021 |
103.5 | 111.9 | 102.2 |
|
Sep 2021 |
103.9 | 112.6 | 102.0 |
|
Oct 2021 |
104.6 | 111.9 | 102.1 |
|
Nov 2021 |
105.1 | 111.9 | 102.4 |
|
Dec 2021 |
105.6 | 112.1 | 102.5 |
|
Jan 2022 |
105.8 | 112.8 | 102.8 |
|
Feb 2022 |
106.5 | 113.9 | 103.3 |
|
Mar 2022 |
106.9 | 114.1 | 103.5 |
|
Apr 2022 |
107.1 | 109.9 | 103.9 |
|
May 2022 |
107.3 | 111.7 | 104.2 |
|
Jun 2022 |
107.6 | 114.0 | 104.3 |
|
Jul 2022 |
108.1 | 113.6 | 104.5 |
|
Aug 2022 |
108.3 | 113.5 | 104.7 |
|
Sep 2022 |
108.5 | 112.9 | 104.9 |
|
Oct 2022 |
108.8 | 113.7 | 105.4 |
|
Nov 2022 |
109.0 | 114.4 | 105.5 |
|
Dec 2022 |
109.1 | 114.1 | 105.7 |
|
Jan 2023 |
109.4 | 113.8 | 106.3 |
|
Feb 2023 |
109.5 | 113.1 | 106.0 |
|
Mar 2023 |
109.6 | 112.5 | 105.6 |
|
Apr 2023 |
109.7 | 112.2 | 106.5 |
|
May 2023 |
109.9 | 111.9 | 106.3 |
|
Jun 2023 |
110.0 | 111.8 | 106.4 |
|
Jul 2023 |
110.1 | 111.8 | 106.4 |
|
Aug 2023 |
110.2 | 112.0 | 106.2 |
|
Sep 2023 |
110.3 | 111.8 | 106.5 |
|
Oct 2023 |
110.4 | 112.1 | 106.1 |
|
Nov 2023 |
110.5 | 112.1 | 106.0 |
|
Dec 2023 |
110.6 | 114.4 | 106.1 |
|
Jan 2024 |
110.7 | 112.1 | 106.1 |
|
Feb 2024 |
110.8 | 111.6 | 106.1 |
|
Mar 2024 |
110.9 | 110.5 | 106.2 |
|
Apr 2024 |
111.0 | 111.3 | 106.3 |
|
May 2024 |
111.0 | 112.2 | 106.3 |
|
Jun 2024 |
111.1 | 111.2 | 106.3 |
|
Jul 2024 |
111.0 | 111.1 | 106.0 |
|
Aug 2024 |
111.0 | 111.4 | 106.0 |
|
Sep 2024 |
111.1 | 111.3 | 105.8 |
|
Oct 2024 |
111.1 | 111.3 | 105.5 |
|
Nov 2024 |
111.2 | 110.8 | 105.5 |
|
Dec 2024 |
111.4 | 110.6 | 105.7 |
|
Jan 2025 |
111.3 | 110.5 | 105.5 |
|
Feb 2025 |
111.4 | 110.5 | 105.9 |
|
Mar 2025 |
111.4 | 110.6 | 105.7 |
|
Apr 2025 |
111.5 | 110.8 | 105.6 |
|
May 2025 |
111.5 | 109.7 | 105.6 |
|
Jun 2025 |
111.5 | 109.6 | 105.5 |
|
Jul 2025 |
111.6 | 109.4 | 106.1 |
|
Aug 2025 |
111.5 | 109.0 | 105.6 |
|
Sep 2025 |
111.6 | 108.7 | 106.3 |
|
Oct 2025 |
111.6 | 108.6 | 106.7 |
|
Nov 2025 |
111.7 | 109.0 | 107.1 |
|
Dec 2025 |
111.7 | 109.4 | 107.0 |
|
Source: U.S. Bureau of Labor Statistics. |
|||
Employment in building material and garden equipment and supplies dealers increased by 9 percent over the period, making it the industry with the strongest job growth among all the major retail trade subsectors. Employment rose 5 percent between December 2015 and March 2020 before declining 3 percent in April 2020, but quickly rebounded by 4 percent in May 2020. By December 2020, employment reached 1.5 million, its highest level since the series’ inception in January 1990. Thereafter, employment trended downward but was 76,000 above its prepandemic level as of December 2025.
Within building material and garden equipment and supplies dealers, employment in home centers, paint, wallpaper, and other building material dealers grew by 68,000 (+7 percent) from December 2015 to December 2025. Notably, this industry added a net 24,000 jobs in March 2020 and expanded by 76,000 from February 2020 to December 2025. This growth was in line with a 3-percent increase in spending on home improvements and repairs in 2020 as households modified living spaces for work, school, and leisure during the COVID-19 pandemic.6
From December 2015 to December 2025, gasoline stations and fuel dealers grew by 7 percent, making it the retail trade industry with the second largest job growth over this period. Employment in this industry grew by 4 percent from December 2015 to February 2020. In March and April 2020, employment fell by 5 percent and did not recover to its prepandemic level until May 2022. As of December 2025, employment in the industry was 3 percent higher than in February 2020.
Job growth was sluggish in motor vehicle and parts dealers, food and beverage retailers, and general merchandise retailers, from December 2015 to December 2025. (See chart 3.)
| Month | Total private | Food and beverage retailers | Motor vehicle and parts dealers | General merchandise retailers |
|---|---|---|---|---|
|
Dec 2015 |
100.0 | 100.0 | 100.0 | 100.0 |
|
Jan 2016 |
100.1 | 100.1 | 100.3 | 100.2 |
|
Feb 2016 |
100.2 | 100.7 | 100.4 | 100.7 |
|
Mar 2016 |
100.4 | 100.8 | 100.6 | 101.3 |
|
Apr 2016 |
100.6 | 101.0 | 100.6 | 101.1 |
|
May 2016 |
100.6 | 101.1 | 100.7 | 101.2 |
|
Jun 2016 |
100.8 | 101.3 | 100.8 | 101.2 |
|
Jul 2016 |
101.0 | 101.3 | 100.8 | 101.1 |
|
Aug 2016 |
101.2 | 101.5 | 101.1 | 101.2 |
|
Sep 2016 |
101.4 | 101.6 | 101.3 | 101.2 |
|
Oct 2016 |
101.5 | 101.5 | 101.5 | 101.5 |
|
Nov 2016 |
101.6 | 101.4 | 101.7 | 101.2 |
|
Dec 2016 |
101.8 | 101.3 | 101.9 | 101.0 |
|
Jan 2017 |
101.9 | 101.3 | 102.1 | 101.1 |
|
Feb 2017 |
102.1 | 101.3 | 102.3 | 100.5 |
|
Mar 2017 |
102.2 | 101.3 | 102.2 | 99.5 |
|
Apr 2017 |
102.4 | 101.0 | 102.2 | 99.8 |
|
May 2017 |
102.5 | 101.0 | 102.1 | 99.5 |
|
Jun 2017 |
102.7 | 101.0 | 102.1 | 99.6 |
|
Jul 2017 |
102.8 | 100.9 | 102.3 | 99.7 |
|
Aug 2017 |
103.0 | 100.9 | 102.2 | 99.8 |
|
Sep 2017 |
103.1 | 100.8 | 102.1 | 99.7 |
|
Oct 2017 |
103.1 | 100.6 | 102.5 | 99.5 |
|
Nov 2017 |
103.3 | 101.0 | 102.6 | 99.6 |
|
Dec 2017 |
103.4 | 101.0 | 102.6 | 98.8 |
|
Jan 2018 |
103.6 | 100.8 | 102.6 | 97.8 |
|
Feb 2018 |
103.8 | 100.8 | 102.7 | 98.7 |
|
Mar 2018 |
104.0 | 100.7 | 102.6 | 98.7 |
|
Apr 2018 |
104.1 | 100.7 | 102.5 | 99.0 |
|
May 2018 |
104.4 | 100.8 | 102.6 | 99.3 |
|
Jun 2018 |
104.5 | 100.4 | 102.8 | 98.5 |
|
Jul 2018 |
104.6 | 100.5 | 103.0 | 98.9 |
|
Aug 2018 |
104.8 | 100.5 | 102.9 | 99.8 |
|
Sep 2018 |
104.9 | 100.3 | 102.9 | 98.9 |
|
Oct 2018 |
105.0 | 100.3 | 103.1 | 98.6 |
|
Nov 2018 |
105.1 | 100.4 | 102.8 | 99.0 |
|
Dec 2018 |
105.2 | 100.6 | 102.9 | 97.7 |
|
Jan 2019 |
105.4 | 100.5 | 103.0 | 97.5 |
|
Feb 2019 |
105.4 | 100.6 | 103.0 | 96.9 |
|
Mar 2019 |
105.6 | 100.5 | 103.1 | 96.7 |
|
Apr 2019 |
105.8 | 100.5 | 103.4 | 96.5 |
|
May 2019 |
105.8 | 100.4 | 103.4 | 96.5 |
|
Jun 2019 |
106.0 | 100.4 | 103.2 | 96.3 |
|
Jul 2019 |
106.1 | 100.5 | 103.2 | 96.5 |
|
Aug 2019 |
106.3 | 100.3 | 103.5 | 96.1 |
|
Sep 2019 |
106.4 | 100.6 | 103.6 | 96.4 |
|
Oct 2019 |
106.5 | 100.8 | 103.6 | 96.2 |
|
Nov 2019 |
106.6 | 100.8 | 103.9 | 96.4 |
|
Dec 2019 |
106.7 | 100.7 | 103.9 | 96.3 |
|
Jan 2020 |
106.8 | 100.4 | 104.2 | 96.1 |
|
Feb 2020 |
107.0 | 100.2 | 104.1 | 95.8 |
|
Mar 2020 |
105.9 | 100.0 | 103.2 | 96.0 |
|
Apr 2020 |
89.7 | 98.9 | 84.7 | 91.0 |
|
May 2020 |
92.3 | 101.0 | 88.9 | 93.7 |
|
Jun 2020 |
96.1 | 102.3 | 93.9 | 98.3 |
|
Jul 2020 |
97.3 | 101.7 | 95.2 | 97.8 |
|
Aug 2020 |
98.2 | 102.1 | 96.3 | 101.7 |
|
Sep 2020 |
99.1 | 102.4 | 97.0 | 98.3 |
|
Oct 2020 |
99.7 | 102.7 | 97.6 | 98.9 |
|
Nov 2020 |
100.1 | 102.8 | 97.9 | 100.0 |
|
Dec 2020 |
99.9 | 102.9 | 98.3 | 97.9 |
|
Jan 2021 |
100.1 | 102.9 | 98.3 | 99.0 |
|
Feb 2021 |
100.5 | 103.1 | 98.5 | 98.7 |
|
Mar 2021 |
101.2 | 103.3 | 98.7 | 98.4 |
|
Apr 2021 |
101.4 | 101.5 | 99.2 | 98.1 |
|
May 2021 |
101.8 | 101.5 | 99.3 | 96.5 |
|
Jun 2021 |
102.3 | 101.6 | 99.6 | 96.7 |
|
Jul 2021 |
103.1 | 101.6 | 99.8 | 96.3 |
|
Aug 2021 |
103.5 | 101.2 | 99.8 | 96.0 |
|
Sep 2021 |
103.9 | 100.7 | 100.1 | 97.2 |
|
Oct 2021 |
104.6 | 101.2 | 100.2 | 98.1 |
|
Nov 2021 |
105.1 | 101.5 | 100.3 | 99.0 |
|
Dec 2021 |
105.6 | 101.4 | 100.4 | 99.7 |
|
Jan 2022 |
105.8 | 101.2 | 100.7 | 99.3 |
|
Feb 2022 |
106.5 | 101.5 | 101.4 | 100.9 |
|
Mar 2022 |
106.9 | 102.1 | 101.8 | 100.3 |
|
Apr 2022 |
107.1 | 101.8 | 102.0 | 100.7 |
|
May 2022 |
107.3 | 101.8 | 102.0 | 98.0 |
|
Jun 2022 |
107.6 | 102.0 | 102.2 | 97.6 |
|
Jul 2022 |
108.1 | 102.5 | 102.3 | 97.8 |
|
Aug 2022 |
108.3 | 103.2 | 102.4 | 98.1 |
|
Sep 2022 |
108.5 | 103.0 | 102.3 | 98.1 |
|
Oct 2022 |
108.8 | 102.9 | 102.4 | 98.0 |
|
Nov 2022 |
109.0 | 103.2 | 102.9 | 97.9 |
|
Dec 2022 |
109.1 | 103.6 | 102.9 | 97.9 |
|
Jan 2023 |
109.4 | 104.0 | 102.9 | 98.4 |
|
Feb 2023 |
109.5 | 103.8 | 103.0 | 100.5 |
|
Mar 2023 |
109.6 | 103.6 | 102.9 | 100.3 |
|
Apr 2023 |
109.7 | 103.5 | 102.9 | 100.3 |
|
May 2023 |
109.9 | 103.5 | 103.3 | 100.6 |
|
Jun 2023 |
110.0 | 103.3 | 103.4 | 100.7 |
|
Jul 2023 |
110.1 | 103.5 | 103.5 | 100.6 |
|
Aug 2023 |
110.2 | 103.6 | 103.7 | 100.6 |
|
Sep 2023 |
110.3 | 103.3 | 104.0 | 100.8 |
|
Oct 2023 |
110.4 | 103.3 | 104.1 | 101.0 |
|
Nov 2023 |
110.5 | 103.2 | 104.1 | 100.6 |
|
Dec 2023 |
110.6 | 103.1 | 104.2 | 101.0 |
|
Jan 2024 |
110.7 | 103.3 | 104.1 | 100.8 |
|
Feb 2024 |
110.8 | 103.4 | 104.2 | 101.2 |
|
Mar 2024 |
110.9 | 103.3 | 104.1 | 101.9 |
|
Apr 2024 |
111.0 | 103.3 | 104.2 | 101.9 |
|
May 2024 |
111.0 | 103.5 | 104.1 | 101.5 |
|
Jun 2024 |
111.1 | 103.5 | 104.1 | 101.6 |
|
Jul 2024 |
111.0 | 103.4 | 104.1 | 101.7 |
|
Aug 2024 |
111.0 | 103.5 | 103.9 | 101.3 |
|
Sep 2024 |
111.1 | 103.7 | 104.0 | 101.3 |
|
Oct 2024 |
111.1 | 103.9 | 104.0 | 101.3 |
|
Nov 2024 |
111.2 | 104.1 | 104.0 | 100.8 |
|
Dec 2024 |
111.4 | 104.1 | 103.8 | 101.0 |
|
Jan 2025 |
111.3 | 104.1 | 104.2 | 101.5 |
|
Feb 2025 |
111.4 | 103.6 | 104.4 | 101.6 |
|
Mar 2025 |
111.4 | 104.3 | 104.3 | 101.4 |
|
Apr 2025 |
111.5 | 104.6 | 104.3 | 101.4 |
|
May 2025 |
111.5 | 104.5 | 104.3 | 101.2 |
|
Jun 2025 |
111.5 | 104.5 | 104.0 | 100.9 |
|
Jul 2025 |
111.6 | 104.4 | 103.9 | 101.1 |
|
Aug 2025 |
111.5 | 104.5 | 104.0 | 101.5 |
|
Sep 2025 |
111.6 | 104.7 | 104.0 | 101.5 |
|
Oct 2025 |
111.6 | 104.8 | 104.0 | 101.1 |
|
Nov 2025 |
111.7 | 104.7 | 104.1 | 101.0 |
|
Dec 2025 |
111.7 | 104.2 | 104.3 | 100.5 |
|
Source: U.S. Bureau of Labor Statistics. |
||||
Among the slow-growth industries, motor vehicle and parts dealers and food and beverage retailers exhibited the strongest employment gains, with each rising by 4 percent. Despite the identical growth rates over the decade, the two industries followed markedly different paths after 2016.
Employment in motor vehicle and parts dealers—which is partially driven by vehicle sales—rose 4 percent from December 2015 to February 2020, outpacing the other slow-growth industries in this prepandemic period. However, in March and April 2020, the industry lost 382,000 jobs, representing 19 percent of its February 2020 level. Motor vehicle and parts dealers were required to shut down during the pandemic because of COVID-19 restrictions.7 Total vehicle sales declined 48 percent over the same 2-month period.8 By October 2023, employment had fully recovered and remained flat through December 2025. Despite the recovery in employment, vehicle sales in December 2025 remained 4 percent below their prepandemic level.
Food and beverage retailers experienced little net employment change before the pandemic, then shed 41,000 jobs (−1 percent) in March and April 2020 but recovered to its prepandemic level in May 2020. By December 2025, employment expanded by 124,000 (+4 percent) above its February 2020 level.
Within food and beverage retailers, grocery and convenience retailers (including supermarkets and other grocery retailers) accounted for all the employment growth—and more. These retailers experienced a surge in demand in March and April 2020, adding 37,000 jobs as households urgently stocked up on food and essential supplies during the early months of the pandemic. Retail sales at food and beverage stores rose 10 percent over those 2 months.9 Grocery and convenience retailers accounted for 106 percent of the employment increase in food and beverage retailers from February 2020 to December 2025.
Employment in general merchandise retailers grew by 1 percent from December 2015 to December 2025, despite notable volatility over the period. Employment was trending downward prior to the pandemic and subsequently shed 155,000 jobs (−5 percent) in March and April 2020. The decline was driven primarily by losses in department stores (−249,000), which more than offset gains in warehouse clubs, supercenters, and other general merchandise retailers (+95,000). Unlike many other retail trade industries, warehouse clubs, supercenters, and other general merchandise retailers were classified as essential businesses and remained open during the pandemic, providing groceries, toiletries, and other essential goods during the lockdowns.10 Employment in general merchandise retailers rebounded over the next 4 years, reaching a peak of 3.3 million in March 2024. By December 2025, employment had declined by 1 percent from that peak.
The onset of the pandemic triggered widespread department store shutdowns, as many retailers closed physical locations. The impact on the broader retail industry was profound, leading to a surge in store closures and bankruptcies. In contrast, warehouse clubs, supercenters, and other general merchandise retailers remained essential, serving consumers’ needs for groceries, toiletries, and other vital items during the lockdowns.11
By December 2025, general merchandise retailers and food and beverage retailers were the largest employers within retail trade, with the same level of employment—3.2 million each. Each subsector accounted for 21 percent of total retail trade employment, the largest share among the nine major retail subsectors. Combined, the two subsectors made up 42 percent of retail trade employment in December 2025.
Among the retail trade industries, furniture, home furnishings, electronics, and appliance retailers (−25 percent) and clothing, clothing accessories, shoe and jewelry retailers (−17 percent) experienced the largest employment declines from 2016 to 2025. Employment also declined in sporting goods, hobby, musical instrument, book, and miscellaneous retailers (−6 percent) and health and personal care retailers (−4 percent). (See chart 4.)
| Month | Total private | Furniture, home furnishings, electronics, and appliance retailers | Clothing, clothing accessories, shoe, and jewelry retailers | Sporting goods, hobby, musical instrument, book, and miscellaneous retailers | Health and personal care retailers |
|---|---|---|---|---|---|
|
Dec 2015 |
100.0 | 100.0 | 100.0 | 100.0 | 100.0 |
|
Jan 2016 |
100.1 | 100.4 | 100.7 | 100.0 | 100.2 |
|
Feb 2016 |
100.2 | 100.7 | 100.9 | 99.8 | 100.4 |
|
Mar 2016 |
100.4 | 100.7 | 100.7 | 100.1 | 100.9 |
|
Apr 2016 |
100.6 | 100.7 | 100.7 | 99.9 | 101.5 |
|
May 2016 |
100.6 | 100.7 | 100.6 | 99.9 | 101.5 |
|
Jun 2016 |
100.8 | 100.9 | 100.7 | 100.1 | 102.0 |
|
Jul 2016 |
101.0 | 101.0 | 101.3 | 100.1 | 102.1 |
|
Aug 2016 |
101.2 | 100.7 | 101.3 | 100.2 | 102.4 |
|
Sep 2016 |
101.4 | 100.7 | 101.8 | 99.5 | 102.6 |
|
Oct 2016 |
101.5 | 99.5 | 101.7 | 99.9 | 102.8 |
|
Nov 2016 |
101.6 | 99.0 | 99.7 | 99.6 | 103.2 |
|
Dec 2016 |
101.8 | 99.1 | 102.0 | 99.5 | 103.5 |
|
Jan 2017 |
101.9 | 100.3 | 103.7 | 99.7 | 104.1 |
|
Feb 2017 |
102.1 | 100.2 | 103.5 | 99.7 | 103.8 |
|
Mar 2017 |
102.2 | 100.2 | 103.4 | 99.5 | 103.7 |
|
Apr 2017 |
102.4 | 100.1 | 103.4 | 99.6 | 103.5 |
|
May 2017 |
102.5 | 99.6 | 103.1 | 99.5 | 103.8 |
|
Jun 2017 |
102.7 | 99.0 | 102.8 | 99.5 | 103.1 |
|
Jul 2017 |
102.8 | 98.7 | 102.1 | 99.4 | 103.0 |
|
Aug 2017 |
103.0 | 98.6 | 101.7 | 99.3 | 102.8 |
|
Sep 2017 |
103.1 | 98.5 | 101.1 | 99.4 | 103.0 |
|
Oct 2017 |
103.1 | 98.3 | 101.2 | 99.0 | 102.9 |
|
Nov 2017 |
103.3 | 98.1 | 101.1 | 99.2 | 103.6 |
|
Dec 2017 |
103.4 | 98.2 | 100.3 | 99.1 | 103.6 |
|
Jan 2018 |
103.6 | 98.2 | 101.1 | 98.3 | 102.9 |
|
Feb 2018 |
103.8 | 98.1 | 101.5 | 98.5 | 102.8 |
|
Mar 2018 |
104.0 | 98.4 | 101.6 | 98.9 | 103.2 |
|
Apr 2018 |
104.1 | 98.5 | 101.2 | 99.2 | 103.1 |
|
May 2018 |
104.4 | 98.5 | 101.6 | 99.2 | 103.0 |
|
Jun 2018 |
104.5 | 98.5 | 101.4 | 99.0 | 103.0 |
|
Jul 2018 |
104.6 | 98.5 | 101.5 | 97.0 | 102.8 |
|
Aug 2018 |
104.8 | 98.4 | 100.4 | 96.8 | 102.9 |
|
Sep 2018 |
104.9 | 98.1 | 100.4 | 96.6 | 103.1 |
|
Oct 2018 |
105.0 | 97.4 | 99.5 | 96.2 | 102.9 |
|
Nov 2018 |
105.1 | 96.2 | 101.8 | 96.4 | 103.4 |
|
Dec 2018 |
105.2 | 96.7 | 100.1 | 96.4 | 103.3 |
|
Jan 2019 |
105.4 | 96.8 | 99.3 | 96.6 | 103.0 |
|
Feb 2019 |
105.4 | 96.5 | 99.0 | 96.6 | 101.6 |
|
Mar 2019 |
105.6 | 96.5 | 98.5 | 96.8 | 101.2 |
|
Apr 2019 |
105.8 | 96.5 | 98.0 | 96.8 | 101.6 |
|
May 2019 |
105.8 | 96.5 | 97.1 | 96.7 | 101.4 |
|
Jun 2019 |
106.0 | 96.4 | 96.3 | 96.8 | 101.4 |
|
Jul 2019 |
106.1 | 95.8 | 95.7 | 96.9 | 101.3 |
|
Aug 2019 |
106.3 | 95.3 | 95.5 | 97.2 | 100.7 |
|
Sep 2019 |
106.4 | 95.5 | 94.5 | 97.3 | 100.1 |
|
Oct 2019 |
106.5 | 95.4 | 93.3 | 97.3 | 101.4 |
|
Nov 2019 |
106.6 | 96.3 | 92.2 | 97.2 | 100.7 |
|
Dec 2019 |
106.7 | 95.8 | 96.1 | 97.0 | 100.4 |
|
Jan 2020 |
106.8 | 95.1 | 94.3 | 97.5 | 99.8 |
|
Feb 2020 |
107.0 | 95.3 | 95.5 | 97.6 | 100.0 |
|
Mar 2020 |
105.9 | 93.8 | 92.9 | 95.7 | 99.9 |
|
Apr 2020 |
89.7 | 69.7 | 40.5 | 67.1 | 89.9 |
|
May 2020 |
92.3 | 66.9 | 46.1 | 73.2 | 86.3 |
|
Jun 2020 |
96.1 | 77.0 | 61.8 | 81.3 | 89.6 |
|
Jul 2020 |
97.3 | 81.4 | 68.8 | 84.6 | 91.5 |
|
Aug 2020 |
98.2 | 83.8 | 69.8 | 86.0 | 93.1 |
|
Sep 2020 |
99.1 | 85.3 | 72.7 | 88.1 | 94.5 |
|
Oct 2020 |
99.7 | 88.9 | 73.2 | 89.7 | 94.5 |
|
Nov 2020 |
100.1 | 88.8 | 73.9 | 88.7 | 94.3 |
|
Dec 2020 |
99.9 | 88.8 | 74.3 | 90.1 | 95.2 |
|
Jan 2021 |
100.1 | 86.8 | 74.7 | 91.0 | 96.5 |
|
Feb 2021 |
100.5 | 87.0 | 74.8 | 92.2 | 97.6 |
|
Mar 2021 |
101.2 | 87.8 | 75.7 | 92.8 | 98.9 |
|
Apr 2021 |
101.4 | 88.3 | 76.1 | 93.1 | 100.2 |
|
May 2021 |
101.8 | 88.4 | 77.7 | 93.5 | 100.6 |
|
Jun 2021 |
102.3 | 88.3 | 78.4 | 93.9 | 100.3 |
|
Jul 2021 |
103.1 | 88.2 | 78.4 | 95.4 | 100.1 |
|
Aug 2021 |
103.5 | 88.4 | 79.0 | 95.0 | 99.9 |
|
Sep 2021 |
103.9 | 88.7 | 80.4 | 94.9 | 100.8 |
|
Oct 2021 |
104.6 | 90.7 | 80.4 | 94.8 | 101.8 |
|
Nov 2021 |
105.1 | 91.2 | 80.8 | 94.6 | 102.4 |
|
Dec 2021 |
105.6 | 91.1 | 81.3 | 93.4 | 102.6 |
|
Jan 2022 |
105.8 | 89.2 | 81.5 | 94.5 | 103.4 |
|
Feb 2022 |
106.5 | 90.7 | 81.5 | 94.5 | 103.4 |
|
Mar 2022 |
106.9 | 90.2 | 81.5 | 94.4 | 102.9 |
|
Apr 2022 |
107.1 | 89.8 | 81.9 | 94.5 | 101.9 |
|
May 2022 |
107.3 | 89.5 | 81.7 | 94.7 | 101.6 |
|
Jun 2022 |
107.6 | 89.5 | 82.3 | 95.2 | 101.6 |
|
Jul 2022 |
108.1 | 89.0 | 82.2 | 95.6 | 102.0 |
|
Aug 2022 |
108.3 | 88.4 | 82.4 | 95.3 | 102.7 |
|
Sep 2022 |
108.5 | 87.4 | 82.7 | 94.9 | 102.9 |
|
Oct 2022 |
108.8 | 86.7 | 82.9 | 95.2 | 102.9 |
|
Nov 2022 |
109.0 | 85.4 | 83.2 | 95.1 | 103.3 |
|
Dec 2022 |
109.1 | 85.2 | 83.1 | 95.0 | 103.4 |
|
Jan 2023 |
109.4 | 84.9 | 83.1 | 95.0 | 102.4 |
|
Feb 2023 |
109.5 | 84.9 | 83.2 | 94.8 | 102.3 |
|
Mar 2023 |
109.6 | 84.5 | 83.1 | 94.4 | 102.2 |
|
Apr 2023 |
109.7 | 83.9 | 82.6 | 94.6 | 102.3 |
|
May 2023 |
109.9 | 83.4 | 82.0 | 94.8 | 102.2 |
|
Jun 2023 |
110.0 | 83.0 | 81.5 | 94.3 | 102.2 |
|
Jul 2023 |
110.1 | 82.3 | 81.9 | 94.0 | 102.4 |
|
Aug 2023 |
110.2 | 81.6 | 82.1 | 94.0 | 101.9 |
|
Sep 2023 |
110.3 | 81.2 | 82.1 | 94.0 | 102.0 |
|
Oct 2023 |
110.4 | 80.9 | 82.4 | 94.0 | 101.8 |
|
Nov 2023 |
110.5 | 79.9 | 82.2 | 94.0 | 101.6 |
|
Dec 2023 |
110.6 | 80.0 | 82.5 | 93.8 | 101.3 |
|
Jan 2024 |
110.7 | 79.8 | 83.0 | 93.8 | 101.3 |
|
Feb 2024 |
110.8 | 79.6 | 82.5 | 93.6 | 101.7 |
|
Mar 2024 |
110.9 | 79.4 | 82.2 | 93.9 | 101.5 |
|
Apr 2024 |
111.0 | 78.9 | 82.2 | 93.6 | 101.6 |
|
May 2024 |
111.0 | 78.3 | 82.2 | 93.7 | 101.9 |
|
Jun 2024 |
111.1 | 78.1 | 81.8 | 93.1 | 101.2 |
|
Jul 2024 |
111.0 | 77.8 | 81.6 | 93.2 | 100.3 |
|
Aug 2024 |
111.0 | 78.1 | 81.2 | 92.8 | 99.7 |
|
Sep 2024 |
111.1 | 78.1 | 81.0 | 92.8 | 99.6 |
|
Oct 2024 |
111.1 | 78.0 | 80.6 | 92.5 | 99.7 |
|
Nov 2024 |
111.2 | 77.8 | 80.6 | 91.5 | 99.3 |
|
Dec 2024 |
111.4 | 77.4 | 82.7 | 92.6 | 99.5 |
|
Jan 2025 |
111.3 | 77.2 | 81.1 | 92.9 | 99.4 |
|
Feb 2025 |
111.4 | 76.6 | 81.3 | 92.8 | 98.9 |
|
Mar 2025 |
111.4 | 76.4 | 81.5 | 92.7 | 98.9 |
|
Apr 2025 |
111.5 | 76.2 | 81.6 | 92.7 | 98.7 |
|
May 2025 |
111.5 | 76.1 | 81.9 | 92.5 | 98.6 |
|
Jun 2025 |
111.5 | 75.8 | 81.9 | 92.6 | 98.9 |
|
Jul 2025 |
111.6 | 75.7 | 81.9 | 92.6 | 99.0 |
|
Aug 2025 |
111.5 | 75.5 | 82.4 | 92.8 | 98.6 |
|
Sep 2025 |
111.6 | 75.6 | 82.6 | 92.8 | 98.4 |
|
Oct 2025 |
111.6 | 74.9 | 82.7 | 93.1 | 97.8 |
|
Nov 2025 |
111.7 | 75.6 | 82.3 | 93.3 | 96.9 |
|
Dec 2025 |
111.7 | 75.2 | 82.5 | 93.6 | 96.4 |
|
Source: U.S. Bureau of Labor Statistics. |
|||||
Employment in furniture, home furnishings, electronics, and appliance retailers declined by 5 percent between December 2015 and February 2020, followed by a sharp 30-percent decline from February to May 2020. Furniture and home furnishings retailers accounted for 76 percent of the subsector’s employment losses during March and April 2020, before employment began to recover in May, although it remained below its February 2020 level by 178,000. Employment in the aggregate industry began to trend up in June 2020, reaching a peak in November 2021, but has since fallen by 164,000 (−18 percent). This decline coincided with a period of elevated mortgage rates and a cooling housing market, trends that also aligned with weaker performance in the S&P 500 Home Furnishings (subindustry) Index.12
From December 2015 to February 2020, employment in clothing, clothing accessories, shoe, and jewelry retailers declined by 5 percent. In March and April 2020, the industry experienced the sharpest drop among all the retail sectors, losing 765,000 jobs (−58 percent), including a decline of 620,000 jobs in clothing and clothing accessories retailers. Because spending on clothing and related items is largely discretionary, the closure of brick-and-mortar stores in March and April 2020 led consumers to shift their purchases toward essential goods during the lockdown.13 As a result, retail sales in clothing and clothing accessories stores plunged by 88 percent in those 2 months.14 Clothing and clothing accessories retailers rebounded from its pandemic-related job losses before employment peaked in November 2022 but has since declined by 3 percent. As of December 2025, employment in clothing, clothing accessories, shoe, and jewelry retailers was 180,000 below its prepandemic level.
Employment in sporting goods, hobby, musical instrument, book, and miscellaneous retailers declined by 6 percent from December 2015 to December 2025. Employment in this industry had already been trending downward between December 2015 and February 2020, followed by steep losses at the onset of the pandemic—491,000 jobs, or 31 percent, in March and April 2020. About 72 percent of these losses occurred in sporting goods, hobby, and musical instrument retailers (−158,000), used merchandise retailers (−101,000), and office supplies, stationery, and gift retailers (−96,000). Employment began to recover in the following months, peaking in July 2022. Since then, sporting goods, hobby, musical instrument, book, and miscellaneous retailers lost 32,000 jobs (−2 percent) and was 4 percent below its prepandemic level as of December 2025.
Health and personal care retailers experienced the smallest decrease among the industries with declining employment. Employment fell by 4 percent from December 2015 to December 2025. After reaching a peak in January 2017, employment declined by 43,000 jobs, or 4 percent, by February 2020. From February to May 2020, the industry lost another 148,000 jobs, or 14 percent, with the largest declines occurring in cosmetics, beauty supplies, and perfume retailers (−104,000); optical goods retailers (−19,000); other health and personal care retailers (−15,000); and pharmacies and drug retailers (−10,000). Most of these industries were deemed nonessential and ordered to temporarily close during the pandemic, while brick-and-mortar pharmacies and drug retailers remained open during the early months of the pandemic.15
Employment in health and personal care retailers recovered to its February 2020 level in April 2021, and then continued to trend up until reaching a peak in December 2022. Since then, employment in health and personal care retailers has declined by 7 percent.
The retail trade industry is consumption driven and, in principle, when consumer demand or retail sales increase, employers are likely to hire more workers to accommodate that increased demand. From December 2015 to January 2017, retail trade sales and employment rose by 5 percent and 2 percent, respectively. The correlation between the two variables was strong.16 That is, as retail sales increased, employment increased, and when retail sales decreased, employment also fell.
This relationship broke down in 2017 during the “retail apocalypse” and again in the second half of 2020 after the onset of the pandemic. (See chart 5.) From June 2020 to December 2025, retail sales increased by 36 percent, while retail trade employment rose 7 percent. Trends in e-commerce provide some insight into this divergence. E-commerce sales increased substantially as a share of total retail sales, from 7 percent in the fourth quarter of 2015 to 17 percent in the fourth quarter of 2025.17
| Date | Advanced monthly retail sales, in millions of dollars | Retail trade employment, in thousands |
|---|---|---|
|
Dec 2015 |
389,551 | 15,631 |
|
Jan 2016 |
387,483 | 15,665 |
|
Feb 2016 |
390,029 | 15,715 |
|
Mar 2016 |
388,998 | 15,769 |
|
Apr 2016 |
391,112 | 15,767 |
|
May 2016 |
392,299 | 15,773 |
|
Jun 2016 |
397,113 | 15,790 |
|
Jul 2016 |
396,545 | 15,805 |
|
Aug 2016 |
396,293 | 15,822 |
|
Sep 2016 |
398,797 | 15,829 |
|
Oct 2016 |
399,637 | 15,831 |
|
Nov 2016 |
398,680 | 15,786 |
|
Dec 2016 |
405,114 | 15,819 |
|
Jan 2017 |
408,269 | 15,873 |
|
Feb 2017 |
408,155 | 15,851 |
|
Mar 2017 |
407,630 | 15,822 |
|
Apr 2017 |
409,134 | 15,804 |
|
May 2017 |
406,609 | 15,786 |
|
Jun 2017 |
409,067 | 15,778 |
|
Jul 2017 |
409,113 | 15,769 |
|
Aug 2017 |
409,606 | 15,763 |
|
Sep 2017 |
419,021 | 15,756 |
|
Oct 2017 |
418,999 | 15,749 |
|
Nov 2017 |
423,224 | 15,782 |
|
Dec 2017 |
425,545 | 15,741 |
|
Jan 2018 |
423,202 | 15,705 |
|
Feb 2018 |
425,507 | 15,753 |
|
Mar 2018 |
425,087 | 15,771 |
|
Apr 2018 |
425,899 | 15,771 |
|
May 2018 |
432,340 | 15,786 |
|
Jun 2018 |
430,008 | 15,740 |
|
Jul 2018 |
432,070 | 15,723 |
|
Aug 2018 |
432,031 | 15,725 |
|
Sep 2018 |
431,438 | 15,685 |
|
Oct 2018 |
435,894 | 15,642 |
|
Nov 2018 |
438,612 | 15,686 |
|
Dec 2018 |
428,932 | 15,635 |
|
Jan 2019 |
430,246 | 15,617 |
|
Feb 2019 |
431,194 | 15,587 |
|
Mar 2019 |
438,196 | 15,574 |
|
Apr 2019 |
437,735 | 15,572 |
|
May 2019 |
442,514 | 15,554 |
|
Jun 2019 |
442,116 | 15,533 |
|
Jul 2019 |
445,304 | 15,533 |
|
Aug 2019 |
448,519 | 15,517 |
|
Sep 2019 |
444,555 | 15,527 |
|
Oct 2019 |
445,627 | 15,527 |
|
Nov 2019 |
449,040 | 15,510 |
|
Dec 2019 |
449,643 | 15,550 |
|
Jan 2020 |
447,774 | 15,513 |
|
Feb 2020 |
447,972 | 15,519 |
|
Mar 2020 |
420,954 | 15,433 |
|
Apr 2020 |
370,296 | 13,247 |
|
May 2020 |
437,957 | 13,631 |
|
Jun 2020 |
465,800 | 14,452 |
|
Jul 2020 |
471,873 | 14,676 |
|
Aug 2020 |
473,696 | 14,943 |
|
Sep 2020 |
482,702 | 14,981 |
|
Oct 2020 |
480,763 | 15,090 |
|
Nov 2020 |
478,079 | 15,127 |
|
Dec 2020 |
485,949 | 15,144 |
|
Jan 2021 |
501,604 | 15,166 |
|
Feb 2021 |
488,805 | 15,189 |
|
Mar 2021 |
539,607 | 15,233 |
|
Apr 2021 |
542,199 | 15,189 |
|
May 2021 |
536,589 | 15,192 |
|
Jun 2021 |
540,152 | 15,245 |
|
Jul 2021 |
528,600 | 15,238 |
|
Aug 2021 |
532,477 | 15,216 |
|
Sep 2021 |
536,651 | 15,280 |
|
Oct 2021 |
545,361 | 15,348 |
|
Nov 2021 |
551,082 | 15,407 |
|
Dec 2021 |
547,277 | 15,422 |
|
Jan 2022 |
560,257 | 15,429 |
|
Feb 2022 |
563,777 | 15,537 |
|
Mar 2022 |
574,485 | 15,537 |
|
Apr 2022 |
580,943 | 15,488 |
|
May 2022 |
579,844 | 15,419 |
|
Jun 2022 |
585,556 | 15,465 |
|
Jul 2022 |
579,267 | 15,491 |
|
Aug 2022 |
581,196 | 15,522 |
|
Sep 2022 |
579,446 | 15,498 |
|
Oct 2022 |
585,006 | 15,512 |
|
Nov 2022 |
576,356 | 15,530 |
|
Dec 2022 |
569,119 | 15,534 |
|
Jan 2023 |
591,964 | 15,551 |
|
Feb 2023 |
586,165 | 15,603 |
|
Mar 2023 |
578,812 | 15,563 |
|
Apr 2023 |
583,874 | 15,556 |
|
May 2023 |
586,286 | 15,556 |
|
Jun 2023 |
588,670 | 15,533 |
|
Jul 2023 |
589,257 | 15,540 |
|
Aug 2023 |
595,191 | 15,531 |
|
Sep 2023 |
598,956 | 15,531 |
|
Oct 2023 |
595,517 | 15,544 |
|
Nov 2023 |
593,567 | 15,511 |
|
Dec 2023 |
594,256 | 15,551 |
|
Jan 2024 |
588,944 | 15,524 |
|
Feb 2024 |
593,206 | 15,529 |
|
Mar 2024 |
595,969 | 15,529 |
|
Apr 2024 |
595,676 | 15,531 |
|
May 2024 |
600,372 | 15,536 |
|
Jun 2024 |
599,979 | 15,500 |
|
Jul 2024 |
605,814 | 15,481 |
|
Aug 2024 |
603,601 | 15,458 |
|
Sep 2024 |
608,774 | 15,457 |
|
Oct 2024 |
612,772 | 15,452 |
|
Nov 2024 |
616,344 | 15,410 |
|
Dec 2024 |
621,713 | 15,460 |
|
Jan 2025 |
615,145 | 15,459 |
|
Feb 2025 |
616,636 | 15,442 |
|
Mar 2025 |
625,420 | 15,458 |
|
Apr 2025 |
624,272 | 15,462 |
|
May 2025 |
616,540 | 15,440 |
|
Jun 2025 |
620,791 | 15,426 |
|
Jul 2025 |
629,146 | 15,430 |
|
Aug 2025 |
630,770 | 15,440 |
|
Sep 2025 |
632,395 | 15,453 |
|
Oct 2025 |
631,346 | 15,438 |
|
Nov 2025 |
634,477 | 15,437 |
|
Dec 2025 |
634,830 | 15,414 |
|
Source: U.S. Census Bureau. |
||
As U.S. consumers shop less at brick-and-mortar stores and more online over time, e-commerce sales have continued to rise. Quarterly e-commerce sales and retail trade employment rose from the first quarter of 2016 to the first quarter of 2017—when retail trade employment peaked. Thereafter, employment trended downward through 2019, while e-commerce sales continued to gain shares of total retail sales. (See chart 6.) The diversion of the two series coincided with the period in which thousands of brick-and-mortar retailers closed some or almost all of their locations.
| Date | Quarterly e-commerce sales, in millions of dollars | Quarterly average retail trade employment, in thousands |
|---|---|---|
|
Q4 2015 |
86,662 | 15,625 |
|
Q1 2016 |
89,559 | 15,716 |
|
Q2 2016 |
92,432 | 15,777 |
|
Q3 2016 |
95,484 | 15,819 |
|
Q4 2016 |
98,389 | 15,812 |
|
Q1 2017 |
102,558 | 15,849 |
|
Q2 2017 |
106,406 | 15,789 |
|
Q3 2017 |
109,930 | 15,763 |
|
Q4 2017 |
115,160 | 15,757 |
|
Q1 2018 |
119,491 | 15,743 |
|
Q2 2018 |
123,042 | 15,766 |
|
Q3 2018 |
125,807 | 15,711 |
|
Q4 2018 |
129,353 | 15,654 |
|
Q1 2019 |
130,188 | 15,593 |
|
Q2 2019 |
135,548 | 15,553 |
|
Q3 2019 |
144,130 | 15,526 |
|
Q4 2019 |
150,245 | 15,529 |
|
Q1 2020 |
156,916 | 15,488 |
|
Q2 2020 |
208,112 | 13,777 |
|
Q3 2020 |
212,375 | 14,867 |
|
Q4 2020 |
217,160 | 15,120 |
|
Q1 2021 |
227,949 | 15,196 |
|
Q2 2021 |
236,010 | 15,209 |
|
Q3 2021 |
232,168 | 15,245 |
|
Q4 2021 |
239,825 | 15,392 |
|
Q1 2022 |
243,978 | 15,501 |
|
Q2 2022 |
247,967 | 15,457 |
|
Q3 2022 |
251,988 | 15,504 |
|
Q4 2022 |
252,656 | 15,525 |
|
Q1 2023 |
262,965 | 15,572 |
|
Q2 2023 |
269,738 | 15,548 |
|
Q3 2023 |
275,176 | 15,534 |
|
Q4 2023 |
276,781 | 15,535 |
|
Q1 2024 |
283,038 | 15,527 |
|
Q2 2024 |
288,822 | 15,522 |
|
Q3 2024 |
295,249 | 15,465 |
|
Q4 2024 |
300,329 | 15,441 |
|
Q1 2025 |
297,701 | 15,453 |
|
Q2 2025 |
303,284 | 15,442 |
|
Q3 2025 |
310,817 | 15,441 |
|
Q4 2025 |
317,999 | 15,430 |
|
Source: U.S. Census Bureau. |
||
In the second quarter of 2020, average employment for the retail trade industry declined by 11 percent, reflecting pandemic-related job losses, while quarterly e-commerce sales rose by 33 percent. In the second quarter of 2020, e-commerce sales as a share of total retail sales increased by 4 percentage points, well above the average quarterly gain of 0.3 percentage points from the fourth quarter of 2015 to the first quarter of 2020.
Over the following 2 years, retail trade employment trended upward and fully recovered to its prepandemic level of 15.5 million jobs in the first quarter of 2022. During this period, e-commerce sales continued to expand. From the first quarter of 2022 to the fourth quarter of 2025, retail trade employment remained relatively flat, while e-commerce sales increased by 30 percent.
Examining the changes in employment across the different retail trade industries from 2016 to 2025 reflects the continuously evolving retail paradigm. As retail sales shifted from traditional storefronts to e-commerce, employment grew in the medium-growth industries—gasoline station and fuel dealers and building material and garden equipment and supplies dealers. However, sluggish job growth and protracted employment declines occurred in the slow-growth and contracting industries, respectively.
Osman Alhassan and Kennedy Keller, "A decade of employment trends in retail trade, 2016–25," Monthly Labor Review, U.S. Bureau of Labor Statistics, November 2026, https://doi.org/10.21916/mlr.2026.32
1 "2022 NAICS definition” in “North American Industry Classification System,” U.S. Census Bureau, last revised October 20, 2026, https://www.census.gov/naics/?input=44&year=2022&details=44.
2 “Details on the conversion to the 2022 North American Industry Classification System (NAICS) from 2017 NAICS” in “State and metro area employment, hours, & earnings,” U.S. Bureau of Labor Statistics, last modified March 13, 2023, https://www.bls.gov/sae/additional-resources/details-on-the-conversion-to-the-2022-north-american-industry-classification-system-naics-from-2017-naics.htm and “The North American Industry Classification System in the Current Employment Statistics Program” in “Current Employment Statistics - CES (National),” U.S. Bureau of Labor Statistics, last modified September 19, 2023, https://www.bls.gov/ces/naics/naics-2022.htm.
3These industries are motor vehicle and parts dealers; building material and garden equipment and supplies dealers; food and beverage retailers; furniture, home furnishings, electronics, and appliance retailers; general merchandise retailers; health and personal care retailers; gasoline stations and fuel dealers; clothing, clothing accessories, shoe, and jewelry retailers; and sporting goods, hobby, musical instrument, book, and miscellaneous retailers. For more information about the NAICS 2022 update, see Shane Haley and Kennedy Keller, "The NAICS 2022 update and its effect on BLS employment estimates in the retail trade sector," Monthly Labor Review, (September 2023),https://doi.org/10.21916/mlr.2023.19.
4 David Dayen, “The cause and consequences of the retail apocalypse,” New Republic, November 14, 2017,https://newrepublic.com/article/145813/cause-consequences-retail-apocalypse.
5 Lauren Thomas and Christina Cheddar Berk, “These retailers are closing stores to slow coronavirus outbreak,” CNBC, March 15,2020,https://www.cnbc.com/2020/03/15/these-retailers-are-closing-stores-to-slow-coronavirus-outbreak.html.
6 Kermit Baker, “Despite devasting effects on the broader economy, pandemic has been a boon for U.S. home improvement,” Harvard University Joint Center for Housing Studies, March 25, 2021, https://www.jchs.harvard.edu/blog/despite-devastating-effects-broader-economy-pandemic-has-been-boon-us-home-improvement.
7 Paul A. Eisenstein, “For the auto industry, the pandemic changed everything,” NBC News, March 12, 2021,https://www.nbcnews.com/business/autos/auto-industry-pandemic-changed-everything-n1260926.
8 “Total Vehicle Sales (TOTALSA)” U.S. Bureau of Economic Analysis (retrieved from FRED, Federal Reserve Bank of St. Louis, updated October 2, 2026), https://fred.stlouisfed.org/series/TOTALSA.
9 “Business and industry: time series/trend charts,” U.S. Census Bureau, last revised August 6, 2019, https://www.census.gov/econ/currentdata/dbsearch?programCode=MARTS&startYear=2016&endYear=2025&categories[]=445&dataType=SM&geoLevel=US&adjusted=1¬Adjusted=0&errorData=0.
10 Nathaniel Meyersohn, “How Costco, Sam’s Club and BJ’s won the pandemic,” CNN Business, December 4, 2021, https://www.cnn.com/2021/12/04/business/costco-bjs-sams-club-warehouse-club#:~:text=Covid%20also%20pushed%20more%20people,Stocking%20up%20at%20Costco.&text=These%20moves%20have%20paid%20off,veteran%20members%2C%20CEO%20McLay%20said.
11 Cara Salpini, “A timeline of how the pandemic hit retail,” Retail Dive, January 11, 2021, https://www.retaildive.com/news/a-timeline-of-how-the-pandemic-hit-retail/592770/.
12 Hyunsoo Rim, “Home furnishings retailers struggle as fewer houses sell—from Williams-Sonoma to Wayfair to Home Depot,” Forbes, June 21, 2024, https://www.forbes.com/sites/hyunsoorim/2024/06/21/home-furnishing-retailers-struggle-as-fewer-houses-sell-from-williams-sonoma-to-wayfair-to-home-depot/.
13 Cindy Liu, “Apparel sales take a hit as consumers pull back spending on clothes,” Emarketer, June 1, 2020, https://www.emarketer.com/content/apparel-sales-take-a-hit-as-consumers-pull-back-spending-on-clothes-9.
14 “Table 448: Clothing and clothing access. Stores: U.S. total, seasonally adjusted sales, monthly [millions of dollars]” in “Business and industry: time series/trend charts,” U.S. Census Bureau, last revised August 6, 2019, https://www.census.gov/econ/currentdata/dbsearch?programCode=MARTS&startYear=2009&endYear=2022&categories%5b%5d=448&dataType=SM&geoLevel=US&adjusted=1¬Adjusted=0&errorData=0#table-results.
15 Laura Vogel, “How the beauty industry is coping in the area of COVID,” Yahoo! Finance, September 1, 2021, https://finance.yahoo.com/news/covid-makeup-beauty-plastic-surgery-zoom-effect-183608493.html.
16 Pearson correlation coefficient (r) measures the association between employment and retail sales. From December 2015 to January 2017, the correlation was r = 0.81, and from June 2020 to December 2025, the correlation was r = 0.79.
18 E-commerce data used in this article is from the U.S. Census Bureau. On a quarterly basis, the Quarterly E-Commerce Report is published. This report provides a single quarterly estimate measuring all retail e-commerce sales captured by the Monthly Retail Trade Survey (MRTS).” Introduction of the United States Census Bureau’s new supplemental quarterly e-commerce data product (U.S. Census Bureau), https://www.census.gov/retail/mrts/www/explanatory_material.pdf.