An official website of the United States government
An official website of the United States government
The .gov means it's official.
Federal government websites often end in .gov or .mil. Before sharing sensitive information,
make sure you're on a federal government site.
The site is secure.
The
https:// ensures that you are connecting to the official website and that any
information you provide is encrypted and transmitted securely.
Given the profound impact of the COVID-19 pandemic on mental health and labor market dynamics globally, this article seeks to understand how levels of self-reported depressive symptoms might be related to an individual’s employment status, work-related outcomes, and demographic and household characteristics from 2019 to 2022. Using a subsample of the National Longitudinal Survey of Youth 1997 (NLSY97), depressive symptoms are measured with the Center for Epidemiologic Studies Depression Scale (CES-D-7) across three survey rounds, including a supplemental round conducted during the COVID-19 pandemic. Most individuals did not report high depressive symptoms; however, the share that did increased during the supplemental round before declining in the subsequent round. Women and adults living with children under the age of 18 were more likely to report high depressive symptoms across all survey rounds. In contrast, individuals with a bachelor’s degree or higher experienced a more noticeable increase in high depressive symptoms during the supplemental round. Individuals reporting high depressive symptoms were also more likely to face adverse labor market outcomes, such as decreased earnings, reduced work hours, and higher rates of unemployment.
In February 2020, the U.S. employment–population ratio (the proportion of the civilian noninstitutional population that is employed) was 61.1 percent but declined sharply to 51.2 percent in April 2020 with the onset of the COVID-19 pandemic. This sharp decline reflects stay-at-home mandates and temporary closures of nonessential businesses across the nation. By March 2021, there was a gradual recovery in the employment–population ratio to 60.1 percent.
In 2019 and 2021, the National Longitudinal Survey of Youth 1997 (NLSY97) included seven items that measured depressive symptoms at the interview date among individuals ages 30 to 35 and 32 to 37, respectively. Together with measures of employment, household composition, education, and demographics collected in the NLSY97, these data enabled researchers to examine the relationship between depressive symptoms and other aspects of life.
While most respondents reported low depressive symptoms in both 2019 and 2021, a significant increase was observed at the time of the NLSY97 COVID-19 Supplement in early 2021. Individuals reporting high depressive symptoms experienced more adverse work-related outcomes and lower rates of employment.
The first section of this article discusses the survey subsample taken from the NLSY97 and describes the Center for Epidemiologic Studies Depression Scale (CES-D-7) used to measure depressive symptoms. The second section presents the prevalence of self-reported symptoms by various demographic, work, and household characteristics.
This section describes the data and variables used from the regularly occurring NLSY97 survey rounds and the supplemental COVID-19 survey.
The National Longitudinal Surveys are a set of surveys designed to gather information at multiple points in time on labor market activities and other significant life events of several groups of men and women. The NLSY97 consists of a nationally representative sample of 8,984 men and women born in the years 1980 through 1984 who were living in the United States at the time of the initial survey in 1997. They are being interviewed for the 22nd time in 2026, when they will be ages 42 to 46. This article incorporates data from three survey rounds of the NLSY97:
Round 19 interviews conducted between September 2019 and July 20201
A supplemental interview on topics related to the COVID-19 pandemic conducted between February and May 2021
Round 20 interviews conducted between September 2021 and October 2022
The analysis uses a subset of the NLSY97 overall sample, restricting it to those who were interviewed and reported scores on seven items from the CES-D-7 in all three survey rounds (round 19, the NLSY97 COVID-19 Supplement, and round 20), resulting in a sample size of 4,953 individuals. To adjust for the complex survey design and to ensure that the findings are representative of the NLSY97 cohort, all analyses for this study sample use the survey weights from the NLS custom weighting program.2 The subset examined in this study is comparable to the full NLSY97 sample interviewed in round 19. This analysis uses round 19 as the baseline for demographic characteristics, while the dependent variables draw on all three survey rounds to assess changes in depression scores over time. Women make up just over half of the subset, a slightly larger share than in the full NLSY97 sample. Non-Black, non-Hispanic respondents constitute almost three quarters of the subset, also slightly more than the full sample. Educational attainment as of round 19 is also comparable, with most respondents in the subset holding at least a high school diploma. (See table 1.)
| Demographic category | Full NLSY97 round 19 sample | Study subsample | ||
|---|---|---|---|---|
| Sample size | Weighted percent | Sample size | Weighted percent | |
Sex | ||||
Men | 3415 | 51.28 | 2279 | 49.43 |
Women | 3531 | 48.72 | 2674 | 50.57 |
Race/ethnicity | ||||
Hispanic or Latino | 1465 | 12.85 | 1008 | 12.34 |
Black, non-Hispanic | 1892 | 15.42 | 1220 | 13.21 |
Mixed Race, non-Hispanic | 62 | 1.25 | 44 | 1.20 |
Non-Black, non-Hispanic | 3527 | 70.48 | 2681 | 73.25 |
Education | ||||
None | 505 | 5.96 | 285 | 4.61 |
GED | 887 | 11.62 | 532 | 9.73 |
High school diploma only | 2747 | 38.05 | 1865 | 36.05 |
Some college or associate's degree | 632 | 9.36 | 498 | 10.12 |
Bachelor's degree or higher | 2150 | 35.01 | 1758 | 39.49 |
Note: The study subsample is restricted to respondents who reported CES-D-7 scores in all three survey rounds (round 19, the COVID Supplement, and round 20). GED refers to the General Educational Development credential, which certifies high school-level academic knowledge. Source: U.S. Bureau of Labor Statistics. | ||||
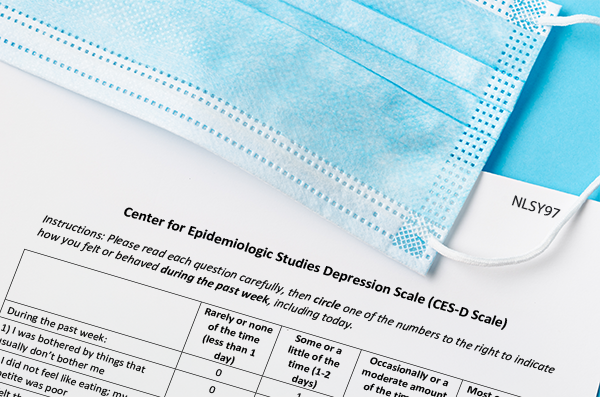
In this analysis,CES-D-7 scores are used to measure depressive symptoms at three points in time, allowing for an assessment of changes in scores across the three survey rounds. Each of the seven CES-D-7 items uses a frequency-based scale ranging from 0-3, where responses such as “rarely or none of the time” are coded as 0 and “most or all of the time” are coded as 3. Scores from the seven CES-D-7 items are then summed to produce a cumulative CES-D-7 score for each round ranging from 0 to 21. Higher scores indicate an experience of more depressive symptoms. These scores are then classified into two categories: “no or low depressive symptoms” for scores of less than 8 and “high depressive symptoms” for scores of 8 or higher. The threshold score of 8 or higher was chosen based on comparable analysis in previous research using the NLSY97 and CES-D-7.3
The seven individual items that make up the CES-D-7 are as follows:
“Poor appetite” assesses how often individuals experience a lack of appetite.
“Difficulty keeping mind focused” evaluates how frequently individuals struggle with concentration.
“Feeling depressed” measures the presence of depressive feelings.
“Feeling everything was an effort” indicates how often activities feel burdensome.
“Restless sleep” measures occurrences of disturbed sleep.
“Feeling sad” assesses the frequency of sadness.
“Could not get going” evaluates how often individuals feel unable to start activities.
For each item, respondents were asked how they felt or behaved during the past week. Response options for each item are rarely or none of the time (less than 1 day), some or a little of the time (1–2 days), occasionally or a moderate amount of the time (3–4 days), and most or all of the time (5–7 days.)
This section presents findings across demographic, work, and household characteristics.
Chart 1 shows the distribution of responses for each CES-D-7 item in the NLSY97 COVID-19 Supplement interview. For most symptoms, the majority of respondents indicated they experienced them rarely or none of the time. Poor appetite was the least common symptom, with 76.0 percent reporting it rarely or none of the time, 14.4 percent some or a little of the time, 7.3 percent occasionally, and 2.3 percent most or all of the time. Feeling depressed, sad, or could not get going were similarly uncommon with 54 to 55 percent reporting these symptoms rarely or none of the time.
However, a sizable share of respondents reported difficulties to some degree. Difficulty keeping the mind focused and feeling that everything was an effort were somewhat more prevalent. Of respondents, 30.5 percent reported difficulty keeping the mind focused some or a little of the time, 17.2 percent occasionally, and 8.2 percent most or all of the time. Feeling that everything was an effort was reported some or a little of the time by 29.5 percent, occasionally by 14.4 percent, and most or all of the time by 15.1 percent. Restless sleep was the most prevalent symptom, with only 33.7 percent reporting it rarely or none of the time and 16.1 percent most or all of the time.
| Category of difficulty | Most/all of the time | Occasionally | Some/a little of the time | Rarely/none of the time |
|---|---|---|---|---|
|
Poor appetite |
2.3 | 7.3 | 14.4 | 76.0 |
|
Difficulty keeping mind focused |
8.2 | 17.2 | 30.5 | 44.2 |
|
Feeling depressed |
6.9 | 12.9 | 24.8 | 55.4 |
|
Feeling everything was an effort |
15.1 | 14.4 | 29.5 | 41.1 |
|
Restless sleep |
16.1 | 18.4 | 31.8 | 33.7 |
|
Feeling sad |
5.9 | 12.5 | 27.2 | 54.4 |
|
Could not get going |
5.8 | 11.4 | 28.4 | 54.5 |
|
Source: U.S. Bureau of Labor Statistics. |
||||
The prevalence of high depressive symptoms was higher at the time of the NLSY97 COVID-19 Supplement period compared with round 19 and round 20. (See chart 2.) In round 19, 11.5 percent of individuals reported high depressive symptoms, while 88.5 percent reported no or low depressive symptoms. However, during the NLSY97 COVID-19 Supplement period, the prevalence of depressive symptoms more than doubled, increasing to 28.5 percent. In round 20, the prevalence of depressive symptoms decreased to 13.3 percent, less than 2 percentage points higher than round 19 levels.
| Survey round | High depressive symptoms | No or low depressive symptoms |
|---|---|---|
|
Round 19 |
11.5 | 88.5 |
|
NLSY97 COVID-19 Supplement |
28.5 | 71.5 |
|
Round 20 |
13.3 | 86.7 |
|
Source: U.S. Bureau of Labor Statistics. |
||
Women disproportionately reported high depressive symptoms in all survey rounds compared with men. Chart 3 shows that among those reporting high depressive symptoms, 61.5 percent were women and 38.5 percent were men in round 19. This pattern remained consistent, with a slight increase in the share of men (40.7 percent) reporting high depressive symptoms at the time of the NLSY97 COVID-19 Supplement. However, there was no increase in reported depressive symptoms for women in the COVID-19 Supplement; rather, women accounted for a smaller share of those reporting depressive symptoms than in round 19. By round 20, women made up an even larger share of those who reported high depressive symptoms compared with Round 19.
| Survey round | Men | Women |
|---|---|---|
|
Round 19 |
38.5 | 61.5 |
|
NLSY97 COVID-19 Supplement |
40.7 | 59.3 |
|
Round 20 |
34.5 | 65.5 |
|
Source: U.S. Bureau of Labor Statistics. |
||
Adults living with children under the age of 18 were more likely to report high depressive symptoms than those without children across all three survey rounds. (See chart 4.) The difference in the prevalence of high depressive symptoms between adults living with and without children under age 18 in the household was larger at the time of the NLSY97 COVID-19 Supplement. Among individuals experiencing depressive symptoms, 63.7 percent of individuals had children under age 18 and 36.3 percent did not. However, by round 20, the composition resembled what it was in round 19.
| Survey round | No children | Any children under age 18 |
|---|---|---|
|
Round 19 |
42.0 | 58.0 |
|
NLSY97 COVID-19 Supplement |
36.3 | 63.7 |
|
Round 20 |
41.7 | 58.3 |
|
Source: U.S. Bureau of Labor Statistics. |
||
In rounds 19 and 20, individuals with only a high school diploma made up the largest share of those reporting high depressive symptoms. For those rounds, college graduates represented a smaller share of individuals reporting high depressive symptoms than their share in the overall sample. (See chart 5.) In contrast, at the time of the NLSY97 COVID-19 Supplement, respondents with a bachelor’s degree or higher accounted for a larger share of those with high depressive symptoms (36.2 percent), similar to those with only a high school diploma (34.7 percent). By round 20, the share of those with a bachelor’s degree or higher reporting high depressive symptoms returned to a level comparable with round 19.
| Survey round | None | GED | High school diploma only | Some college or associate's degree | Bachelor's degree or higher |
|---|---|---|---|---|---|
|
Round 19 |
8.6 | 17.0 | 39.5 | 11.0 | 23.9 |
|
NLSY97 COVID-19 Supplement |
6.3 | 12.2 | 34.7 | 10.6 | 36.2 |
|
Round 20 |
7.8 | 13.5 | 40.2 | 12.0 | 26.6 |
|
Source: U.S. Bureau of Labor Statistics. |
|||||
Individuals with high depressive symptoms experienced more work-related changes during the pandemic compared with those who reported no or low depressive symptoms. Chart 6 shows a higher percentage of those with high depressive symptoms stopped working for their employer (30.4 percent) compared with individuals with no or low depressive symptoms (23.6 percent). Individuals with high depressive symptoms also experienced a larger reduction in work hours (35.0 percent) compared with individuals with no or low depressive symptoms (27.7 percent).
Conversely, there was a smaller difference between the two groups in the fraction experiencing increases in work hours (32.2 percent for high depressive symptoms and 29.0 percent for no or low depressive symptoms). Among those who experienced decreased earnings, these individuals had high depressive symptoms at a higher rate (37.7 percent) compared with those with no or low depressive symptoms (29.6 percent). Among those who experienced increased earnings, these individuals were slightly more likely to have no or low depressive symptoms (34.4 percent) than to have high depressive symptoms (31.7 percent).
| Work outcome or change | High depressive symptoms | No or low depressive symptoms |
|---|---|---|
|
Earnings increased |
31.7 | 34.4 |
|
Earnings decreased |
37.7 | 29.6 |
|
Work hours increased |
32.2 | 29.0 |
|
Work hours reduced |
35.0 | 27.7 |
|
Stopped working for employer |
30.4 | 23.6 |
|
Source: U.S. Bureau of Labor Statistics. |
||
Individuals with high depressive symptoms also consistently had lower rates of employment compared with those with no or low depressive symptoms at the time of the NLSY97 COVID-19 Supplement. (See chart 7.) In early 2020, there was a sharp decline in employment across all groups, but individuals reporting no or low depressive symptoms experienced a stronger and quicker recovery in the labor market compared with those that reported high depressive symptoms. Through 2021, individuals experiencing high depressive symptoms continued to show lower rates of employment compared with those with no or low depressive symptoms.
| Year | No or low depressive symptoms | Study subsample | High depressive symptoms |
|---|---|---|---|
|
2019 |
85.172 | 82.226 | 76.296 |
|
2019 |
85.056 | 82.207 | 76.247 |
|
2019 |
84.829 | 81.951 | 75.926 |
|
2019 |
84.894 | 82.004 | 76.331 |
|
2019 |
85.022 | 82.155 | 76.738 |
|
2019 |
84.916 | 81.995 | 76.764 |
|
2019 |
84.997 | 82.111 | 76.694 |
|
2019 |
85.000 | 82.200 | 76.987 |
|
2019 |
85.317 | 82.393 | 77.182 |
|
2019 |
85.111 | 81.993 | 76.830 |
|
2019 |
85.179 | 82.119 | 76.944 |
|
2019 |
85.135 | 81.823 | 76.860 |
|
2019 |
85.117 | 81.965 | 77.032 |
|
2019 |
85.481 | 82.383 | 77.320 |
|
2019 |
85.466 | 82.477 | 77.509 |
|
2019 |
85.562 | 82.470 | 77.534 |
|
2019 |
85.539 | 82.381 | 77.331 |
|
2019 |
85.604 | 82.638 | 77.789 |
|
2019 |
85.433 | 82.371 | 77.123 |
|
2019 |
85.370 | 82.158 | 76.960 |
|
2019 |
85.484 | 82.251 | 77.046 |
|
2019 |
85.438 | 82.160 | 77.336 |
|
2019 |
85.239 | 82.156 | 77.064 |
|
2019 |
85.037 | 81.894 | 76.884 |
|
2019 |
85.272 | 81.958 | 76.729 |
|
2019 |
85.245 | 81.869 | 76.739 |
|
2019 |
85.262 | 81.854 | 76.691 |
|
2019 |
85.288 | 81.943 | 76.484 |
|
2019 |
85.453 | 82.008 | 76.605 |
|
2019 |
85.306 | 81.923 | 76.581 |
|
2019 |
85.776 | 82.665 | 77.422 |
|
2019 |
85.852 | 82.467 | 76.932 |
|
2019 |
86.132 | 82.803 | 77.163 |
|
2019 |
86.042 | 82.495 | 76.751 |
|
2019 |
86.447 | 83.070 | 76.927 |
|
2019 |
86.626 | 83.289 | 77.082 |
|
2019 |
86.762 | 83.451 | 76.803 |
|
2019 |
86.837 | 83.612 | 76.877 |
|
2019 |
87.028 | 83.715 | 76.895 |
|
2019 |
87.056 | 83.867 | 76.931 |
|
2019 |
86.919 | 83.803 | 77.272 |
|
2019 |
87.349 | 84.149 | 77.928 |
|
2019 |
87.441 | 83.836 | 77.224 |
|
2019 |
87.540 | 84.161 | 77.859 |
|
2019 |
87.186 | 83.815 | 77.531 |
|
2019 |
87.151 | 83.923 | 77.638 |
|
2019 |
86.967 | 83.889 | 77.883 |
|
2019 |
86.768 | 83.544 | 77.779 |
|
2019 |
86.775 | 83.578 | 77.583 |
|
2019 |
86.716 | 83.616 | 77.573 |
|
2019 |
86.910 | 83.708 | 77.354 |
|
2020 |
86.309 | 83.342 | 77.074 |
|
2020 |
86.472 | 83.567 | 77.699 |
|
2020 |
86.512 | 83.567 | 77.722 |
|
2020 |
86.386 | 83.574 | 77.927 |
|
2020 |
86.100 | 83.298 | 77.779 |
|
2020 |
86.379 | 83.424 | 77.946 |
|
2020 |
86.160 | 83.198 | 77.722 |
|
2020 |
86.273 | 83.215 | 77.805 |
|
2020 |
86.507 | 83.433 | 77.766 |
|
2020 |
86.510 | 83.240 | 77.387 |
|
2020 |
86.396 | 83.326 | 77.561 |
|
2020 |
85.778 | 82.601 | 76.706 |
|
2020 |
85.155 | 81.927 | 75.411 |
|
2020 |
83.092 | 80.022 | 73.857 |
|
2020 |
82.823 | 79.388 | 73.112 |
|
2020 |
82.087 | 78.208 | 72.187 |
|
2020 |
81.813 | 77.966 | 72.027 |
|
2020 |
81.589 | 77.799 | 71.988 |
|
2020 |
81.988 | 78.220 | 72.142 |
|
2020 |
81.846 | 78.174 | 71.900 |
|
2020 |
82.216 | 78.352 | 72.113 |
|
2020 |
82.229 | 78.280 | 71.588 |
|
2020 |
82.312 | 78.252 | 71.419 |
|
2020 |
82.543 | 78.420 | 71.468 |
|
2020 |
82.332 | 78.126 | 71.475 |
|
2020 |
82.524 | 78.470 | 71.768 |
|
2020 |
82.354 | 78.287 | 71.823 |
|
2020 |
83.240 | 78.954 | 72.244 |
|
2020 |
83.167 | 78.806 | 71.220 |
|
2020 |
83.182 | 78.813 | 71.321 |
|
2020 |
83.204 | 78.938 | 71.296 |
|
2020 |
83.719 | 79.441 | 71.610 |
|
2020 |
83.724 | 79.351 | 71.731 |
|
2020 |
83.818 | 79.757 | 72.284 |
|
2020 |
83.919 | 79.816 | 72.277 |
|
2020 |
84.003 | 79.977 | 72.372 |
|
2020 |
84.622 | 80.272 | 72.387 |
|
2020 |
84.434 | 80.369 | 72.566 |
|
2020 |
84.752 | 80.635 | 72.716 |
|
2020 |
84.764 | 80.693 | 72.454 |
|
2020 |
84.880 | 80.757 | 72.799 |
|
2020 |
84.797 | 80.808 | 72.438 |
|
2020 |
85.021 | 81.060 | 72.771 |
|
2020 |
84.968 | 80.919 | 72.593 |
|
2020 |
84.775 | 80.866 | 72.847 |
|
2020 |
84.897 | 81.168 | 73.406 |
|
2020 |
84.841 | 81.101 | 73.592 |
|
2020 |
85.026 | 81.325 | 73.710 |
|
2020 |
84.651 | 81.086 | 73.296 |
|
2020 |
84.776 | 81.165 | 73.339 |
|
2020 |
84.709 | 81.004 | 73.269 |
|
2020 |
84.558 | 81.046 | 73.405 |
|
2021 |
84.452 | 80.574 | 72.900 |
|
2021 |
84.686 | 80.757 | 73.020 |
|
2021 |
84.805 | 80.651 | 72.898 |
|
2021 |
84.990 | 80.838 | 72.990 |
|
2021 |
85.163 | 80.939 | 72.990 |
|
2021 |
85.099 | 80.798 | 73.048 |
|
2021 |
85.147 | 80.970 | 73.307 |
|
2021 |
85.047 | 80.820 | 73.077 |
|
2021 |
85.018 | 80.685 | 72.807 |
|
2021 |
84.824 | 80.423 | 72.424 |
|
2021 |
85.449 | 80.793 | 72.766 |
|
2021 |
85.326 | 80.525 | 72.292 |
|
2021 |
85.250 | 80.738 | 72.781 |
|
2021 |
85.144 | 80.650 | 72.702 |
|
2021 |
85.301 | 80.890 | 72.903 |
|
2021 |
85.161 | 80.659 | 72.717 |
|
2021 |
85.090 | 80.642 | 73.085 |
|
2021 |
85.171 | 80.592 | 72.564 |
|
2021 |
85.264 | 80.878 | 72.779 |
|
2021 |
85.130 | 80.732 | 72.464 |
|
2021 |
85.310 | 80.906 | 72.495 |
|
2021 |
85.320 | 80.900 | 72.913 |
|
2021 |
85.426 | 80.825 | 72.954 |
|
2021 |
85.490 | 81.025 | 73.311 |
|
2021 |
85.263 | 80.669 | 72.517 |
|
2021 |
85.311 | 80.826 | 72.691 |
|
2021 |
85.047 | 80.319 | 72.531 |
|
2021 |
85.160 | 80.333 | 72.141 |
|
2021 |
85.060 | 80.273 | 71.972 |
|
2021 |
85.427 | 80.518 | 72.507 |
|
2021 |
85.425 | 80.530 | 72.549 |
|
2021 |
85.611 | 80.626 | 72.659 |
|
2021 |
85.623 | 80.769 | 72.760 |
|
2021 |
85.568 | 80.769 | 73.168 |
|
2021 |
85.645 | 80.764 | 73.291 |
|
2021 |
85.637 | 80.666 | 73.026 |
|
2021 |
85.813 | 81.122 | 73.332 |
|
2021 |
85.683 | 81.037 | 72.985 |
|
Note: Data are derived from the NLSY97 weekly employment status variables. Source: U.S. Bureau of Labor Statistics. |
|||
Additionally, those who reported high depressive symptoms consistently had higher rates of unemployment than those with no or low depressive symptoms. (See chart 8.) In early 2020, both groups experienced a sudden increase in the proportion unemployed, but individuals with no or low depressive symptoms experienced a quicker decline in the proportion unemployed as the labor market recovered. Individuals who reported high depressive symptoms not only saw a sharper initial spike in unemployment but also remained unemployed for longer periods and at much higher rates throughout 2020 into 2021. At the start of 2019, the proportion unemployed for those reporting high depressive symptoms was 4.6 percent (3.2 percent for those with no or low depressive symptoms). By late 2020, the rate rose to 8.0 percent (4.0 percent for those who reported no or low depressive symptoms) but gradually declined to 4.7 percent by the end of 2021 (2.7 percent for those reporting no or low depressive symptoms).
| Year | No or low depressive symptoms | Study subsample | High depressive symptoms |
|---|---|---|---|
|
2019 |
3.189 | 3.241 | 4.626 |
|
2019 |
3.282 | 3.452 | 4.773 |
|
2019 |
3.356 | 3.495 | 4.745 |
|
2019 |
3.433 | 3.551 | 4.871 |
|
2019 |
3.418 | 3.673 | 4.788 |
|
2019 |
3.452 | 3.670 | 4.899 |
|
2019 |
3.367 | 3.585 | 4.757 |
|
2019 |
3.462 | 3.732 | 4.661 |
|
2019 |
3.337 | 3.749 | 4.797 |
|
2019 |
3.453 | 3.933 | 4.862 |
|
2019 |
3.443 | 3.866 | 4.603 |
|
2019 |
3.357 | 3.804 | 4.537 |
|
2019 |
3.241 | 3.697 | 4.380 |
|
2019 |
3.236 | 3.660 | 4.098 |
|
2019 |
3.247 | 3.751 | 4.281 |
|
2019 |
3.213 | 3.796 | 4.494 |
|
2019 |
3.303 | 3.927 | 4.501 |
|
2019 |
3.123 | 3.661 | 4.384 |
|
2019 |
3.157 | 3.753 | 4.490 |
|
2019 |
3.079 | 3.682 | 4.616 |
|
2019 |
3.050 | 3.532 | 4.370 |
|
2019 |
2.903 | 3.515 | 4.160 |
|
2019 |
2.878 | 3.457 | 4.422 |
|
2019 |
2.731 | 3.386 | 4.260 |
|
2019 |
2.719 | 3.320 | 4.290 |
|
2019 |
2.630 | 3.232 | 4.093 |
|
2019 |
2.689 | 3.165 | 4.047 |
|
2019 |
2.526 | 3.124 | 4.251 |
|
2019 |
2.549 | 2.976 | 4.037 |
|
2019 |
2.518 | 2.923 | 4.055 |
|
2019 |
2.328 | 2.821 | 3.955 |
|
2019 |
2.209 | 2.632 | 3.548 |
|
2019 |
2.149 | 2.733 | 3.546 |
|
2019 |
2.374 | 2.817 | 3.505 |
|
2019 |
2.283 | 2.578 | 3.448 |
|
2019 |
2.314 | 2.545 | 3.304 |
|
2019 |
2.199 | 2.416 | 3.231 |
|
2019 |
2.073 | 2.386 | 3.271 |
|
2019 |
1.961 | 2.188 | 2.954 |
|
2019 |
2.023 | 2.306 | 2.884 |
|
2019 |
2.040 | 2.428 | 2.891 |
|
2019 |
1.830 | 2.217 | 2.654 |
|
2019 |
1.995 | 2.456 | 3.412 |
|
2019 |
1.985 | 2.590 | 3.635 |
|
2019 |
2.119 | 2.847 | 3.956 |
|
2019 |
2.275 | 2.920 | 4.114 |
|
2019 |
2.360 | 3.027 | 4.029 |
|
2019 |
2.414 | 3.168 | 4.366 |
|
2019 |
2.273 | 3.028 | 4.467 |
|
2019 |
2.496 | 3.177 | 4.542 |
|
2019 |
2.486 | 3.152 | 4.436 |
|
2020 |
2.618 | 3.307 | 4.612 |
|
2020 |
2.642 | 3.187 | 4.212 |
|
2020 |
2.662 | 2.981 | 3.944 |
|
2020 |
2.767 | 2.899 | 3.799 |
|
2020 |
2.809 | 2.972 | 3.739 |
|
2020 |
2.710 | 2.927 | 3.715 |
|
2020 |
2.801 | 3.141 | 3.742 |
|
2020 |
2.718 | 3.010 | 3.831 |
|
2020 |
2.583 | 2.983 | 3.817 |
|
2020 |
2.590 | 2.885 | 3.643 |
|
2020 |
2.752 | 2.868 | 3.733 |
|
2020 |
2.974 | 3.292 | 4.265 |
|
2020 |
3.232 | 3.583 | 4.797 |
|
2020 |
3.786 | 4.027 | 5.173 |
|
2020 |
3.977 | 4.378 | 5.362 |
|
2020 |
4.346 | 5.006 | 5.945 |
|
2020 |
4.659 | 5.174 | 5.963 |
|
2020 |
4.645 | 5.272 | 5.833 |
|
2020 |
4.723 | 5.343 | 5.603 |
|
2020 |
4.916 | 5.372 | 5.723 |
|
2020 |
4.919 | 5.535 | 5.707 |
|
2020 |
4.747 | 5.505 | 5.943 |
|
2020 |
4.642 | 5.501 | 6.417 |
|
2020 |
4.467 | 5.488 | 6.037 |
|
2020 |
4.427 | 5.444 | 6.229 |
|
2020 |
4.374 | 5.251 | 6.457 |
|
2020 |
4.523 | 5.453 | 6.651 |
|
2020 |
4.301 | 5.257 | 6.713 |
|
2020 |
4.390 | 5.372 | 6.995 |
|
2020 |
4.347 | 5.456 | 7.256 |
|
2020 |
4.310 | 5.403 | 7.267 |
|
2020 |
4.198 | 5.333 | 7.286 |
|
2020 |
4.171 | 5.330 | 7.053 |
|
2020 |
4.329 | 5.355 | 7.176 |
|
2020 |
4.290 | 5.300 | 7.114 |
|
2020 |
4.293 | 5.305 | 7.170 |
|
2020 |
4.103 | 5.144 | 7.219 |
|
2020 |
4.086 | 4.940 | 7.131 |
|
2020 |
3.862 | 4.707 | 7.059 |
|
2020 |
3.941 | 4.823 | 7.376 |
|
2020 |
3.943 | 4.951 | 7.300 |
|
2020 |
3.949 | 5.010 | 7.731 |
|
2020 |
3.888 | 5.035 | 7.717 |
|
2020 |
3.899 | 5.052 | 7.809 |
|
2020 |
4.018 | 5.154 | 7.953 |
|
2020 |
4.038 | 5.208 | 7.524 |
|
2020 |
4.092 | 5.115 | 7.308 |
|
2020 |
3.941 | 4.892 | 7.082 |
|
2020 |
4.133 | 4.904 | 6.841 |
|
2020 |
3.995 | 4.772 | 6.899 |
|
2020 |
4.103 | 4.827 | 6.949 |
|
2020 |
4.200 | 4.892 | 6.828 |
|
2021 |
4.175 | 4.905 | 6.694 |
|
2021 |
4.137 | 4.986 | 6.929 |
|
2021 |
4.063 | 5.069 | 7.080 |
|
2021 |
3.838 | 5.003 | 7.192 |
|
2021 |
3.774 | 4.879 | 7.049 |
|
2021 |
3.720 | 4.827 | 6.838 |
|
2021 |
3.671 | 4.708 | 6.449 |
|
2021 |
3.775 | 4.801 | 6.343 |
|
2021 |
3.752 | 4.753 | 6.291 |
|
2021 |
3.665 | 4.530 | 5.933 |
|
2021 |
3.532 | 4.504 | 5.918 |
|
2021 |
3.509 | 4.481 | 5.908 |
|
2021 |
3.479 | 4.459 | 5.920 |
|
2021 |
3.497 | 4.439 | 5.981 |
|
2021 |
3.463 | 4.430 | 5.757 |
|
2021 |
3.413 | 4.409 | 5.778 |
|
2021 |
3.579 | 4.485 | 5.691 |
|
2021 |
3.423 | 4.387 | 5.725 |
|
2021 |
3.330 | 4.305 | 5.639 |
|
2021 |
3.261 | 4.370 | 5.679 |
|
2021 |
3.169 | 4.222 | 5.555 |
|
2021 |
3.143 | 4.177 | 5.373 |
|
2021 |
2.945 | 3.944 | 5.161 |
|
2021 |
2.907 | 3.989 | 5.333 |
|
2021 |
2.942 | 4.141 | 5.864 |
|
2021 |
2.871 | 4.016 | 5.777 |
|
2021 |
2.859 | 4.002 | 5.698 |
|
2021 |
2.724 | 3.878 | 5.644 |
|
2021 |
2.687 | 3.811 | 5.555 |
|
2021 |
2.764 | 3.642 | 5.096 |
|
2021 |
2.697 | 3.620 | 5.182 |
|
2021 |
2.680 | 3.637 | 5.415 |
|
2021 |
2.437 | 3.573 | 5.428 |
|
2021 |
2.634 | 3.678 | 5.257 |
|
2021 |
2.621 | 3.679 | 5.410 |
|
2021 |
2.652 | 3.689 | 5.365 |
|
2021 |
2.702 | 3.643 | 4.955 |
|
2021 |
2.681 | 3.472 | 4.703 |
|
Note: Data are derived from the NLSY97 weekly employment status variables. Source: U.S. Bureau of Labor Statistics. |
|||
This article highlighted the prevalence of individuals reporting high depressive symptoms among demographic groups and labor market statuses from 2019 to 2022. Although most individuals did not report high depressive symptoms, there was a notable increase at the time of the NLSY97 COVID-19 Supplement. Women accounted for the majority of individuals reporting high depressive symptoms across all three survey rounds, a pattern that remained relatively consistent rather than reflecting a distinct change at the time of the COVID-19 Supplement. Individuals with a bachelor’s degree or higher accounted for a larger share of those reporting high depressive symptoms at the time of the COVID-19 Supplement compared with round 19, though later returning to prior levels by round 20. Those living with children under the age of 18 were also more likely to report high depressive symptoms. Notably, individuals reporting high depressive symptoms faced more negative work-related outcomes, including lower rates of employment and slower recovery from unemployment, compared with those reporting no or low depressive symptoms.
Safia Abdirizak, "The impact of COVID-19 on mental health and labor market outcomes using the National Longitudinal Survey of Youth 1997 (NLSY97)," Monthly Labor Review, U.S. Bureau of Labor Statistics, May 2026, https://doi.org/10.21916/mlr.2026.13
1 A subset of round 19 interviews occurred after March 2020. The inclusion of a dummy variable for whether a round 19 interview was conducted in March 2020 or later did not change their regression results, suggesting that the inclusion of round 19 interviews conducted during the COVID-19 pandemic likely do not significantly alter the findings of the current study. See Alison Aughinbaugh, Jeffrey A. Groen, Mark A. Loewenstein, Donna S. Rothstein, and Hugette Sun, "Employment, telework, and child remote schooling from February to May 2021: evidence from the National Longitudinal Survey of Youth 1997," Monthly Labor Review, U.S. Bureau of Labor Statistics, March 2023, https://doi.org/10.21916/mlr.2023.5.
2 “NLS Custom Weights,” National Longitudinal Surveys, U.S. Bureau of Labor Statistics, accessed December 5, 2025,https://www.nlsinfo.org/weights/nlsy97.
3 Colin B. Hawkinson, Sarah B. Andrea, Anjum Hajat, Anita Minh, Shanise Owens, Kieran Blaikie, Jessie Seiler, Andrea Molino, and Vanessa M. Oddo, “A cross-sectional analysis of work schedule notice and depressive symptoms in the United States,”SSM–Population Health, 22, (2023): 101413,https://doi.org/10.1016/j.ssmph.2023.101413; Stephen Levine, “Evaluating the seven-item Center for Epidemiologic Studies depression scale short-form: a longitudinal U.S. community study,”Social psychiatry and psychiatric epidemiology, 48, no. 9 (2013): doi: 10.1007/s00127-012-0650-2,https://pubmed.ncbi.nlm.nih.gov/23299927/.