An official website of the United States government
 United States Department of Labor
From 1980 to 1992, average consumer expenditures on food at home rose little once adjusted for inflation. Weekly food-at-home spending increased 50 percent, from $33.22 per week to $49.99 per week; the Consumer Price Index (CPI) for food at home rose 48 percent over the same period. The share of expenditures for various food items did change however, in part reflecting cultural trends.

[Chart data—TXT]
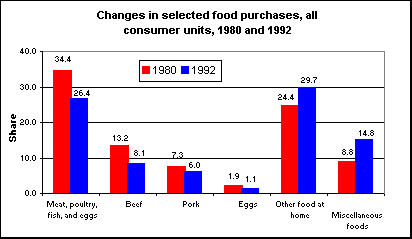
Meat, poultry, fish, and eggs accounted for 34.4 percent of total expenditures on food at home in 1980, but their expenditure share dropped to 26.4 percent in 1992. This decrease — largely driven by beef, pork, and eggs — occurred even though prices in the meat category did not rise as fast as for all food at home. The change may be due in part to changing consumer tastes and attitudes toward meat and egg consumption.
The share of expenditures going to "other food at home" increased from 24.4 percent in 1980 to 29.7 percent in 1992. When price changes are accounted for, this share increase is the largest of any major food category. The most notable change was in miscellaneous foods, up from 8.8 to 14.8 percent of expenditures. Miscellaneous foods include frozen meals, which proliferated and became more popular in the 1980s.
These data are a product of the BLS Consumer Expenditure Survey. Additional information is available from "The Changing Food-at-home Budget: 1980 and 1992 compared", Monthly Labor Review, December 1998. CPI data in this article are based on the All Urban Consumers, U.S. City Average, 1982-84=100 series.
Bureau of Labor Statistics, U.S. Department of Labor, The Economics Daily, Expenditures on frozen foods, meat change considerably over 12-year period at https://www.bls.gov/opub/ted/1999/feb/wk4/art05.htm (visited February 20, 2026).

