An official website of the United States government
 United States Department of Labor
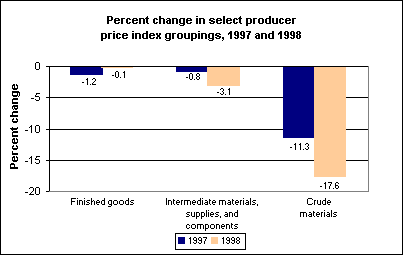
The producer price index (PPI) for finished goods decreased 0.1 percent from December 1997 to December 1998, after falling 1.2 percent in 1997. Prices for finished energy goods fell 12.1 percent and prices for finished consumer foods fell 0.1 percent. The "core" PPI—finished goods less food and energy—rose by 2.4 percent, with much of the increase attributable to rising cigarette prices.

[Chart data—TXT]
The PPI for intermediate materials, supplies, and components fell 3.1 percent in 1998, after declining by 0.8 percent in 1997. Prices for intermediate energy goods fell 11.9 percent during the year, while the index for intermediate foods and feeds decreased by 7.5 percent. Prices for intermediate materials less foods and energy dropped 1.5 percent in 1998.
The PPI for crude materials declined 17.6 percent in 1998, after falling 11.3 percent in 1997. Crude energy prices dropped 26.5 percent, while prices for crude foodstuffs and feedstuffs were down 10.8 percent. The index for crude nonfood materials less energy declined 16.0 percent in 1998.
These data are produced by the BLS Producer Price Index program. More information can be obtained in news release USDL 99-10, Producer Price Indexes, December 1998. Annual comparisons are based on changes in indexes from December 1997 to December 1998. Data for December 1998 are preliminary and are subject to revision four months following release. For updated information, see a subsequent edition of The Editor's Desk, "No change in producer prices in 1998" (08/19/1999).
Bureau of Labor Statistics, U.S. Department of Labor, The Economics Daily, Producer prices edged down 0.1 percent in 1998 at https://www.bls.gov/opub/ted/1999/jan/wk2/art04.htm (visited February 20, 2026).

