An official website of the United States government
 United States Department of Labor
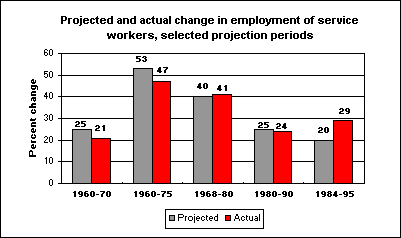
Since the 1960s, BLS projections of service employment usually have been accurate. In each of the periods shown in the chart, actual growth in employment of service workers was within 10 percentage points of projected growth.

[Chart data—TXT]
In two of the periods, 1968-80 and 1980-90, actual and projected growth were almost identical. The growth rates were also fairly close in the two periods beginning in 1960. The largest difference was in the 1984-95 period. Employment of service workers was projected to grow by 20 percent, when in fact it increased by 29 percent.
Data on projections are produced by the BLS Employment Projections program. Service occupations include workers in private households and in the fields of cleaning and building service, food preparation and service, health service (such as dental assistants and nursing home aides), personal service, and protective service. Find more information on the accuracy of employment projections in "The quality of BLS projections: a historical account," Monthly Labor Review, May 1999.
Bureau of Labor Statistics, U.S. Department of Labor, The Economics Daily, Projections of service worker employment generally on target at https://www.bls.gov/opub/ted/1999/jun/wk3/art05.htm (visited January 16, 2026).

