An official website of the United States government
An official website of the United States government
The .gov means it's official.
Federal government websites often end in .gov or .mil. Before sharing sensitive information,
make sure you're on a federal government site.
The site is secure.
The
https:// ensures that you are connecting to the official website and that any
information you provide is encrypted and transmitted securely.
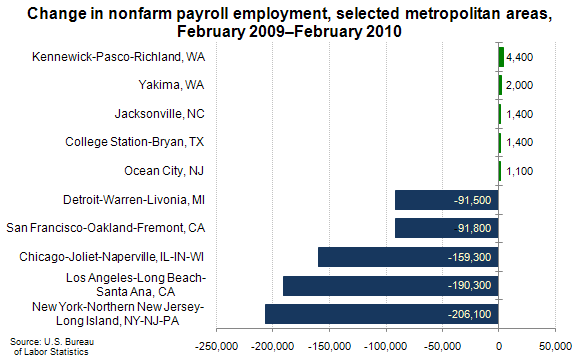
The largest February 2009–February 2010 over-the-year employment decrease was recorded in New York-Northern New Jersey-Long Island, New York-New Jersey-Pennsylvania (−206,100), followed by Los Angeles-Long Beach-Santa Ana, California (−190,300), Chicago-Joliet-Naperville, Illinois-Indiana-Wisconsin (−159,300), San Francisco-Oakland-Fremont, California (−91,800), and Detroit-Warren-Livonia, Michigan (−91,500).
The largest over-the-year increases in employment occurred in Kennewick-Pasco-Richland, Washington (+4,400), Yakima, Washington (+2,000), College Station-Bryan, Texas, and Jacksonville, North Carolina (+1,400 each), and Ocean City, New Jersey (+1,100).
Among the 371 metropolitan areas for which nonfarm payroll data were available, 343 areas reported over-the-year decreases in employment, 26 reported increases, and 2 had no change.
These data are from the BLS Current Employment Statistics (State and Metro Area) program. See "Metropolitan Area Employment and Unemployment — February 2010" (HTML) (PDF), news release USDL-10-0425, to learn more.
Bureau of Labor Statistics, U.S. Department of Labor, The Economics Daily, Metropolitan area over-the-year employment changes, February 2010 at https://www.bls.gov/opub/ted/2010/ted_20100412.htm (visited July 31, 2026).