An official website of the United States government
An official website of the United States government
The .gov means it's official.
Federal government websites often end in .gov or .mil. Before sharing sensitive information,
make sure you're on a federal government site.
The site is secure.
The
https:// ensures that you are connecting to the official website and that any
information you provide is encrypted and transmitted securely.
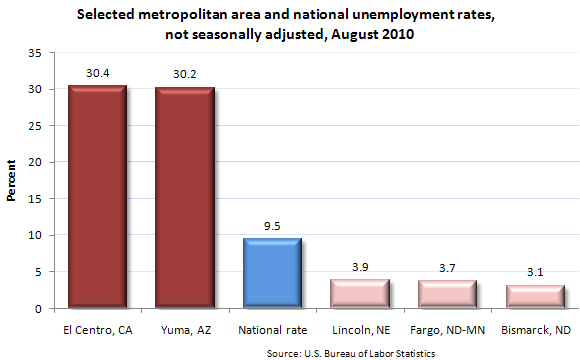
The national unemployment rate in August was 9.5 percent, not seasonally adjusted, compared with 9.6 percent a year earlier; 124 metropolitan areas reported jobless rates of at least 10.0 percent, down from 132 areas a year earlier, while 62 areas posted rates below 7.0 percent, down from 68 areas in August 2009.
El Centro, California, and Yuma, Arizona, again recorded the highest unemployment rates, 30.4 and 30.2 percent, respectively. These two adjacent areas are highly agricultural and experience extreme heat during summer months. Among the 12 areas with jobless rates of at least 15.0 percent, 9 were located in California.
Bismarck, North Dakota, again registered the lowest unemployment rate in August, 3.1 percent, followed by Fargo, North Dakota-Minnesota, 3.7 percent, and Lincoln, Nebraska, 3.9 percent. Of the nine areas with jobless rates under 5.0 percent, seven were located in the West North Central division (Iowa, Kansas, Minnesota, Missouri, Nebraska, North Dakota, and South Dakota).
Overall, 231 areas recorded unemployment rates below the U.S. figure of 9.5 percent, 139 areas reported rates above it, and 2 areas had rates equal to that of the nation.
These metropolitan area data are not seasonally adjusted and are from the Local Area Unemployment Statistics program. August 2010 metropolitan area unemployment rates are preliminary and subject to revision. Find out more in "Metropolitan Area Employment and Unemployment — August 2010" (HTML) (PDF), news release USDL-10-1352.
Bureau of Labor Statistics, U.S. Department of Labor, The Economics Daily, Metropolitan area unemployment in August 2010 at https://www.bls.gov/opub/ted/2010/ted_20101005.htm (visited July 14, 2026).