An official website of the United States government
 United States Department of Labor

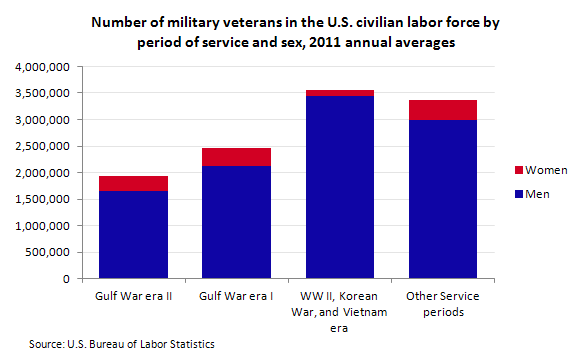
| Period of service | Men | Women |
|---|---|---|
Gulf War era II | 1,656,000 | 281,000 |
Gulf War era I | 2,121,000 | 339,000 |
WW II, Korean War, and Vietnam era | 3,441,000 | 108,000 |
Other Service periods | 2,986,000 | 388,000 |
In 2011, about 2.4 million of the nation's veterans had served during Gulf War era II (defined as veterans who served anywhere in the world at any time since September 2001). About 17 percent of these veterans were women, compared with 3 percent of veterans from World War II, the Korean War, and the Vietnam era. About half of all Gulf War-era II veterans were between the ages of 25 and 34.
Veterans are more likely to be men and older than nonveterans. In part, this reflects the characteristics of veterans who served during World War II, the Korean War, and the Vietnam era. Veterans who served during these wartime periods account for about one-half (10.4 million) of the total veteran population.

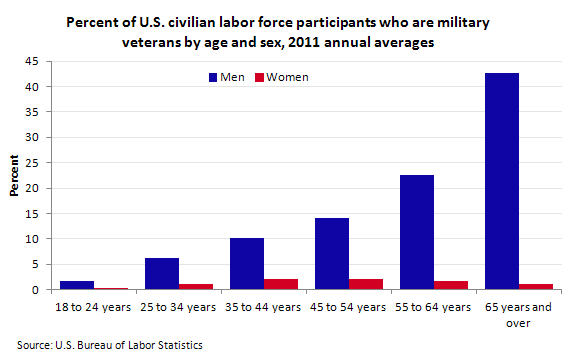
| Age | Men | Women |
|---|---|---|
18 to 24 years | 1.8 | 0.4 |
25 to 34 years | 6.2 | 1.2 |
35 to 44 years | 10.1 | 2.0 |
45 to 54 years | 14.2 | 2.2 |
55 to 64 years | 22.6 | 1.7 |
65 years and over | 42.6 | 1.2 |
Of the male labor force participants age 65 and over, 42.6 percent were veterans in 2011. At ages 55 to 64, the rate was 22.6 percent.

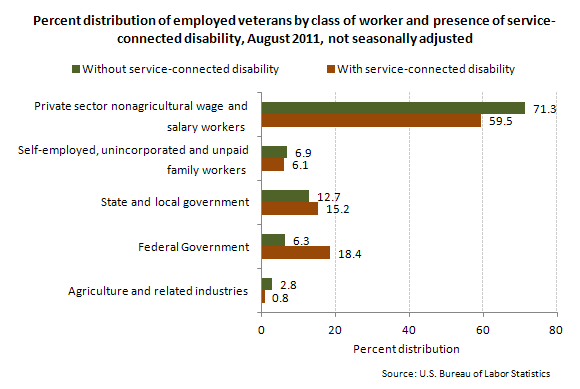
| Presence of service-connected disability | Class of worker | ||||
|---|---|---|---|---|---|
| Agriculture and related industries | Federal Government | State and local government | Self-employed, unincorporated and unpaid family workers | Private sector nonagricultural wage and salary workers | |
Without service-connected disability | 2.8 | 6.3 | 12.7 | 6.9 | 71.3 |
With service-connected disability | 0.8 | 18.4 | 15.2 | 6.1 | 59.5 |
In August 2011, about 3.0 million veterans, or 14 percent of the total, reported having a service-connected disability. (Some veterans did not report whether they had a service-connected disability.)
Regardless of period of service, many veterans with a service-connected disability worked in the public sector. In August 2011, 34 percent of employed veterans with a disability worked in federal, state, or local government, compared with 19 percent of veterans with no disability and 14 percent of nonveterans. About 18 percent of employed veterans with a disability worked for the federal government, compared with 6 percent of veterans with no disability and 2 percent of nonveterans.
These data are from the Current Population Survey, a monthly survey of households that provides information on employment and unemployment in the United States. For more information, see "Employment Situation of Veterans — 2011" (HTML) (PDF), news release USDL-12-0493.
Veterans could have served anywhere in the world during these periods of service: Gulf War era II (September 2001-present), Gulf War era I (August 1990-August 2001), Vietnam era (August 1964-April 1975), Korean War (July 1950-January 1955), World War II (December 1941-December 1946), and other service periods (all other time periods). Veterans are counted in only one period of service, their most recent wartime period. Veterans who served in more than one wartime period are classified in the most recent one. Veterans who served in both a wartime period and any other service period are classified in the wartime period.
Bureau of Labor Statistics, U.S. Department of Labor, The Economics Daily, Veterans in the civilian labor force, 2011 at https://www.bls.gov/opub/ted/2012/ted_20121109.htm (visited February 07, 2026).

