An official website of the United States government
 United States Department of Labor

| Year | Total, 16 years and older | 16-19 years | 20-24 years | 25-34 years | 35-44 years | 45-54 years | 55-64 years | 65 years and older |
|---|---|---|---|---|---|---|---|---|
1979 | 62.3 | 85.2 | 76.3 | 67.5 | 58.3 | 56.8 | 60.6 | 77.6 |
1980 | 64.2 | 89.5 | 78.1 | 69.4 | 58.3 | 56.9 | 59.4 | 76.4 |
1981 | 64.4 | 91.7 | 80.6 | 70.3 | 59.9 | 56.8 | 58.9 | 71.1 |
1982 | 65.7 | 92.9 | 82.4 | 72.1 | 61.1 | 60.1 | 61.4 | 70.3 |
1983 | 66.5 | 94.0 | 85.5 | 73.3 | 61.5 | 59.5 | 61.8 | 68.8 |
1984 | 67.6 | 93.1 | 85.2 | 74.6 | 62.0 | 59.4 | 61.5 | 66.8 |
1985 | 68.1 | 90.7 | 85.7 | 75.1 | 63.0 | 59.7 | 61.0 | 65.9 |
1986 | 69.5 | 91.4 | 87.5 | 76.1 | 63.9 | 60.9 | 61.2 | 71.5 |
1987 | 69.8 | 87.8 | 88.0 | 76.7 | 66.1 | 62.3 | 62.2 | 68.7 |
1988 | 70.2 | 89.8 | 90.0 | 77.7 | 68.5 | 61.7 | 62.3 | 70.9 |
1989 | 70.1 | 94.3 | 89.7 | 78.3 | 68.3 | 62.7 | 63.9 | 74.3 |
1990 | 71.9 | 90.8 | 90.3 | 79.3 | 69.6 | 63.8 | 63.7 | 74.4 |
1991 | 74.2 | 93.6 | 93.3 | 81.0 | 70.7 | 65.0 | 64.5 | 68.3 |
1992 | 75.8 | 94.0 | 94.3 | 82.0 | 71.9 | 65.8 | 64.9 | 77.9 |
1993 | 77.1 | 92.8 | 95.4 | 83.0 | 73.0 | 67.4 | 67.4 | 74.3 |
1994 | 76.4 | 92.5 | 94.5 | 82.9 | 72.6 | 67.1 | 66.0 | 76.2 |
1995 | 75.5 | 88.1 | 92.4 | 82.2 | 72.6 | 67.7 | 64.7 | 80.0 |
1996 | 75.0 | 88.8 | 92.8 | 83.2 | 73.3 | 68.9 | 65.3 | 70.0 |
1997 | 74.4 | 91.6 | 90.5 | 82.9 | 74.0 | 69.4 | 64.7 | 77.0 |
1998 | 76.3 | 88.6 | 89.4 | 82.9 | 73.6 | 70.5 | 68.1 | 72.6 |
1999 | 76.5 | 91.4 | 90.5 | 81.5 | 71.7 | 70.0 | 67.9 | 78.7 |
2000 | 76.9 | 92.5 | 92.7 | 82.4 | 71.6 | 73.2 | 69.1 | 75.1 |
2001 | 76.4 | 90.3 | 91.9 | 83.0 | 72.5 | 73.5 | 70.5 | 69.0 |
2002 | 77.9 | 94.6 | 93.9 | 84.5 | 75.2 | 74.6 | 71.6 | 73.8 |
2003 | 79.4 | 93.1 | 93.9 | 86.9 | 76.1 | 73.0 | 72.7 | 71.1 |
2004 | 80.4 | 92.1 | 93.8 | 87.8 | 75.6 | 72.9 | 73.0 | 74.6 |
2005 | 81.0 | 92.1 | 93.8 | 89.0 | 75.5 | 75.5 | 74.7 | 76.4 |
2006 | 80.8 | 87.6 | 94.9 | 88.2 | 77.2 | 73.5 | 72.9 | 77.5 |
2007 | 80.2 | 89.1 | 90.3 | 86.9 | 76.5 | 74.5 | 72.8 | 77.8 |
2008 | 79.9 | 87.3 | 92.5 | 88.5 | 74.5 | 74.9 | 75.4 | 74.8 |
2009 | 80.2 | 90.7 | 92.9 | 88.7 | 77.4 | 73.6 | 75.3 | 76.1 |
2010 | 81.2 | 94.6 | 93.8 | 90.8 | 79.9 | 76.5 | 75.2 | 75.7 |
2011 | 82.2 | 88.6 | 93.2 | 92.3 | 78.5 | 76.0 | 75.1 | 80.9 |
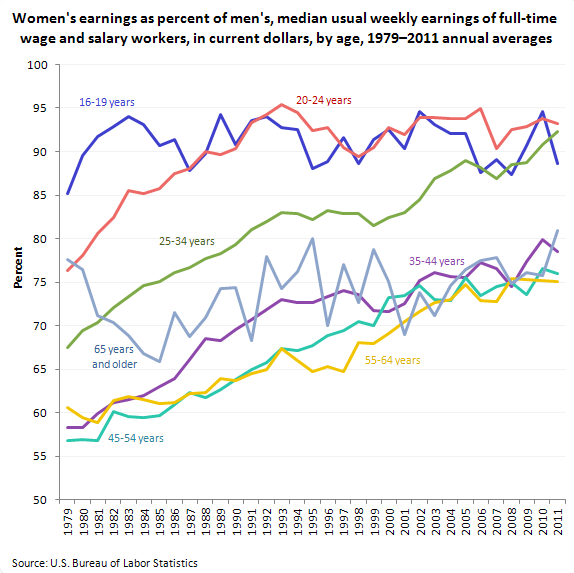
In 2011, among the age groupings of those 35 years and older, women had earnings that ranged from 75 percent to 81 percent of those of their male counterparts. Among younger workers, the earnings differences between women and men were not as large.
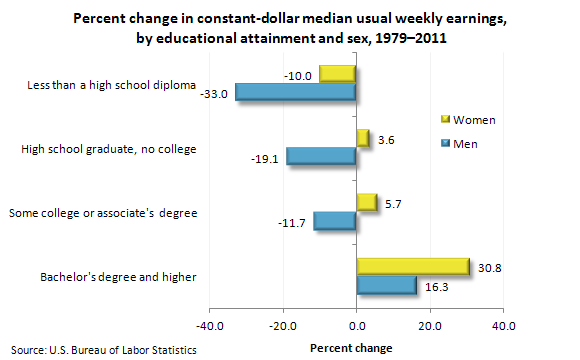
At each level of education, women aged 25 years and older have fared better than men with respect to long-term earnings growth. Although both women and men without a high school diploma have experienced declines in inflation-adjusted earnings since 1979, the drop for women was significantly less than that for men: a 10-percent decrease for women—as opposed to a 33-percent decline for men.

| Educational attainment | Percent change | |
|---|---|---|
| Men | Women | |
Less than a high school diploma | -33.0 | -10.0 |
High school graduate, no college | -19.1 | 3.6 |
Some college or associate's degree | -11.7 | 5.7 |
Bachelor's degree and higher | 16.3 | 30.8 |
On an inflation-adjusted basis, earnings for women with a college degree have increased by 31 percent since 1979, while those of male college graduates have risen by 16 percent.
These data are from the Current Population Survey. Earnings data in this article are median usual weekly earnings of full-time wage and salary workers. To learn more, see "Highlights of Women's Earnings in 2011,” BLS Report 1038 (PDF).
Bureau of Labor Statistics, U.S. Department of Labor, The Economics Daily, Women’s earnings, 1979–2011 at https://www.bls.gov/opub/ted/2012/ted_20121123.htm (visited February 04, 2026).

