
An official website of the United States government
An official website of the United States government
The .gov means it's official.
Federal government websites often end in .gov or .mil. Before sharing sensitive information,
make sure you're on a federal government site.
The site is secure.
The
https:// ensures that you are connecting to the official website and that any
information you provide is encrypted and transmitted securely.
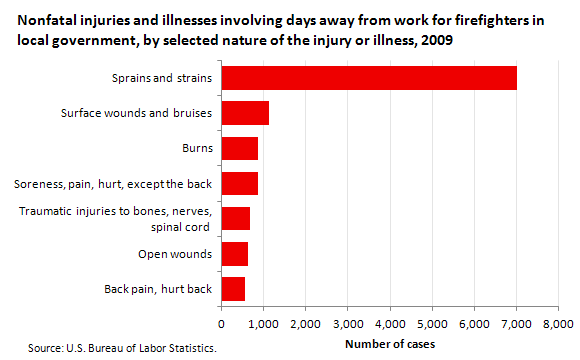
Firefighters have a risk of fatal work injury that is 26 percent higher than the risk for all workers. Firefighters also have a risk of nonfatal work injuries and illnesses that is more than twice as high as the risk for all workers. In 2009, firefighters in local government experienced 13,900 nonfatal occupational injuries and illnesses involving days away from work; sprains and strains accounted for half of all these injuries and illnesses.
| Nature of the injury or illness | Cases | Percent of total cases (13,900) |
|---|---|---|
Sprains and strains | 7,010 | 50.4 |
Surface wounds and bruises | 1,130 | 8.1 |
Burns | 870 | 6.3 |
Soreness, pain, hurt, except the back | 860 | 6.2 |
Traumatic injuries to bones, nerves, spinal cord | 670 | 4.8 |
Open wounds | 640 | 4.6 |
Back pain, hurt back | 560 | 4.0 |
Firefighters frequently climb ladders, carry hoses, and maneuver through doors, walls, and debris, all while carrying heavy protective equipment. These activities make firefighters more susceptible to sprains and strains compared with all workers. In 2009, sprains and strains for all workers in local government accounted for 42.5 percent of injuries, while sprains and strains among firefighters accounted for 50.4 percent (7,010 cases) of injuries. In addition, firefighters had an incidence rate of 257.9 cases per 10,000 full-time workers for sprains and strains, compared with 78.6 for all workers in local government. Burns in 2009 accounted for 6.3 percent (870 cases) of all injuries for firefighters, nearly five times the share for all occupations combined.
These data are from the Injuries, Illnesses, and Fatalities program. To learn more, see “Stop, drop, and roll: workplace hazards of local government firefighters, 2009,” (PDF) by Gary M. Kurlick, Monthly Labor Review, November 2012. The data on nonfatal work injuries and illnesses include career firefighters in local government and do not include unpaid volunteer firefighters. Career paid firefighters accounted for 29 percent of all firefighters in 2009, according to the National Fire Protection Association.
Bureau of Labor Statistics, U.S. Department of Labor, The Economics Daily, Work injuries and illnesses of local government firefighters in 2009 at https://www.bls.gov/opub/ted/2012/ted_20121207.htm (visited July 28, 2026).
