An official website of the United States government
 United States Department of Labor
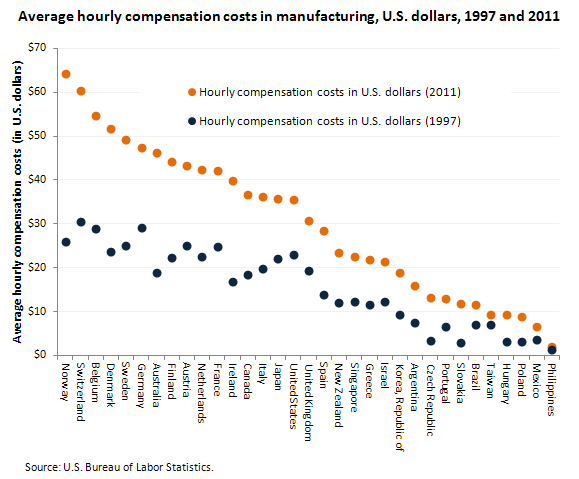
Average hourly compensation costs in U.S. manufacturing, at $35.53 in 2011, ranked approximately in the middle among 33 countries examined by the U.S. Bureau of Labor Statistics.

| Country | Hourly compensation costs in U.S. dollars (1997) | Hourly compensation costs in U.S. dollars (2011) |
|---|---|---|
Norway | $25.84 | $64.15 |
Switzerland | 30.42 | 60.40 |
Belgium | 28.92 | 54.77 |
Denmark | 23.70 | 51.67 |
Sweden | 25.02 | 49.12 |
Germany | 29.16 | 47.38 |
Australia | 18.93 | 46.29 |
Finland | 22.36 | 44.14 |
Austria | 24.91 | 43.16 |
Netherlands | 22.45 | 42.26 |
France | 24.86 | 42.12 |
Ireland | 16.69 | 39.83 |
Canada | 18.49 | 36.56 |
Italy | 19.76 | 36.17 |
Japan | 21.99 | 35.71 |
United States | 23.04 | 35.53 |
United Kingdom | 19.30 | 30.77 |
Spain | 13.95 | 28.44 |
New Zealand | 12.06 | 23.38 |
Singapore | 12.15 | 22.60 |
Greece | 11.61 | 21.78 |
Israel | 12.28 | 21.42 |
Korea, Republic of | 9.22 | 18.91 |
Argentina | 7.55 | 15.91 |
Czech Republic | 3.25 | 13.13 |
Portugal | 6.45 | 12.91 |
Slovakia | 2.84 | 11.77 |
Brazil | 7.07 | 11.65 |
Taiwan | 7.04 | 9.34 |
Hungary | 3.05 | 9.17 |
Poland | 3.15 | 8.83 |
Mexico | 3.47 | 6.48 |
Philippines | 1.28 | 2.01 |
In addition to Norway ($64.15), Australia ($46.29), Canada ($36.56), Italy ($36.17), and Japan ($35.71), countries with hourly compensation costs in manufacturing that were higher than those experienced by the United States were primarily in northern and western Europe. Countries with lower hourly compensation costs were primarily in southern and eastern Europe, Asia, and Latin America. These countries included the United Kingdom ($30.77), Republic of Korea ($18.91), Brazil ($11.65), Taiwan ($9.34) and the Philippines ($2.01).
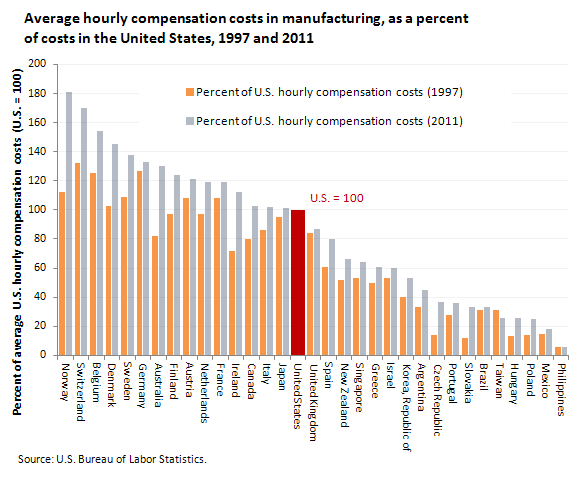
Between 1997 and 2011, compensation costs in manufacturing as a percent of U.S. costs increased or remained the same in all economies compared except Taiwan, improving U.S. cost competitiveness.

| Country | Percent of U.S. hourly compensation costs (1997) | Percent of U.S. hourly compensation costs (2011) |
|---|---|---|
Norway | 112 | 181 |
Switzerland | 132 | 170 |
Belgium | 125 | 154 |
Denmark | 103 | 145 |
Sweden | 109 | 138 |
Germany | 127 | 133 |
Australia | 82 | 130 |
Finland | 97 | 124 |
Austria | 108 | 121 |
Netherlands | 97 | 119 |
France | 108 | 119 |
Ireland | 72 | 112 |
Canada | 80 | 103 |
Italy | 86 | 102 |
Japan | 95 | 101 |
United States | 100 | 100 |
United Kingdom | 84 | 87 |
Spain | 61 | 80 |
New Zealand | 52 | 66 |
Singapore | 53 | 64 |
Greece | 50 | 61 |
Israel | 53 | 60 |
Korea, Republic of | 40 | 53 |
Argentina | 33 | 45 |
Czech Republic | 14 | 37 |
Portugal | 28 | 36 |
Slovakia | 12 | 33 |
Brazil | 31 | 33 |
Taiwan | 31 | 26 |
Hungary | 13 | 26 |
Poland | 14 | 25 |
Mexico | 15 | 18 |
Philippines | 6 | 6 |
These data are from the International Labor Comparisons program. To learn more, see "International Comparisons of Hourly Compensation Costs in Manufacturing, 2011," (HTML) (PDF) news release USDL-12-2460.
Bureau of Labor Statistics, U.S. Department of Labor, The Economics Daily, Manufacturing compensation costs in foreign countries and in the United States, 2011 at https://www.bls.gov/opub/ted/2012/ted_20121221.htm (visited February 18, 2026).

